
Present address: Department of Mechanical Engineering, University of Michigan, 2350 Hayward St, Ann Arbor, MI, 48109, United States.
Serial measurement of a large panel of protein biomarkers near the bedside could provide a promising pathway to transform the critical care of acutely ill patients. However, attaining the combination of high sensitivity and multiplexity with a short assay turnaround poses a formidable technological challenge. Here, the authors develop a rapid, accurate, and highly multiplexed microfluidic digital immunoassay by incorporating machine learning-based autonomous image analysis. The assay has achieved 12-plexed biomarker detection in sample volume <15 μL at concentrations < 5 pg/mL while only requiring a 5-min assay incubation, allowing for all processes from sampling to result to be completed within 40 min. The assay procedure applies both a spatial-spectral microfluidic encoding scheme and an image data analysis algorithm based on machine learning with a convolutional neural network (CNN) for pre-equilibrated single-molecule protein digital counting. This unique approach remarkably reduces errors facing the high-capacity multiplexing of digital immunoassay at low protein concentrations. Longitudinal data obtained for a panel of 12 serum cytokines in human patients receiving chimeric antigen receptor-T (CAR-T) cell therapy reveals the powerful biomarker profiling capability. The assay could also be deployed for near-real-time immune status monitoring of critically ill COVID-19 patients developing cytokine storm syndrome.
Over the past few years, the approach of providing personalized treatment for severely ill patients based on their individualized molecular profiles has received considerable attention as a next step to advance critical care medicine (Sarma et al., 2020; Seymour et al., 2017; van der Poll et al., 2017). Progress has been made in identifying predictive and prognostic protein biomarkers in critical care which holds great promise in patient stratification (Calfee et al., 2018; Wong et al., 2008), disease monitoring (Faix 2013; Kibe et al., 2011), and therapy development (Schuetz et al., 2018; van der Poll et al., 2017). However, even with the discoveries of these biomarkers, the medical community still falls behind with adopting the precision medicine approach to treat life-threatening acute illnesses, such as cytokine release syndrome (CRS), acute respiratory distress syndrome (ARDS) in the global outbreak of the coronavirus disease 2019 (COVID-19) (Chen et al., 2020; Huang et al., 2020; Sinha et al., 2020). Part of the reasons come from the lack of a sensitive molecular profiling tool to quickly guide clinical decisions or interventions with a near-real-time assay turnaround (Chen et al., 2015a, Hosseini et al., 2020; Russell et al., 2020). Additionally, to monitor highly heterogeneous and time-pressing illness conditions, high multiplex capacity is equally as important as sensitivity and speed for improving diagnosis and prognosis accuracy with rich, comprehensive information on multiple biomarker profiles (Hay et al., 2017; Huang et al., 2020; Sarma et al., 2020; Teachey et al., 2016). At present, the commonly used bioanalytical tools for multiplex serum/plasma protein analysis (Cohen and Walt 2019), including the bead-based assay coupled flow cytometry or protein microarrays, fall short of achieving the performance needed for critical care as they require a long assay turnaround (>4 h), and laborious steps with limited sensitivity.
Researchers have developed rapid (Jing et al., 2019; Park et al., 2020; Song et al., 2017; Tan et al., 2017), point-of-care (Min et al., 2018; Park et al., 2017; Reddy et al., 2018), and multiplex (Chen et al., 2015b; Fan et al., 2008) immunoassays powered by microfluidics. Nonetheless, it is still challenging for these assays to simultaneously achieve a combination of high multiplexity and sensitivity with a rapid assay turnaround time in a clinical setting. By counting single-molecule reactions in fL-nL-volume microwells or droplets (Rissin et al., 2010; Yelleswarapu et al., 2019), digital immunoassays can provide unprecedented sensitivity (sub-fM detection) for biomarker analysis. Contrary to the conventional belief based on Poisson statistical theory (Zhang and Noji 2017), our recent studies (Song et al., 2020, Song et al., 2021) have demonstrated that it is feasible to extend the single-molecule counting approach to achieve rapid protein biomarker profiling at a clinically relevant pM-nM range by quenching reagent reaction at an early pre-equilibrium stage. However, existing digital immunoassay platforms (Rivnak et al., 2015) still have limited multiplex capacity (up to 6-plex). The current method (Rissin et al., 2013; Yelleswarapu et al., 2019) utilizes fluorescence dye-encoded beads to identify different analytes. Unfortunately, the nature of binary-based statistical counting brings a few critical challenges to multiplexing digital immunoassays with this method. First, the assay typically requires a large number of beads (e.g. Simoa uses 100,000 beads per plex (Rivnak et al., 2015)) for reliable analyte quantification. Mixing and counting such a large number of multi-color-encoded beads tends to cause false signal recognition due to optical crosstalk or non-uniform color coding. Second, increasing multiplexity while keeping the assay's sensitivity and accuracy additionally requires a large number of microwell arrays to accommodate the large number of beads. This becomes impractical with the current platform as it demands a significantly increased assay device footprint and an image area size. Third, the assay also encounters a significant bead loss during the digitization process partitioning the beads into sub-volumes after the initial reaction process performed for bulk reagent volume in a cuvette (100 μL). All of these issues prohibit the translation of a cheap, robust, point-of-care multiplexed digital assay platform into near-patient applications, thus necessitating a new strategy.
Here, we have developed a highly multiplexed digital immunoassay platform, termed the “pre-equilibrium digital enzyme-linked immunosorbent assay (PEdELISA) microarray.” The PEdELISA microarray analysis integrates on-chip biosensors with a small footprint to minimize the number of images that are needed to read and fully automate the signal counting process, both of which are critically necessary for overcoming the bottlenecks against multiplexing digital assays. Compared to our previous platform (Song et al., 2021), the new PEdELISA microarray platform presented in this study significantly extends the multiplex capacity by incorporating a powerful microfluidic spatial-spectral encoding method and a machine learning-based image processing algorithm. The spatial-spectral encoding method confines color-encoded magnetic beads into the arrayed patterns of microwells on a microfluidic chip. The locations of the microwell patterns on the chip indicate which target analytes are detected by trapped color-coded beads. In contrast to the existing digital immunoassay protocol, the fully integrated microfluidic architecture allows the assay reaction to be performed entirely on-chip (no bead loss), which only requires a 15 μL sample volume, a 5-min assay incubation and a 75 mm × 50 mm chip size. Based on a convolutional neural network (CNN), the machine learning algorithm permits unsupervised image data analysis while resolving false signal recognition accompanying the multiplexing of digital immunoassays. Employing these biosensing schemes, the PEdELISA microarray platform allows us to simultaneously quantify a large panel of biomarkers without sacrificing the accuracy. We used the platform to measure longitudinal blood samples from human patients experiencing cytokine release syndrome (CRS) after chimeric antigen receptor T cell (CAR-T) therapy. The data signify the time-course evolution of 12 circulating cytokines over illness development. With its rapid assay turnaround and analytical power, the platform manifests great potential to enable acute immune disorder monitoring that guides timely therapeutic interventions.
We purchased human IL-1α, IL-1β, IL-6, IL-8, IL-10, IL-12, IL-15, IL-17A, TNF-α, IFN-γ, and MCP-1 capture, and biotinylated detection antibody pairs from BioLegend and IL-2 from Invitrogen™. We purchased the LEGENDplex™ Human Inflammation Panel 1 bead-based immunoassays from BioLegend, We obtained Dynabeads, 2.7 μm-diameter carboxylic acid, and epoxy-linked superparamagnetic beads, avidin-HRP, QuantaRed™ enhanced chemifluorescent HRP substrate, Alexa Fluor™ 488 Hydrazide, EDC (1-ethyl-3-(3-dimethylaminopropyl) carbodiimide hydrochloride), Sulfo-NHS (Sulfo-N-hydroxysulfosuccinimide), MES (2-(N-morpholino)ethanesulfonic acid) buffered saline, bovine serum albumin (BSA), TBS StartingBlock T20 blocking buffer, and PBS SuperBlock blocking buffer from Thermo Fisher Scientific. We obtained Phosphate buffered saline (PBS) from Gibco™, Sylgard™ 184 clear polydimethylsiloxane (PDMS) from Dow Corning, and Fluorocarbon oil (Novec™ 7500) from 3M™.
We prepared the non-color encoded magnetic beads by conjugating epoxy-linked Dynabeads with the capture antibody molecules at a mass ratio of 6 μg (antibody): 1 mg (bead). The Alexa Fluor™ 488 (AF488) encoded magnetic beads were prepared by first labeling carboxylic acid-linked Dynabeads with AF 488 Hydrazide dye and then by conjugating the beads with capture antibody at a mass ratio of 12 μg (antibody): 1 mg (bead) using standard EDC/sulfo-NHS chemistry. Detailed protocol has been described in the previous publication (Song et al., 2020). We stored the antibody-conjugated magnetic beads at 10 mg beads/mL in PBS (0.05% T20 + 0.1% BSA + 0.01% Sodium Azide) buffer wrapped with an aluminum foil sheet at 4 °C. No significant degradation of these beads was observed within the 3-month usage.
Blood samples were collected from patients receiving CAR-T cell therapy and was performed with informed consent under the University of Michigan Institutional Review Boards (IRB) protocol . Venous blood was collected into a vacutainer containing no anticoagulant on-site at the University of Michigan Medical School Hospital and transported it to a biological lab. After allowing the sample to clot for a minimum of 30 min at room temperature, we isolated serum by centrifuging the vacutainer at 1200×g, for 15 min at room temperature. The serum was removed by a pipette, aliquoted into screw cap tubes, and then stored at −80 °C prior to the assay.
All assay reagents were prepared in 96-well plate low retention tubes and kept on ice until use. The reagent preparation involved preparing a mixture of the biotinylated detection antibody (up to 12 cytokines for CAR-T study) in a carrier protein buffer (0.1% BSA, 0.02% Sodium Azide) and storing it at 4°C, and preparing an Avidin-HRP solution in a superblock buffer at 100 pM. For the PEdELISA chip calibration, we prepared a cocktail of recombinant proteins in 50% fetal bovine serum (standard solution), which was 5x serially diluted from 2.5 ng/mL to 0.16 pg/mL. As the first step of the assay, we mixed the sample/standard solution (15 μL) and the biotinylated detection antibody solution (15 μL) (sample mixture). Then, we loaded these sample and standard mixtures into the detection channels in parallel and incubated the chip for 300 s. The microfluidic channels were then washed with a PBS-T (0.1% Tween20) solution at 50 μL/min by a syringe pump for 2 min. 40 μL of the avidin-HRP solution was then loaded into the channel and incubate for 1 min. The chip was washed again with the PBS-T (0.1% Tween20) solution at 50 μL/min for 5 min. To reduce the interference between Tween20 and the enhanced chemifluorescent HRP substrate (QuantaRed substrate), we exchanged the PBS-T solution remaining in the channels with a 1x PBS solution. After loading 30 μL of the QuantaRed substrate solution, the channels were sealed with 35 μL of fluorinated oil (HFE-7500, 3M). A programmable motorized fluorescence optical microscopy system was used to scan the image of the bead-filed microwell arrays on the microfluidic chip, identify the bead type (non-color vs. AF488 dyed), and detect the enzyme-substrate reaction activity. This system is composed of a Nikon Ti–S fluorescence microscope (10x objective), a programmable motorized stage (ProScan III), a mercury lamp fluorescence illumination source, a SONY full-frame CMOS camera (α7iii). The motorized stage was pre-programmed to follow the designated path to scan the entire chip (120 images) in 3 sequential steps: 1. Scan the QuantaRed channel (532nm/585 nm, excitation/emission) 2. Scan the AF488 channel (495nm/519 nm, excitation/emission) 3. Scan the brightfield. It typically took around 5–7 min to scan the entire chip for 10 samples in 12-plex detection.
The “Average number of Immune-complex formed per Bead (AIB)” was extracted as the raw signal for the PEdELISA assay. Briefly, the developed CNN algorithm was used to first count the total number of capturing beads (Ntot) and the enzyme active beads number (Nactive) for a given cytokine analyte. Then the fraction of enzyme active beads was calculated as OnRate = Nactive/Ntot. Assuming that the analyte binding events on each bead follow the Poisson distribution probability, which is given as P(x = k) = λk/k! exp(-λ),where k is the number of occurrences, and λ is the average number of events, the OnRate equivalent to the probability P for k = 1, 2, 3, 4, …, ∞ is given as OnRate = 1-P(x = k = 0). Thus, the AIB = λ was calculated as AIB = -ln(1-OnRate). The standard curve for the analyte was obtained by fitting a 4-parameter logistics regression curve to the AIB values against the analyte concentrations. Finally, the analyte concentration corresponding to the raw AIB signal was traced back from the standard curve for the analyte.
Experiments with both synthetic recombinant proteins (for assay standard curves) and CAR-T patient samples at each time point were performed 3 times (in independent tests) with two on-chip repeats. The standard deviation was calculated to obtain the error bar. Group differences were tested using a two-tailed unequal variance t-test. A p-value of <0.05 was considered to be statistically significant.
The PEdELISA microarray analysis used a microfluidic chip fabricated using polydimethylsiloxane (PDMS)-based soft lithography. The chip contains parallel sample detection channels (10–16) on a glass substrate, each with an array of hexagonal biosensing patterns (Fig. 1 ). The hexagonal shape allows each biosensing pattern to densely pack 43,561 fL-sized microwells, which fits into the entire field of view of a full-frame CMOS sensor through a 10x objective lens (Figure S1). Prior to the assay, we deposited magnetic beads (d = 2.8 μm) encoded with non-fluorescent color (no color) and those with Alexa Fluor® 488 (AF 488) into physically separated microwell arrays (Figure S2). These beads were conjugated with different capture antibodies according to their colors and locations on the chip. In the current design, the arrangement of 2 colors and 8 arrayed biosensing patterns in each detection channel allows the PEdELISA microarray chip to detect 2 × 8 = 16 protein species (16-plex) at its maximum capacity for each sample loaded to the detection channel. Compared with a single color-encoded method, this combination greatly reduces potential optical crosstalk and fluorescence overlap during a signal readout process. The pre-deposition ensures a fixed number of beads to target each biomarker, which allows more accurate digital counting for each biomarker. It also eliminates bead loss during the conventional partitioning process and achieves nearly a 100% yield in the signal readout for enzyme active QuantaRed™ (Qred)-emitting beads (“On” beads or “Qred+” beads). The microwell structure (diameter: 3.4 μm and depth: 3.6 μm) was designed to generate sufficient surface tension to hold beads in the microwells. This kept false signals resulting from physical crosstalk between the trapped beads at a negligible level (Figure S3).

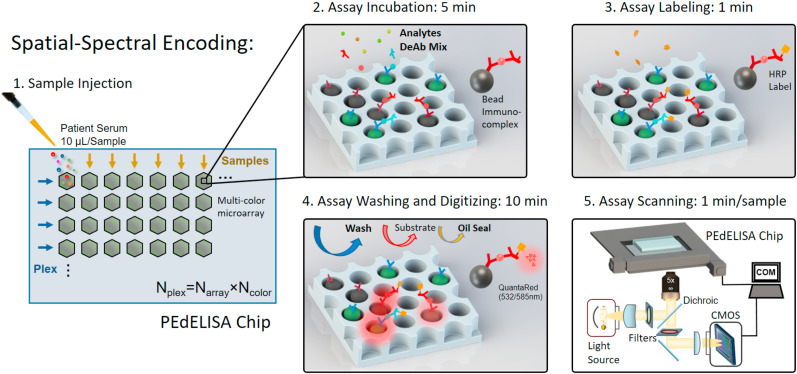
Concept of microfluidic spatial-spectral encoding method used for multiplexing digital immunoassay. Fluorescence color-encoded magnetic beads coated with different capture antibodies are pre-deposited into the array of hexagonal-shaped biosensing patterns in the microfluidic detection channel. The locations of the biosensing patterns are physically separated from each other. This arrangement yields Ncolor × Narray measurement combinations determining the assay plexity, Nplex, where Ncolor is the total number of colors used for encoding beads deposited in each biosensing pattern, and Narray is the total number of the arrayed biosensing patterns in each detection channel. In this study, Ncolor = 2 (non-fluorescent and Alexa Fluor® 488: AF488), Narray = 6 which forms a Nplex = 12 cytokine panel. The streamlined pre-equilibrium reaction process comprises a 5-min assay incubation with samples and detection antibody mix, 1-min assay labeling, followed with 10-min assay washing, substrate loading and oil sealing. The imaging was then performed on a motorized x-y fluorescence scanning stage programmed by MATLAB at the rate of 1min/sample. (For interpretation of the references to color in this figure legend, the reader is referred to the Web version of this article.)
There is another unique challenge to applying the digital assay approach for near-real-time cytokine profiling with high multiplex capacity. The assay needs to provide a truly rapid and accurate data analysis (without human supervision) originating from ~7 million microwells per chip. Additionally, the signal counting process needs to distinguish precisely between images of multi-color bead-filled and empty microwells and to identify signals accurately while subjected to a large fluorescence intensity variance, occasional image defects due to experimental errors, and image focus shifts. These challenges make the conventional image processing method with the thresholding and segmentation (GTS) scheme (Figure S4A) inaccurate and require human supervision for error correction in handling digital assay images. Mu et al. (Gou et al., 2019; Hu et al., 2019) showed that the use of machine learning algorithms would provide promising solutions to significantly improve the accuracy of digital assay image processing. However, this approach is only applied for single-color images with a small number of microreactors (a few thousand) with 1080 × 1120 pixels, which is impractical for high-throughput analysis. To address these challenges, we developed a novel dual-pathway parallel-computing algorithm based on convolutional neural network (CNN) visualization for image processing.
The CNN-based analysis procedure (Fig. 2 ) includes multi-color fluorescence image data read-in/pre-processing (image crop, noise filtering, and contrast enhancement), microwell/bead image segmentation by pre-trained dual-pathway CNN, post-processing, and result output. The key component, dual-pathway CNN, was pre-trained to classify and segment image pixels by labels of (I) fluorescence “On” (Qred channel) microwells, (II) Alexa Fluor® 488 color-encoded beads (AF488 channel), (III) image defects, and (IV) background. The architecture of the network (Fig. 2) is separated into a downsampling process for category classification and an upsampling process for pixel segmentation. The downsampling process consists of 3 layers, including 2 convolution layers (4–6 filters, kernel of 3 × 3) with a rectified linear unit (ReLU), and a max-pooling layer (stride of 2) in between. The upsampling process consists of a transposed convolution layer with ReLU, a softmax layer and a pixel classification layer. To speed up the training process, we started with dividing an image with 32 × 32 pixels and classifying them with the labels and then eventually expanding the image pixel size to 256 × 256 using a pre-trained network (Figure S5). We found a large intensity variance across the optical signals from beads in different microwell reactors. As a result, the intensity-based labeling of microwells leads to recognition errors. Microwells with bright beads can be misrecognized to have larger areas with more pixels than those with dim beads. Instead, given that all microwells are lithographically patterned to have an identical size, we labeled them using the same pre-fixed area scale (octagon, r = 3 pixel for microwell, disk, r = 2 pixel for bead) regardless of their image brightness to make the machine to recognize them correctly. The majority of pixel labels are for the background (Label IV) with no assay information in typical digital assay images. We used the inverse frequency weighting method to further enhance the classification accuracy, which gives more weights to less frequently appearing classes that are identified by Labels (I), (II), and (III) (See Supporting Information and Figure S5 for training details).
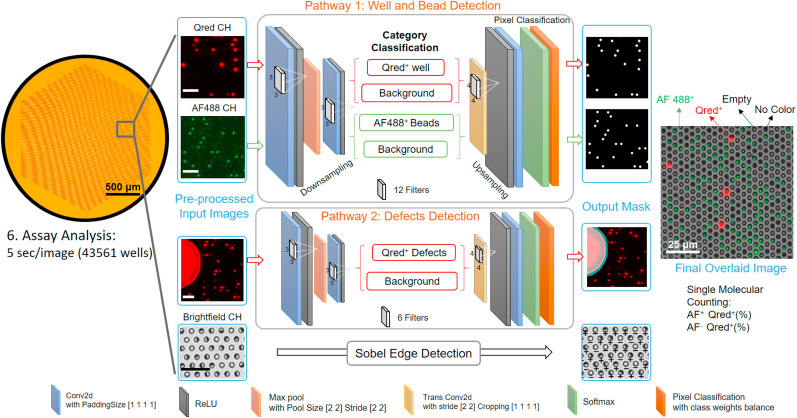
A convolutional neural network-guided image processing algorithm for high throughput and accurate single molecule counting. Two neural networks were run in parallel, reading multi-color fluorescence image data, recognizing target features versus defects, and generating an output mask for post data processing. The brightfield image was analyzed using a Sobel edge detection algorithm. The images were finally overlaid to determine the fraction of enzyme active beads emitting QuantaRed™ signal (Qred + beads) to total beads for each color label. The unlabeled scale bars are 25 μm. (For interpretation of the references to color in this figure legend, the reader is referred to the Web version of this article.)
In contrast to a previously reported study (Hu et al., 2019), we greatly reduced the number of convolution layers and filters (depth of network) for high speed processing. Our algorithm employs much fewer labels and features required for image processing than those for other typical CNN applications, such as autonomous driving. The unique feature of our algorithm is the ability to run two neural networks in parallel for two detection pathways: one for assay targets (e.g. microwells, beads, and fluorescence signals) and the other for defects. This allows the image processing to achieve high speed while maintaining good precision. As a result, it only took ~5 s (CPU: Intel Core i7-8700, GPU: NVIDIA Quadro P1000) to process two-color channel data for two 6000 × 4000 pixel images which contain 43561 micro-reactors.
To validate the effectiveness of the dual-pathway CNN method developed in this work, we compared its performance with that of the standard method based on global thresholding and segmentation (GTS). Fig. 3 A shows representative two-color-channel images causing errors to the image labeling and signal counting of the GTS method. These errors are corrected by the CNN method. For example, false signal counting derives from chip defects or poor labeling reagent confinements within individual microwell reactors due to the local failure of oil sealing. Defocusing can cause two neighboring microwells to be dilated with each other. Highly bright Qred fluorescence from an “On” microwell can cause secondary illumination to light up neighboring microwells. This results in “optical crosstalk” between neighboring microwells (Rissin et al., 2013), which causes the false counting of secondarily illuminated microwells as “On” sites. The uneven illumination of excitation light causes the failure of recognizing dim AF-488 encoded beads (recognized as non-color beads).
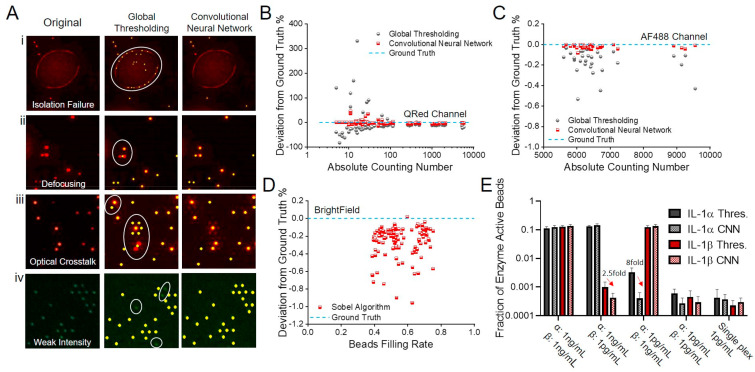
Image processing by convolutional neural network (CNN) and global thresholding and segmentation (GTS) methods (A) representative images causing false signal counting (red dot: Qred + microwell, green dot: AF-488-colored bead, yellow dot: recognized spot to be counted). (i) The circle represents an area covered by an aqueous reagent solution that is spread over multiple microwell sites due to poor confinement during the oil sealing process. GTS counts potentially false and unreliable signal spots from the area. CNN removes the area from counting. (ii) Image defocusing causes GTS to merge two signal spots from a pair of the neighboring Qred + microwells in the circle and to count it as a single signal spot. (iii) Secondary illumination of microwell sites due to optical crosstalk in the circle results in their false counting by GTS. (iv) GTS fails to label and count microwell sites holding dim AF-488-colored beads. Error analysis of CNN and GTS methods on (B) Qred-channel (C) AF488-channel and (D) brightfield images. (E) Tests assessing the impact of optical crosstalk on the accuracy of CNN and GTS using dual-color IL-1α and IL-1β detection by spiking (i) IL-1α:1 ng/mL IL-1β:1 ng/mL (ii) IL-1α:1 ng/mL IL-1β:1 pg/mL (iii) IL-1α:1 pg/mL IL-1β:1 ng/mL (iv) IL-1α:1 pg/mL IL-1β:1 pg/mL (v) IL-1α:1 pg/mL IL-1β:1 pg/mL assay in single plex for validation. All assays were performed in fetal bovine serum buffer. (For interpretation of the references to color in this figure legend, the reader is referred to the Web version of this article.)
In the CNN training process, we collected a large number of images for each error source and used them to train the neural network to achieve results similar to those from manual counting with the human eyes. We applied the following equation to evaluate the error in terms of deviation to the ground truth (%):
In counting enzyme-active microwells with the Qred channel, we observed that the deviation percentage from ground truth varied with the number of the counted “On” (Qred+) microwells, which is proportional to the analyte concentration. Each data point in Fig. 3B–D was taken for a hexagonal-shaped biosensing pattern (Fig. 2) that contains 43561 microwell arrays with an average bead filling rate of 55.1%. In these data, the number of Qred + microwells ranged from 1 to 10000 (Fig. 3B). At higher analyte concentrations (NQred>100), both of the methods achieved reasonably high accuracy with a deviation to the ground truth of 3.92% (CNN) and 9.96% (GTS). However, at the lower concentrations (NQred<100), this deviation became significant (CNN: 5.14% GTS: 71.6%). The larger error of the GTS scheme is attributed to the false counting of regions contaminated with fluorescent reagents and the miscounting of Qred + microwells of low fluorescence intensity. Thus, the dual-pathway CNN greatly improved the accuracy of the PEdELISA image processing and replacing the thresholding method with our CNN method eliminated the need for human supervision to correct the significant errors in the low concentration region.
In counting color-encoded magnetic beads with the AF-488 channel, we found that the deviation was very small (CNN: 0.021%, GTS: 0.161%). The deviation was suppressed by the little spectral overlap between AF488 and Qred, channels and the high image contrast that we intentionally created between AF-488 and non-color encoded beads (Fig. 3C). Some miscounting under the uneven spatial distribution of illumination light intensity and the spherical aberration of objective lens over the entire field of view still contributed to the deviation. The CNN method achieved a nearly 8-fold improvement of accuracy. Counting the total number of beads (both no color and fluorescence color-encoded ones) with brightfield images using a customized Sobel edge detection algorithm yielded an average deviation to the ground truth of 0.256% (Fig. 3D).
To verify our ability to suppress optical crosstalk in the multiplexed assay incorporating the CNN method, we prepared a fetal bovine serum (FBS) sample spiked with two different cytokine species of 1000-fold concentration difference: IL-1α (AF488 encoded) and IL-1β (non-color encoded). Optical crosstalk becomes problematic especially in multiplexed analysis, where the quantity of one biomarker can be serval orders of magnitude higher than those of other biomarkers in the same sample. A slightly false recognition can even give a significantly higher value of biomarker concentration than its true value. Fig. 3E shows the comparison between the conventional GTS method and the CNN method. False recognition was greatly reduced by the CNN method and we verified that 1 pg/mL of IL-1α or IL-1β will not interfere even when the other protein reaches 1 ng/mL. Furthermore, we performed single-plexed measurements of 1 pg/mL of IL-1α and IL-1β, which give “true” signal levels without optical crosstalk. The single- and dual-plexed measurements both yielded statistically similar results with the CNN method (two-tailed unequal variance t-test, IL-1α P = 0.253; IL-1β = 0.368), which proves the accuracy of this method under the presence of strong crosstalk potential.
Using 2-color encoded (AF488, non-color) magnetic beads with 8 physically separated microarrays, we designed a microfluidic chip to detect 12 cytokines (up to 16-plex) simultaneously (see chip design in Figure S6). Fig. 4 A shows standard curves obtained from PEdELISA microarray analysis with CNN image processing for cytokines ranging from 0.16 pg/mL to 2.5 ng/mL. To mimic the serum detection background, we choose to use 50% FBS as the detection buffer, which has been previously verified to match with human serum background (typical 2–4 fold dilution) (Song et al., 2020). Here, the assay was performed for a system at the early pre-equilibrium state of a sandwich immune-complex formation reaction process with a 5-min incubation period, followed by a 1-min enzymatic labeling process. The incubation time was optimized previously (Song et al., 2020) to maintain a good balance between the speed and the sensitivity (<5 pg/mL) within the clinically relevant dynamic range (~3 orders). Table S2 summarizes the values of the limit of detection (LOD) and limit of quantification (LOQ) and the coefficient of variance of the assay for each cytokine. The antibody-antigen affinity affects the LOD of the assay, and it varies across the detected cytokine species, although the capture antibody-conjugated beads were prepared by the same protocol regardless of the analyte types (See Methods Section).
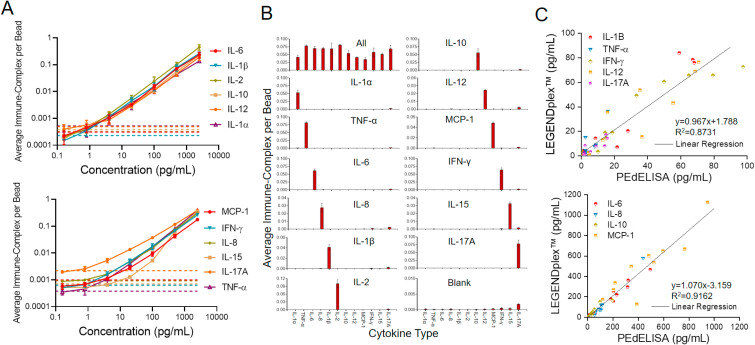
PEdELISA microarray performance characterization. (A) Assay standard curves for 12 cytokines from 0.16 pg/mL to 2500 pg/mL in fetal bovine serum (FBS). Three independent tests with two on-chip repeats were performed using recombiant proteins (error bar = standard deviation: σ). The dotted line represents the blank signal + 3σ for each analyte which was later used to determine the limit of detection (LOD). The LOD, limit of quantification (LOQ), and standard root mean square coefficient of variance (RMS CV) of each cytokine were calculated and summarized in Table S2. (B) Assay specificity test with FBS “all-spike-in,” “single-spike-in,” and “no-spike-in” (negative) samples. The analyte concentration of 500 pg/mL was used to assess the false positive and background signals. (C) Validation of the multiplex PEdELISA by BioLegend's bead-based LEGENDplex™ assay using banked CAR-T patient serum samples. A better agreement was generally observed for the group of abundant cytokines (R2 = 0.916) than for the group of low-abundant cytokines (R2 = 0.873). This may be attributed to potential error in the LEGENDplex™ assay with poorer sensitivity than the digital immunoassay.
We further assessed the level of antibody cross-reactivity among 12 cytokines in FBS. Fig. 4B shows the assay results for sera spiked by all, one, or none of the recombinant cytokines of 12 species, namely “all-spike-in,” “single-spike-in,” and “no-spike-in” samples. We observed more than 100 times lower background signals from the no-spike-in (negative) sample than those from the all-spike-in sample across the 12 cytokines, except for IL-17A whose data shows a slightly higher background level. This could be due to the difference in antibody pair-to-the antigen affinity, or due to the high concentration of anti-IL-17A antibodies existing in the detection antibody cocktail. The signal-level variation across the 12 cytokines at the same concentration from the all-spike-in and single-spike-in samples could derive from the different levels of analyte-antibody affinity for these cytokines. Overall, the signal from each of the 12 single-spike-in samples manifests a negligible cross-reactivity between each cytokine analyte and other capture and detection antibodies that should not couple with it.
Lastly, we validated the PEdELISA using the BioLegend's LEGENDplex™ multiplex assay (Fig. 4C). Here, both assays were tested for ten banked patient serum samples with the same detection antibodies and assay standard cocktails. The results were grouped into low-concentration and high-concentration cytokine groups. The data between these two methods matched linearly (R2 = 0.873 and 0.916) for all nine cytokine species within this LEGENDplex™ panel. The high-concentration cytokine measurements have a better agreement (R2 = 0.916) than the low-concentration ones (R2 = 0.873), which may be attributed to the limited ability of the LEGENDplex™ assay to detect low-abundance analytes as compared to the digital immunoassay platform.
We applied the 12-plex PEdELISA microarray analysis for the longitudinal serum cytokine measurement from patients receiving CAR-T cell therapy. CAR-T therapies have demonstrated remarkable anti-tumor effects for treatment-refractory hematologic malignancies (Maude et al., 2018; Neelapu et al., 2017). Unfortunately, up to 70% of leukemia and lymphoma patients who receive CAR-T therapy experience cytokine release syndrome (CRS). CRS is a potentially life-threatening condition of immune activation caused by the release of inflammatory cytokines (e.g., IL-6, TNF-α, and others) (Lee et al., 2014; Neelapu et al., 2018). CRS initially causes fevers and other constitutional symptoms that can rapidly (i.e., within 24 h) progress to hypotension and organ damage requiring intensive care. Previous studies (Hay et al., 2017; Teachey et al., 2016) have shown the measurement of a panel of cytokines can detect early onset of severe CRS. Thus, intervention in CRS could potentially be improved by the multiplex PEdELISA analysis.
To demonstrate the clinical utility of the assay technology, we ran our 12-plex assay for two CAR-T patients, one who experienced up to grade 2 CRS and one who did not experience CRS in the first two weeks after the CAR-T infusion. The rapid measurement was performed with sample-to-answer time within 40 min (5min incubation + 1min labeling). Fig. 5 shows the longitudinal cytokine profiles and the clinical standard inflammatory markers C-reactive protein (CRP) and Ferritin for these two patients. For Patient 1, we observed an increase of the T cell marker IL-2 on the first few days after CAR-T infusion which presumably, indicates the normal CAR-T cell expansion was taking place in the patient's body. The onset of CRS on Day 4 (grade 1) accompanied the simultaneous elevations of several key cytokines, such as IL-6, IL-8, IL-10, IL-12, IFN-γ, and MCP-1. In contrast, we did not observe any significant elevations for TNF-α, IL-1β, IL-2, and IL-17A during this period. The CRS conditions lasted for two days (Day 4 and 5) and the patient did not receive immunomodulatory medications during this period. The overall cytokine levels decreased after the CRS period. Interestingly, a peak of CRP, a clinical surrogate marker, was detected on Day 5 while the cytokine peaks were detected earlier on Day 4, thus suggesting that those cytokines have better response to the onset of CRS. We did not observe any response of ferritin to CRS. This confirms the need for rapid, direct measurement of the key cytokines to provide timely information about the disease deterioration. We also conducted a similar analysis for a patient who did not develop CRS (Patient 2). We recorded an overall low levels of cytokines without significant changes throughout the analysis except for slightly increase of IL-8 and MCP-1 after the CAR-T cell infusion for this patient.
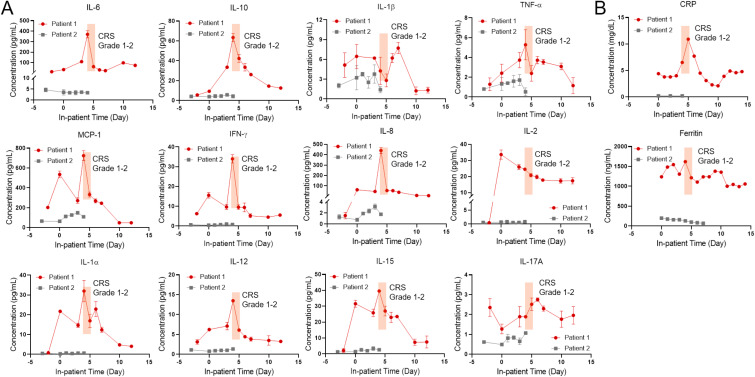
(A) 12-plex longitudinal cytokine measurements for CAR-T patients suffering CRS (red line, Patient 1) and no CRS (black line, Patient 2). Day 0 represents the day of CAR-T cell infusion. Data before Day 0 represents the baseline. The shaded region marks the period for which the patient manifested CRS symptoms (Grade 1 on Day 4, Grade 2 on Day 5). (B) Longitudinal concentration profiles of C-reactive protein (CRP) and ferritin, clinically standard inflammatory biomarkers, during the in-patient period. (For interpretation of the references to color in this figure legend, the reader is referred to the Web version of this article.)
Extending the multiplex capacity of digital immunoassay would greatly broaden its utility in the continuous monitoring of protein biomarkers for critically ill patients. However, multiplexing the assay becomes enormously difficult with an increasing number of target biomarkers. In conventional methods, concurrent digital signal counting of multiple biomarkers in the same sample requires more than a few millions of fL-sized reactors, which is susceptible to poor sample/reagent handling and declined accuracy due to various error sources. In this study, we developed a highly multiplexed digital immunoassay platform, namely the PEdELISA microarray, to provide a promising solution for these challenges. The assay platform employs a unique combination of spatial-spectral encoding and machine learning-based image processing on a microfluidic chip. The positional registration of on-chip biosensing patterns, each with ~40,000 microwell reactors confining sample sub-volumes, fluorescence-encoded analyte-capturing beads, and assay reagents, enabled 12-plex cytokine detection for 15 μL of serum with high sample handling efficiency, small reagent loss, and negligible sensor cross talk. The signal processing and analysis of the 12-plexed PEdELISA microarray measurement employed a novel parallel computing CNN-based machine-learning algorithm. This algorithm achieved autonomous classification and segmentation of image features (e.g. microwells, beads, defects, backgrounds) at high throughput (1 min/analyte). Notably, it yielded 8–10 fold higher accuracy than the conventional GTS-based algorithm without any human-supervised error correction.
We ran the PEdELISA microarray measurement of human serum samples from patients who received CAR-T cancer therapy with an incubation time as short as 5 min. The assay simultaneously detected 12 cytokine biomarkers per sample with a clinically relevant dynamic range from sub-pg/mL to ng/mL, and the entire assay process from sample loading to data delivery was completed within 40 min. We tested blood samples obtained from a CAR-T patient at different time points during the course of the therapy with the short assay turnaround. The longitudinal measurement proved the ability of our assay platform to continuously monitor a large number of cytokine profiles rapidly evolving in the circulatory system of a subject suffering CRS. With its speed, sensitivity, multiplexing capacity, and sample-sparing capability, the PEdELISA microarray is poised for future translation to critical care medicine. This technology could be applied for guiding the treatment (Gupta et al., 2021; Yessayan et al., 2020) of life-threatening illnesses caused by COVID-19 global pandemic to be timely and tailored with the patient's comprehensive biomarker profiles.
Yujing Song: Conceptualization, Investigation, Methodology, Software, Writing – original draft. Jingyang Zhao: Software. Tao Cai: Investigation, Writing – review & editing. Andrew Stephens: Investigation. Shiuan-Haur Su: Investigation. Erin Sandford: Resources, Validation. Christopher Flora: Resources, Validation. Benjamin H. Singer: Validation. Monalisa Ghosh: Resources, Validation. Sung Won Choi: Funding acquisition. Muneesh Tewari: Funding acquisition. Katsuo Kurabayashi: Conceptualization, Methodology, Funding acquisition, Writing – review & editing, Supervision.
The authors declare the following financial interests/personal relationships which may be considered as potential competing interests:
A U.S. provisional patent was filed for the assay technology reported in the manuscript under Application No 63/016,753 on April 28, 2020.
Yujing Song: Conceptualization, Investigation, Methodology, Software, Writing- Original draft preparation. Jingyang Zhao: Software. Tao Cai: Investigation. Andrew Stephens: Investigation, Writing - Review & Editing. Shiuan-Haur Su: Investigation. Erin Sandford: Resources, Validation. Christopher Flora: Resources, Validation. Benjamin H. Singer: Validation. Monalisa Ghosh: Resources, Validation. Sung Won Choi: Funding Acquisition. Muneesh Tewari: Funding Acquisition. Katsuo Kurabayashi: Conceptualization, Methodology, Funding Acquisition, Writing - Review & Editing, Supervision.
This study was supported by the
 Machine learning-based cytokine microarray digital immunoassay analysis
 Facebook
 Twitter
 Linkedin
 Whatsapp
