
The cochlea encodes sound pressures varying over six orders of magnitude by collective operation of functionally diverse spiral ganglion neurons (SGNs). The mechanisms enabling this functional diversity remain elusive. Here, we asked whether the sound intensity information, contained in the receptor potential of the presynaptic inner hair cell (IHC), is fractionated via heterogeneous synapses. We studied the transfer function of individual IHC synapses by combining patch‐clamp recordings with dual‐color Rhod‐FF and iGluSnFR imaging of presynaptic Ca2+ signals and glutamate release. Synapses differed in the voltage dependence of release: Those residing at the IHC' pillar side activated at more hyperpolarized potentials and typically showed tight control of release by few Ca2+ channels. We conclude that heterogeneity of voltage dependence and release site coupling of Ca2+ channels among the synapses varies synaptic transfer within individual IHCs and, thereby, likely contributes to the functional diversity of SGNs. The mechanism reported here might serve sensory cells and neurons more generally to diversify signaling even in close‐by synapses.
Analysis of individual synapses reveal that the ability of auditory inner hair cells to translate a wide range of sound intensities is linked to presynaptic heterogeneity in Ca2+ channel‐mediated glutamate release.
Neural systems employ functional diversity to achieve the complexity of behavior. Diversity is implemented at several levels, i.e., circuits, neurons, and subcellular functional units such as synapses. Sensory systems employ such multiscale diversity as well as adaptation to deal with the challenge of encoding a wide range of stimulus intensities (Kandel et al, 2012). The auditory system copes with processing a wide range of sound intensities by employing two types of sensory cells: outer hair cells to actively amplify and compress the range of mechanical inputs (Ashmore, 2008) and IHCs to adaptively encode at synapses with primary auditory neurons (type I spiral ganglion neurons [SGNs]) (Moser et al, 2019). Based on their physiology, these neurons can be classified into three functional subtypes, namely low, medium, and high spontaneous rate (SR) SGNs differing in the threshold and dynamic range of sound encoding (Kiang et al, 1965; Sachs & Abbas, 1974; Liberman, 1978; Winter et al, 1990; Taberner & Liberman, 2005). This functional SGN diversity appears at all tonotopic places of the cochlea, and the subtypes can even innervate the same IHC (Liberman, 1982).
Functional diversity of SGNs relates to the heterogeneity of their molecular profile, morphology, afferent, and efferent synaptic connectivity. In the cat (Liberman, 1982), back‐tracing experiments linked morphology to function and showed that low‐SR SGNs have thinner radial fibers (peripheral neurites) with fewer mitochondria than the high‐SR ones. Low‐SR SGNs preferentially innervate the modiolar (or neural) side of the IHC, where they face larger and more complex presynaptic active zones (AZs) (Liberman, 1980, 1982; Merchan‐Perez & Liberman, 1996; Kantardzhieva et al, 2013). Larger and more complex AZs at the modiolar side of IHCs were also found in mouse (Liberman et al, 2011; Ohn et al, 2016; Michanski et al, 2019), guinea pig (Furman et al, 2013; Song et al, 2016), and gerbil (Zhang et al, 2018). In the mouse, RNA sequencing of individual SGNs indicated three distinct molecular profiles (Sun et al, 2018; Shrestha et al, 2018; Petitpré et al, 2018) that were suggested to correspond to low, medium, and high‐SR SGNs based on the spatial segregation of their IHC innervation.
In mouse IHCs, AZ size correlates with the number of Ca2+ channels (approximately 30 to 300) (Neef et al, 2018) and consequently with the maximal Ca2+ influx at the AZ (Frank et al, 2009; Ohn et al, 2016; Neef et al, 2018). Should the analogy to the innervation pattern in the cat cochlea apply, it is odd that Ca2+‐triggered glutamate release from modiolar AZs, with large size and Ca2+ influx, was to drive low‐SR SGNs. A possible solution to this conundrum came from the finding that Ca2+ influx at the modiolar AZs requires stronger depolarization than at the pillar ones (Ohn et al, 2016). In other words, Ca2+ channels at modiolar AZs would be mostly closed at the IHC resting potential and require stronger receptor potentials to activate, which could explain the low SR and high thresholds of their postsynaptic SGNs.
Whether and how such heterogeneous properties of presynaptic Ca2+ signaling relate to glutamate release and to SGN firing remains to be elucidated. Exocytosis of readily releasable synaptic vesicles (SVs) in mature mouse IHCs relates near‐linearly to Ca2+ influx when varying the number of open Ca2+ channels (Brandt et al, 2005; Wong et al, 2014; Pangrsic et al, 2015). Similar findings were found in mouse vestibular hair cells (Dulon et al, 2009). Hence, one would assume that the heterogeneous Ca2+ signaling propagates into a concomitant diversity of transmitter release. However, this remains to be studied at the single‐synapse level ideally for several AZs of a given IHC. In fact, a recent study of cerebellar synapses highlighted how differences in Ca2+ channel–release coupling diversify synaptic transfer (Rebola et al, 2019).
Here, we studied the synaptic transfer function and underlying Ca2+ dependence of release at individual IHC‐SGN synapses by combining IHC patch‐clamp with imaging of synaptic Ca2+ influx and glutamate release. To detect glutamate release, we utilized the fluorescent glutamate reporter iGluSnFR (Marvin et al, 2013) that we targeted to the postsynaptic SGNs. Our results suggest that IHCs vary the voltage dependence of Ca2+ channels as well as their control of release sites among their AZs. This likely enables IHCs to signal the information contained in the receptor potential into complementary neural channels for encoding the entire audible range of sound intensities.
Fluorescence imaging allows analysis of individual IHC AZs (Griesinger et al, 2005; Frank et al, 2009; Ohn et al, 2016) due to their large nearest neighbor distance (~ 2 µm) (Meyer et al, 2009). To image glutamate release, we targeted iGluSnFR (Marvin et al, 2013) to the postsynaptic SGN membrane. We injected the round window of WT mice at postnatal days (P)5–7 with adeno‐associated virus (AAV9, human synapsin promoter) to drive largely uniform SGN expression of iGluSnFR with several transduced afferent boutons per IHC (Fig 1A, Appendix Fig S1).

Optical detection of glutamate release at individual IHC synapses: low and variable voltage threshold
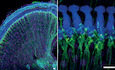
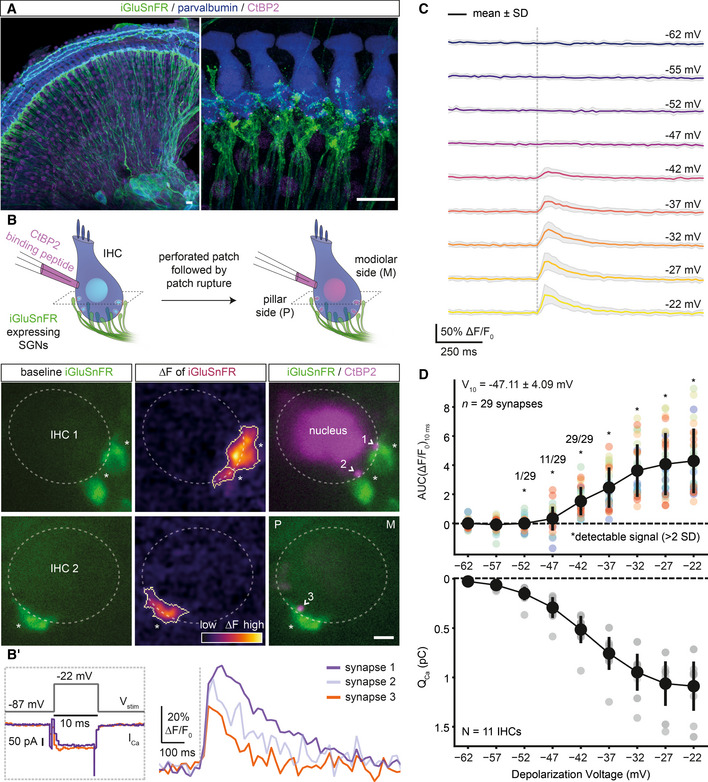
AMaximum intensity projections of the organ of Corti from the right ear of a P17 mouse injected at P6 with 1–2 µl of AAV9.hSyn.iGluSnFR suspension, immunolabeled for iGluSnFR (GFP), IHCs, OHCs, and SGNs (parvalbumin) and synaptic ribbons and nucleus (CtBP2/RIBEYE). Close‐up (right panel) highlights IHCs innervated by several iGluSnFR‐expressing SGN boutons. Step sizes are 0.6 (left) and 0.5 µm (right), respectively. (Scale bars: 10 µm).
BSimultaneous perforated patch‐clamp and imaging of IHCs (1.3 mM [Ca2+]e). IHCs were patch‐clamped from the pillar side, with a patch pipette containing TAMRA‐conjugated CtBP2‐binding peptide. Toward the end of the recording, the membrane patch was ruptured to fill the IHC with the peptide, which stains synaptic ribbons and nucleus. (Left) Two exemplary confocal sections of IHCs showing baseline fluorescence of iGluSnFR‐expressing afferent boutons from both modiolar (IHC1) and pillar (IHC2) side of the cell. Glutamate release from IHCs was evoked upon step depolarizations and detected as fluorescence change (ΔF) of iGluSnFR signal located on the SGN membrane (See (B′)). (Right) Overlaid images of the IHC1 and IHC2, displaying the boutons (iGluSnFR) and the synaptic ribbons (CtBP2), after the recording. (*: transduced afferent boutons, >: synaptic ribbons; Scale bar: 2 µm; see Appendix Fig S2 for the iGluSnFR‐ROI detection routine).
B′The stimulus protocol of the example IHCs from (B), displaying the voltage stimulation (Vstim), whole‐cell Ca2+ influx (ICa) and single‐synapse iGluSnFR responses. IHCs were stimulated by 10‐ms‐long step depolarizations to −22 mV from the holding potential of −87 mV (1.3 mM [Ca2+]e), and iGluSnFR fluorescence was recorded at 50 Hz.
CAverage ΔF/F0 iGluSnFR traces in response to 10‐ms‐long step depolarizations from the holding potential (−87 mV) to a voltage within the physiologically relevant range of receptor potentials: from −62 to −22 mV (applied in pseudo‐randomized order, step‐size 5 mV, perforated patch‐clamp, 1.3 mM [Ca2+]e, n = 29 boutons, N = 11 IHCs from nine mice). Shaded areas show ± SD.
DThe voltage threshold of glutamate release was low and variable (−47.11 ± 4.09 mV, mean ± SD). The area under the curve of the iGluSnFR signal (top; AUC(ΔF/F0)10ms) from (C) and corresponding whole‐cell QCa (bottom; mean ± SD). Detectable signals were defined here if the peak iGluSnFR signal was two times higher than baseline SD (depicted with *). All synapses had detectable signals in response to depolarizations ≥ −42 mV. (See also Figs EV1 and EV2).
Using apicocochlear organs of Corti, acutely dissected after the onset of hearing (P15–19), we patch‐clamped IHCs and simultaneously imaged postsynaptic iGluSnFR fluorescence by spinning disk confocal microscopy (Ohn et al, 2016). Figure 1B shows two exemplary IHCs innervated by iGluSnFR‐expressing afferent boutons at their modiolar (IHC1) or pillar (IHC2) side in the given confocal sections. Sizable changes in iGluSnFR fluorescence (ΔF‐iGluSnFR) were evoked by brief (10‐ms‐long) step depolarizations to −22 mV (Fig 1B, see Appendix Fig S2 for the iGluSnFR‐region of interest [ROI] detection routine). Toward the end of the perforated patch recording, we ruptured the membrane patch and introduced a TAMRA‐conjugated dimeric ribbon‐binding peptide to identify individual AZs (Fig 1B). When imaging, we purposely avoided the basal cap of the IHCs in which separating individual postsynaptic boutons is more challenging given the high synapse density (Meyer et al, 2009; Liberman et al, 2011).
Next, we probed the effect of the imaging plane on the iGluSnFR signal. We applied 50‐ms‐long step depolarizations in seven different planes each separated from the next one by 0.5 µm (ruptured patch‐clamp, 10 mM intracellular EGTA, 5 mM [Ca2+]e, n = 10 boutons, N = 6 IHCs from four mice; Appendix Fig S3). We compared ΔF‐iGluSnFR in the optimal plane (the one with highest signal) to the ones in planes ± 0.5 µm and ± 1 µm from the optimal plane. We found that the ΔF‐iGluSnFR was rather robust toward missing the optimal plane: There was a 24.79 ± 4.33% reduction in the peak of the iGluSnFR signal for the “± 0.5 µm planes” and a 26.83 ± 4.05% reduction for the “± 1 µm planes”. Furthermore, we checked the variability of the ΔF‐iGluSnFR at a given synapse. We probed the peak of the iGluSnFR signal by repetitive 20‐ms‐long step depolarizations from the holding potential of −87 to −17 mV applied every 20 seconds over 5 min (Appendix Fig S4, ruptured patch‐clamp, 10 mM intracellular EGTA, 5 mM [Ca2+]e, n = 5 boutons, N = 2 IHCs from two mice). We observed a mild rundown of the ΔF‐iGluSnFR over repetitive stimulation: The mean peak ΔF amplitude of the last three points was 36.75 ± 7.03% smaller than the mean of the first three points (14 step depolarizations over 5 min).
To probe the specificity of ΔF‐iGluSnFR for reporting Ca2+‐mediated glutamate release, we tested the effect of the Ca2+ channel blocker Zn2+. ΔF‐iGluSnFR triggered by step depolarizations gradually decreased and partially recovered upon Zn2+ application and wash‐out, respectively (Fig EV1A and B). To assess potential adverse effects of iGluSnFR expression on auditory signaling, we recorded auditory brainstem responses (ABR) at P29 (~ 23 days after the AAV injection). ABR waveforms and thresholds of the injected and non‐injected (control) ears were comparable (Fig EV1C) despite the efficient transduction and iGluSnFR expression of SGNs. In conclusion, AAV‐mediated expression of iGluSnFR in SGNs is suitable for studying IHC glutamate release with high specificity and does not obviously alter auditory physiology.
Characterization and validation of iGluSnFR for reporting IHC exocytosis. Related to Fig 1
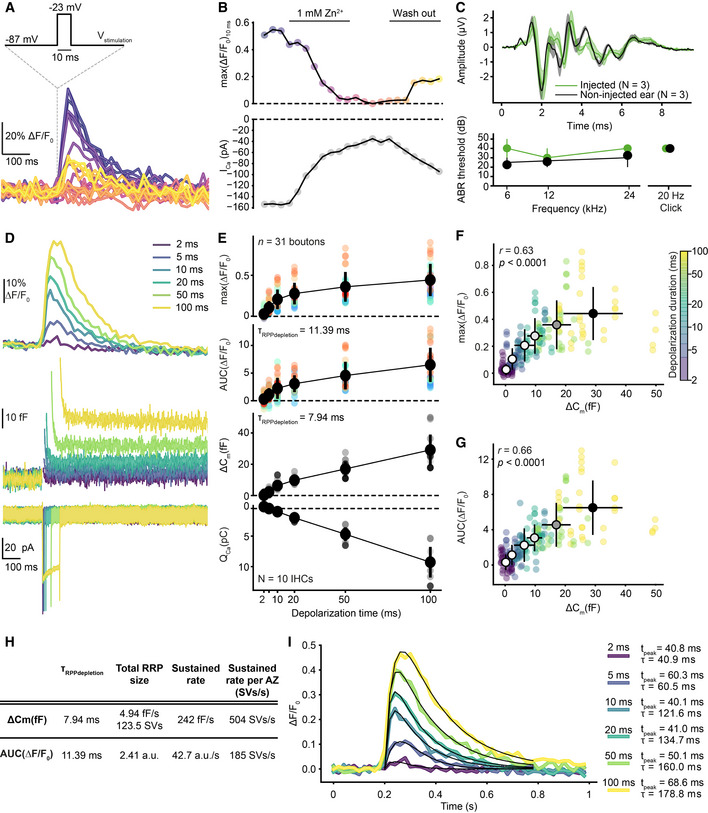
AExemplary single‐synapse iGluSnFR signal in response to repetitive 10‐ms‐long step depolarizations to −23 mV from the holding potential (−87 mV) as Ca2+ channel blocker Zn2+ (1 mM) is perfused in and out of the recording chamber. The temporal sequence of the recordings is encoded by color; darker colors indicate earlier time points as in panel (B) (top).
BThe time course of the peak iGluSnFR response (top; max(ΔF/F0)10ms) from (A) and corresponding whole‐cell peak Ca2+ current (bottom; perforated patch, 1.3 mM [Ca2+]e). The whole‐cell Ca2+ influx decreases with the perfusion of Zn2+.
C(top) ABR waveforms of P29 WT mice, injected with AAV9.hSyn.iGluSnFR virus at P6, were recorded in response to 80 dB clicks (mean ± SEM, three animals). The non‐injected ear was used as a control. (bottom) ABR thresholds of the injected ear and the non‐injected control were comparable. A statistical test was not applied due to the small sample size. The presence of iGluSnFR expression was confirmed by immunostainings after ABR recordings.
D–GiGluSnFR signal as a readout of glutamate release increases with stimulus duration along with the IHC's capacitance change (ΔCm). (D) Average responses of iGluSnFR (top), whole‐cell Cm (middle), and Ca2+ currents (bottom) upon step depolarizations to −23 mV from the holding potential of −87 mV for durations from 2 to 100 ms (color coded). Recordings were done in organs of Corti of P15–19 WT mice injected with AAV9.hSyn.iGluSnFR virus (perforated patch‐clamp, 1.3 mM [Ca2+]e, n = 31 boutons, N = 10 IHCs from eight mice). (E) The peak and the AUC of iGluSnFR signal, corresponding whole‐cell ΔCm, and QCa plotted as a function of depolarization duration (mean ± SD). (F, G) The relation of whole‐cell ΔCm and the peak (F) or the AUC (G) of the iGluSnFR signal (mean ± SD, n = 31 boutons, N = 10 IHCs from 8 mice). Both the peak and the AUC of iGluSnFR response correlate with the whole‐cell ΔCm (Pearson's r = 0.63, P < 0.0001 and r = 0.66, P < 0.0001, Student's t‐test, respectively). Depolarization duration is color coded, and the black outlined circles, indicating the means, darken with increasing depolarization duration.
HQuantification of exocytosis by whole‐cell ΔCm and single‐synapse iGluSnFR‐AUC. (See Materials and Methods).
IThe kinetics of iGluSnFR signal. Average iGluSnFR responses (as shown in panel (D) top). Black lines indicate the results of fitting to the average traces per depolarization duration (see Materials and Methods). Time to peak and the decay time constants are obtained from these fits and depicted with the color codes of the depolarization durations.
To compare IHC exocytosis on a single‐synapse versus whole‐cell level, we measured synaptic ΔF‐iGluSnFR simultaneously with well‐established whole‐cell membrane capacitance changes (ΔCm) (Moser & Beutner, 2000). To assess the sensitivity and saturation of ΔF‐iGluSnFR, we applied stimuli of different durations (2–100 ms, in pseudo‐randomized order) in near‐physiological conditions (perforated patch configuration, 1.3 mM extracellular Ca2+ concentration ([Ca2+]e); Fig EV1D). ΔF‐iGluSnFR became significant at 2 ms (P < 0.0001), while ΔCm were detectable only at 5 ms (P = 0.004; Appendix Fig S5). To evaluate a potential saturation of iGluSnFR by glutamate release, we related both the peak and the area under the curve of the iGluSnFR signal (hereafter referred to as iGluSnFR‐AUC) to the corresponding ΔCm. Both measures showed a positive correlation with ΔCm (Pearson's r = 0.63, P < 0.0001 and r = 0.66, P < 0.0001; Fig EV1F and G), indicating their robust report of exocytosis for depolarizations up to at least 100 ms. Furthermore, the decay time constant of iGluSnFR signal increased with depolarization duration (Fig EV1I). Different from postsynaptic ΔF‐iGluSnFR, ΔCm also reports extrasynaptic exocytosis (Pangrsic et al, 2015), likely contributing to the sublinear relationship of both measures for longer stimuli.
As a complementary approach to validate ΔF‐iGluSnFR as a readout of exocytosis, we probed it by applying brief (10‐ms) step depolarizations from the holding potential (−87 mV) to −57 mV in 10 mV increments up to 23 mV (applied in pseudo‐randomized order; Appendix Fig S6) and simultaneously recorded ΔCm. Both the peak and the AUC of iGluSnFR signal positively correlated with the ΔCm in the negative voltage range (from −57 to −17 mV; Pearson's r = 0.57, P < 0.0001, Pearson's r = 0.59, P < 0.0001, respectively) and in the whole recorded voltage range (from −57 to 23 mV; Pearson's r = 0.58, P < 0.0001, Pearson's r = 0.61, P < 0.0001, respectively). These findings corroborated our observation in Fig EV1F and G that iGluSnFR saturation is not a major concern under these conditions.
Next, we compared SV pool dynamics by synaptic iGluSnFR‐AUC versus whole‐cell ΔCm. To estimate the dynamics of RRP and sustained exocytosis, we fitted the sum of an exponential and a linear function. The resulting time constants of RRP depletion were 11.39 ms for iGluSnFR‐AUC and 7.94 ms for ∆Cm (Fig EV1E and H, and see Materials and Methods). By estimating an average AZ RRP of ~ 10 SVs from ∆Cm measurements, we obtained an average change in iGluSnFR‐AUC (0.23 arbitrary units) per SV. The sustained component of exocytosis amounted to 42.7 a.u./s (~ 185 SV/s per AZ) for the recorded synapses compared to 242 fF/s (504 SV/s per AZ; Fig EV1H). The faster rate derived from whole‐cell ΔCm measurements likely reflects the contribution of extrasynaptic exocytosis (Pangrsic et al, 2015). Hence, ΔF‐iGluSnFR can detect smaller amounts of exocytosis than whole‐cell ΔCm and, on average, reports similar SV pool dynamics for single AZs.
Finally, we studied how the RRP is recruited by brief graded depolarizations in the range of physiological receptor potentials (Russell & Sellick, 1983). Using near‐physiological conditions (perforated patch configuration, 1.3 mM [Ca2+]e), we applied 10‐ms‐long step depolarizations from the holding potential (−87 mV) to −62 mV in 5 mV increments up to −22 mV (applied in pseudo‐randomized order; Figs 1C and D, and EV2A and B). We analyzed the voltage dependence of glutamate release by fitting Boltzmann functions to iGluSnFR‐AUC (See Materials and Methods; Fig EV2C and D). The voltage threshold (V10, defined as potential eliciting 10% of the maximum response) for glutamate release on average was −47.11 mV with considerable variance (SD: 4.09 mV; Fig EV2C and D). This is close to the threshold of activation of CaV1.3 Ca2+ channels (~ −60 mV) (Zampini et al, 2010) and the in vivo resting membrane potential of IHCs (~ −55 mV) (Johnson et al, 2011). The variable voltage thresholds for glutamate release among the individual IHC synapses hint to differences in their transfer functions.
Low voltage threshold for IHC glutamate release. Related to Fig 1
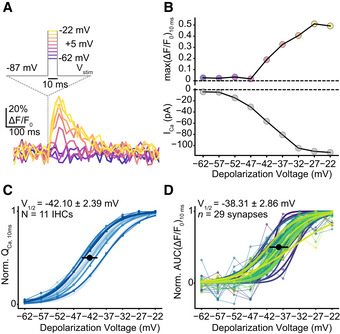
Exemplary single‐synapse iGluSnFR signal in response to 10‐ms‐long step depolarizations from the holding potential of −87 mV to a voltage within the physiologically relevant range of receptor potentials: from −22 to −62 mV in 5 mV increments, same protocol as in Fig 1C and D.
The peak iGluSnFR fluorescence (top; max(ΔF/F0)10ms) from (A) and corresponding whole‐cell Ca2+ current (bottom; perforated patch‐clamp, 1.3 mM [Ca2+]e). Glutamate release can be detected at −42 mV. The voltage range is color coded: Lighter points indicate more positive potentials.
Normalized whole‐cell QCa, calculated in response to 10‐ms‐long step depolarizations, is plotted as a function of depolarization voltage (perforated patch‐clamp, 1.3 mM [Ca2+]e). Individual IHCs are color coded in shades of blue (mean ± SD, N = 11 IHCs from nine mice). A Boltzmann function was fitted to estimate the V10 and V1/2.
Normalized iGluSnFR‐AUC, in response to 10‐ms‐long step depolarizations, same experiments as in (A) (mean ± SD, n = 29 synapses; individual synapses are color coded). A Boltzmann function was fitted to estimate the V10 and V1/2.
How the opening of CaV1.3 Ca2+ channels translates into glutamate release critically shapes synaptic transfer and is determined by the topography of Ca2+ channels and SV release sites. Previous studies evaluating the summed activity of several AZs indicate that a few channels in nanoscale proximity govern the [Ca2+] driving fusion of individual SVs at mature hair cell synapses (Ca2+ nanodomain‐like control of exocytosis) (Brandt et al, 2005; Graydon et al, 2011; Wong et al, 2014; Pangrsic et al, 2015). In the Ca2+ nanodomain‐like control of release, a near‐linear relation between release and Ca2+ influx is expected (apparent Ca2+ cooperativity of release (m) close to 1) when varying the number of open Ca2+ channels. Here, we found a near‐linear dependence (operationally defined as m < 2) of glutamate release at single AZs on the whole‐cell Ca2+ influx when depolarizing IHCs within the range of physiological receptor potentials (Fig EV3A–C, mQCa = 1.55, n = 29 synapses, N = 11 IHCs). Varying the voltage in this hyperpolarized range changes the open‐channel number, and for Ca2+ nanodomain control, this is more relevant than the change in single‐channel current as once the channel opens the ensuing Ca2+ signal tends to saturate the Ca2+ sensor of release (Pangrsic et al, 2015). In contrast, and consistent with the supralinear intrinsic Ca2+ dependence of exocytosis in IHCs (Beutner et al, 2001; Wong et al, 2014), reducing the effective single‐channel current by the rapid flicker‐block of Ca2+ channels by Zn2+ showed m > 2 (Fig EV3D–F, mQCa = 2.56, n = 24 synapses, N = 10 IHCs). Taken together, imaging of glutamate release as a function of whole‐cell Ca2+ influx corroborates the notion of a Ca2+ nanodomain‐like control of release in mature IHCs (Brandt et al, 2005; Goutman & Glowatzki, 2007; Wong et al, 2014; Pangrsic et al, 2015). However, the presynaptic heterogeneity of Ca2+ signaling in IHCs (Frank et al, 2009; Ohn et al, 2016) underscores the need of studying Ca2+ influx–release coupling at individual AZs.
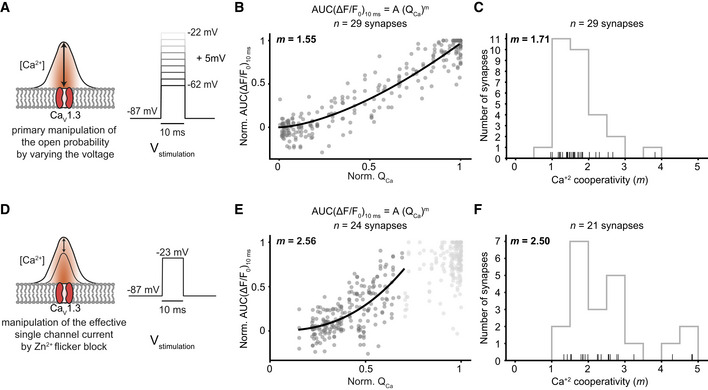
Relating release to whole‐cell Ca2+ influx during manipulation of open‐channel number or single‐channel current supports Ca2+ nanodomain‐like control of release. Related to Figs 1 and 3
Varying the voltage in the hyperpolarized range primarily varies the open‐channel number. RRP release was probed by 10‐ms‐long step depolarizations from the holding potential (−87 mV) to −62 to −22 mV in 5 mV steps applied in pseudo‐randomized order.
The normalized AUC(ΔF/F0)10ms is plotted versus QCa (n = 29 boutons, N = 11 IHCs from nine mice): A power function was fitted before an obvious saturation of the RRP release, and a near‐linear relation was observed (m = 1.55).
Histogram showing the distribution of m from individual fits per synapse before an obvious saturation of the RRP release (mavg = 1.71 ± 0.58). Only those fits with an R 2 value higher than 0.7 were used for further analysis (n = 29 boutons). The rug plot under the histogram displays individual data points. Every depolarization step was repeated at least two times per synapse, and the average was taken.
Manipulation of the single Ca2+ channel current by Zn2+ perfusion. Note that Zn2+ acts as a rapid (microsecond) flicker blocker of Ca2+ channels (Winegar & Lansman, 1990), which, within the limits of IHC exocytosis kinetics (delay ~ 1 ms) (Beutner et al, 2001), is expected to reduce the fusogenic Ca2+ signal at the SV release site (Brandt et al, 2005). Therefore, this manipulation is expected to reveal the supralinear intrinsic Ca2+ dependence of release. We evoked RRP exocytosis by repetitive 10‐ms‐long step depolarizations to −22 mV, while slowly perfusing 1 mM Zn2+ into the recording chamber.
Normalized AUC(ΔF/F0)10 ms is plotted versus QCa upon Zn2+ manipulation (n = 24 boutons, N = 10 IHCs from 10 mice). A power function was fitted before an obvious saturation of RRP release (normalized QCa < 0.7), and a supralinear relation was observed (m = 2.56).
Histogram showing the distribution of m from individual fits synapse before an obvious saturation was observed for a given synapse (m average = 2.50 ± 1.03, n = 21 boutons with an R 2 of fit > 0.7). The rug plot under the histogram displays the individual data points.
Studying the Ca2+ dependence of exocytosis at individual AZs has remained difficult. Previous studies related whole‐cell Ca2+ influx to either whole‐cell exocytosis (Brandt et al, 2005; Wong et al, 2014; Pangrsic et al, 2015) or to postsynaptic recordings of SV release (Goutman & Glowatzki, 2007). However, IHC synapses fundamentally vary in voltage dependence, number, and clustering of their Ca2+ channels (Frank et al, 2009; Meyer et al, 2009; Ohn et al, 2016; Neef et al, 2018). Here, we studied the operation of individual IHC synapses in the physiologically relevant voltage range during the 4th postnatal week (P21–26). We combined ruptured patch‐clamp of IHCs with sequential dual‐color imaging of first synaptic Ca2+ signals and then glutamate release (Fig 2A). To image synaptic Ca2+ signals, we used the red‐shifted, low‐affinity (Kd:19 μM) chemical Ca2+‐indicator Rhod‐FF. We isolated Ca2+ signals at individual AZs using strong cytosolic buffering (10 mM EGTA in the patch pipette) and increased [Ca2+]e (5 mM) (Frank et al, 2009; Ohn et al, 2016; Neef et al, 2018). We recorded glutamate release using ∆F‐iGluSnFR in SGN boutons contacting the mid‐section of IHC.
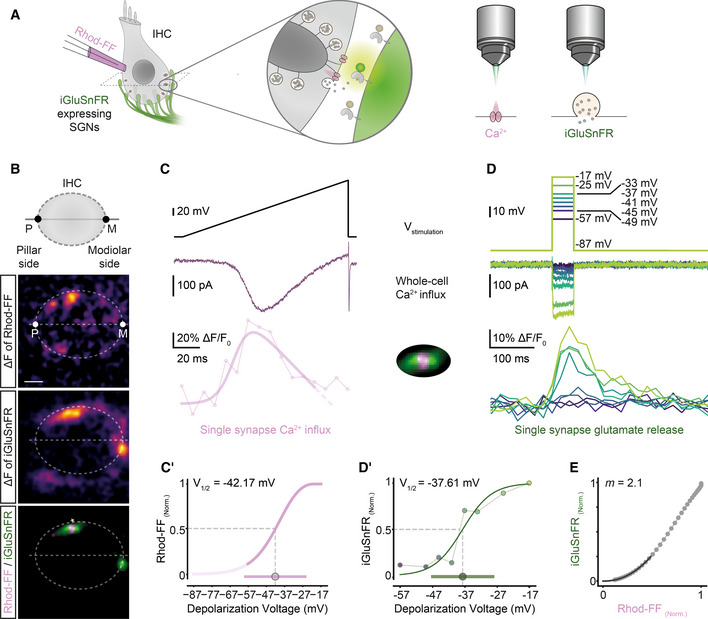
Sequential dual‐color imaging of synaptic Ca2+ influx and glutamate release
AIHCs were patch‐clamped in ruptured‐patch configuration with 800 μM Rhod‐FF in the patch pipette, and simultaneously imaged for Ca2+ signals or glutamate release by spinning disk microscopy.
BMean ΔF images of Rhod‐FF and iGluSnFR signals in response to a voltage ramp and a 50‐ms‐long step depolarization, respectively. The synapse marked with * on the overlaid image is further analyzed in the following panels. (P: pillar side, M: modiolar side; Scale bar: 2 μm)
C, DVoltage command (top), corresponding whole‐cell Ca2+ influx (middle) and the functional fluorescence responses (bottom; band‐stop filtered at 33.3 Hz) from Rhod‐FF and iGluSnFR, respectively. A modified Boltzmann function (see Materials and Methods, R 2 = 0.81) was fitted to a Rhod‐FF fluorescence trace in response to a voltage ramp (C, C′). iGluSnFR‐AUC was calculated per depolarization voltage and used for a Boltzmann fit (D′, R 2 = 0.92). The voltage of half‐maximal activation (V1/2) and the dynamic range (10–90%) of synaptic Ca2+‐influx and glutamate release were calculated from the fits and depicted as circle and bar in (C′ and D′), respectively.
EThe obtained fits from the Ca2+ “hot spot” (C′) and from glutamate release (D′) were plotted against each other in a voltage range from −57 to −17 mV in 1 mV increments. A power function was fitted up to the 25% of the maximum iGluSnFR‐AUC (R 2 = 0.99) to obtain the m estimate. (ruptured patch‐clamp, 10 mM intracellular EGTA, 5 mM [Ca2+]e; See also Fig EV4).
Next, we studied the voltage dependence of synaptic Ca2+ influx and glutamate release. To probe the voltage dependence of synaptic Ca2+ influx, we imaged Rhod‐FF fluorescence (Fig 2B and C) while applying a voltage ramp (−87 to +63 mV), a fast protocol inducing a minimum cellular Ca2+ load (Ohn et al, 2016). This allowed us to analyze the Ca2+ influx of the AZ corresponding to a given SGN bouton, by repeating the voltage ramps in five different planes (separated by 0.5 μm). The hot spots of Rhod‐FF fluorescence elicited by depolarizations localized to the plasma membrane (Fig 2B) and to the synaptic ribbon (Fig EV4), indicating a cytosolic rise of [Ca2+] near the Ca2+ channel cluster of the AZ. Then, to probe the voltage dependence of glutamate release, we imaged iGluSnFR (in the central plane of Ca2+ imaging), while applying 50‐ms‐long step depolarizations (ranging from −57 to −17 mV) in a pseudo‐randomized fashion (Fig 2B and D). We used 50‐ms‐long depolarizations to elicit sufficient IHC release in the presence of 10 mM EGTA, which is expected to constrain the Ca2+ signal to the nanometer proximity of the Ca2+ channels and to slow Ca2+‐dependent SV replenishment (Moser & Beutner, 2000). Furthermore, the iGluSnFR‐AUC seemed robust toward saturation up to at least 100 ms of stimulation (see Fig EV1D–G and Appendix Fig S6). We analyzed the voltage dependences of synaptic Ca2+ influx and glutamate release by fitting Boltzmann functions to ∆F/F0 of Rhod‐FF (modified Boltzmann function, see Materials and Methods) and iGluSnFR‐AUC. In the example shown in Fig 2, the voltages of half‐maximal activation (V1/2) of Ca2+‐influx (Fig 2C′) and glutamate release (Fig 2D′) were −42.2 and −37.6 mV, respectively. The resulting fit functions were then used to relate the glutamate release and the synaptic Ca2+ influx over the physiologically relevant voltage range. To estimate the apparent Ca2+ dependence of release for individual synapses, we fitted a power function on this relation (Fig 2E). We restricted the fit until the 25% of maximum iGluSnFR‐AUC for all synapses, in order to avoid saturation, e.g., due to RRP depletion and obtained an m estimate (m = 2.1 for the exemplary synapse). In conclusion, the sequential dual‐color imaging approach allowed us to study Ca2+ dependence of release at individual AZs.
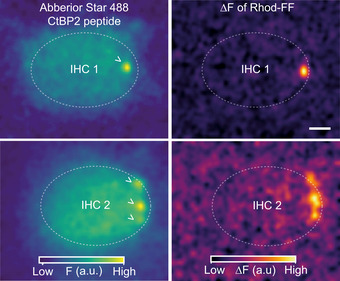
Depolarization‐evoked Ca2+ "hot spots" of Rhod‐FF fluorescence occur at the AZ. Related to Fig 2
(Left) Confocal sections of two example IHCs showing the fluorescence of the Abberior Star 488‐conjugated CtBP2‐binding peptide, which stains the synaptic ribbons. (Right) ∆F images of Rhod‐FF in response to a 100‐ms‐long step depolarization to −17 mV from the holding potential of −87 mV. The color maps of the F and ∆F images are in arbitrary units (a.u.) and displayed on the bottom. ( >: synaptic ribbons, scale bar: 2 µm).
When systematically analyzing IHCs for the voltage dependence of whole‐cell Ca2+ influx (QCa), synaptic Ca2+ influx (∆F/F0 of Rhod‐FF), and glutamate release (iGluSnFR‐AUC), we observed fundamental heterogeneity of AZs within and across IHCs. The threshold for glutamate release was −48.27 ± 6.47 mV (SD, n = 55 synapses, N = 34 IHCs from 28 mice) and showed a broader distribution than that of the whole‐cell Ca2+ influx (V10 = −47.16 ± 3.19 mV, SD, P < 0.0001, Levene's test). As previously reported (Ohn et al, 2016), synaptic Ca2+ influx (V1/2 = −41.15 ± 5.70 mV, SD; n = 55 synapses, N = 34 IHCs from 28 mice, Fig 3B, see Appendix Fig S7 for individual fits) showed a broader and more negative V1/2 distribution than that of the whole‐cell Ca2+ influx (V1/2 = −35.44 ± 2.83 mV, SD, Fig 3A). The V1/2 distribution of synaptic glutamate release ranged from −45.25 to −29.86 mV and also showed a more negative average V1/2 (−37.49 ± 3.71 mV, SD, n = 55 synapses, P = 0.008, Fig 3C, see Appendix Fig S8 for individual fits) than the whole‐cell Ca2+ influx. The V1/2 distributions differed significantly between glutamate release and synaptic Ca2+ influx (Fig EV5 and P = 0.009, Levene's test) as well as between synaptic and whole‐cell Ca2+ influx (P = 0.001, Levene's test). The V1/2 values of synaptic Ca2+ influx and glutamate release correlated (Pearson's r = 0.43, P = 0.0008, Fig 3G). This correlation indicates that the differences in the voltage dependence of Ca2+ influx are propagated to release, generating heterogeneous output among the IHC AZs at a given receptor potential.
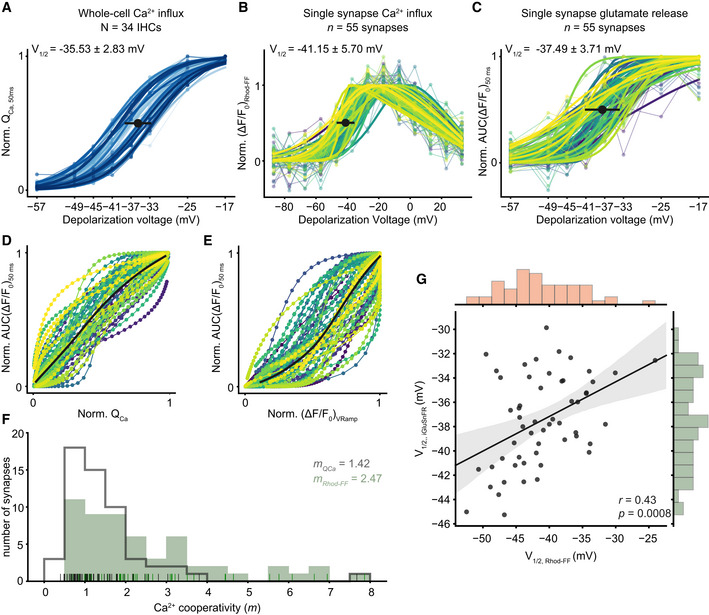
IHC synapses vary in voltage dependence and apparent Ca2+ dependence of release
Normalized whole‐cell QCa, calculated in response to 50‐ms‐long step depolarizations, is plotted as a function of depolarization voltage. A Boltzmann function was fitted to estimate the V1/2. Individual IHCs are color coded in shades of blue (mean ± SD, N = 34 IHCs from 28 mice, ruptured patch‐clamp, 10 mM intracellular EGTA, 5 mM [Ca2+]e).
A voltage ramp was applied to obtain ΔF of Rhod‐FF as a proxy of synaptic Ca2+ influx. The V1/2 of synaptic Ca2+ influx was calculated from a modified Boltzmann function (see Materials and Methods) fitted to ΔF/F0. (mean ± SD, n = 55 synapses; individual synapses are color coded; see Appendix Fig S7 for individual fits).
Normalized iGluSnFR‐AUC, in response to 50‐ms‐long step depolarizations, same as (A) (see Appendix Fig S8 for individual fits).
The relation of whole‐cell Ca2+‐influx (A) and the synaptic glutamate release (C).
The relation of synaptic Ca2+ influx (B) and glutamate release (C). The bold lines show the means. (See also Appendix Fig S9 for individual plots)
The histogram shows the Ca2+ cooperativities (m) obtained by individual power function fitting until 25% of normalized iGluSnFR response from ((D); gray) and from ((E); green). The mean m was found to be 1.42 and 2.47, respectively. The rug plot shows the individual data points.
The V1/2 of synaptic Ca2+ influx and glutamate release is correlated (Pearson's r = 0.43, P = 0.0008, Student's t‐test). The marginal histograms show the distribution of each axis. Linear regression analysis (solid lines) and the associated 95% confidence intervals (shaded area). (See also Figs EV3, EV4, EV5).
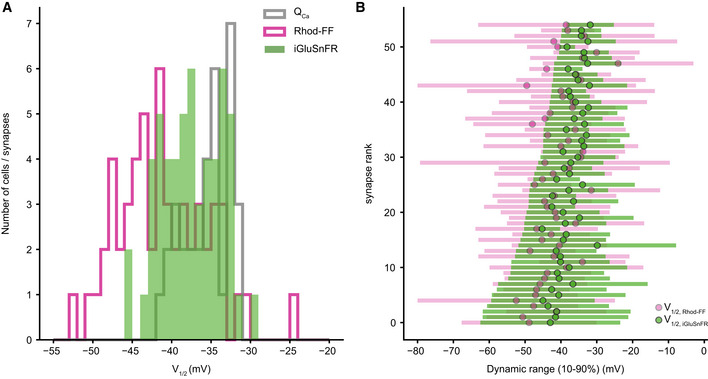
AZs vary in their voltage dependence. Related to Fig 3
V1/2 distribution of QCa (gray, N = 34 IHCs), synaptic Ca2+ influx (magenta), and glutamate release (green, n = 55 synapses from 34 IHCs).
Dynamic ranges (10–90%) of the synaptic Ca2+ influx (magenta) and glutamate release (green) with their V1/2 depicted. The synapses are ranked based on their glutamate release threshold (V10). Note how they gradually span the voltage range from −62.48 to −38.41 mV (mean ± SD = 48.27 ± 6.47 mV).
Next, we estimated the apparent Ca2+ dependence of release by relating the iGluSnFR‐AUC to the whole‐cell Ca2+ influx (Fig 3D) and to the synaptic Ca2+ influx (Fig 3E) for the above voltage protocol that primarily varied the open‐channel number (see also Figs 1C and D, and EV3). The apparent Ca2+ dependence of glutamate release at the single‐synapse level (Fig 3F) was higher on average (mRhod‐FF = 2.47, see Appendix Fig S9 for the data of individual IHCs) than when relating glutamate release to the whole‐cell Ca2+ influx (mQCa = 1.42). The observed discrepancy of the average m estimates from single‐synapse analysis and the m estimated based on the whole‐cell QCa might at least partially be explained by the exclusion of synapses at the densely innervated basal IHC cap. We suspect that there are a fair number of synapses with m < 2 in the basal cap. The m estimate based on the whole‐cell QCa was lower on average than the m estimate obtained in the perforated‐patch configuration on P15–19 IHCs at 1.3 mM [Ca2+]e using a similar stimulus protocol (see Figs 1C and D, and EV3A and C, P = 0.001, Mann–Whitney U‐test). This difference is compatible with the hypothesis that strong Ca2+ buffering by 10 mM EGTA favors the operation of release sites under Ca2+ nanodomain control. Since the data of Fig EV3 were acquired at an earlier developmental stage (P15–19), the developmental tightening of the Ca2+ channel–exocytosis coupling (Wong et al, 2014) might also have contributed to the lower m in Fig 3D (P21–26). We did not find a significant difference between the thresholds of release with physiological buffering (perforated patch‐clamp, 1.3 mM [Ca2+]e) and with high EGTA buffering (ruptured patch‐clamp, 10 mM intracellular EGTA, 5 mM [Ca2+]e, Mann–Whitney U‐test, P = 0.42), supporting the lack of obvious glutamate release quench in these high buffering conditions. Nevertheless, probing the synaptic Ca2+ dependence of release in more physiological buffering conditions remains important task for future studies. When operationally defining m < 2 (“near‐linear”) as indicative of Ca2+ nanodomain‐like control of release, we found approximately half of the synapses (29 out of 55 synapses) to operate in this scenario. The other half showed a broad spread of m values reaching up to 8, compatible with Ca2+ microdomain‐like control of release despite the presence of 10 mM EGTA. Taken together, single‐synapse imaging of Ca2+ influx and glutamate release revealed a heterogeneity of the apparent Ca2+ dependence of release that is likely due to differences in the coupling of Ca2+ channels to release sites among the IHC AZs. This heterogeneous coupling of Ca2+ channels to release sites likely contributes to the heterogeneous output of IHC AZs.
SGNs exhibit a spatial preference in their IHC innervation pattern in the cat: High SR–low threshold fibers innervate the pillar side of the IHC, and low SR–high threshold fibers contact the modiolar side of the IHC (Liberman, 1982). Assuming analogy for mouse IHCs, we probed how presynaptic heterogeneity might contribute to the diversity of SGNs by analyzing the synaptic Ca2+ influx and glutamate release as a function of position along the pillar–modiolar axis. Figure 4A compares the simultaneous iGluSnFR responses of two exemplary synapses of one IHC: One positioned at the pillar and the other one at the modiolar side. In this example, the pillar synapse had a lower threshold; i.e., it already became active at −49 mV, while the modiolar synapse only started to respond at −41 mV. The pillar synapse also showed a more negative V1/2 and a wider dynamic range compared to the modiolar synapses in the given cell (Fig 4A′). As this observation was made in the same section of an IHC and was representative for the population (Fig 4B–E), we consider potential technical reasons unlikely. On average, V1/2 of both Ca2+ influx and glutamate release, and threshold of glutamate release (Fig 4B–D) were more negative at pillar synapses. Moreover, pillar synapses showed a wider dynamic range of release (Fig 4E). Nonetheless, there was substantial variability in particular among the modiolar synapses. This is obvious from the example shown in Fig 4A′ as well as at the population level (Fig 4B–E). We also performed linear regression analysis on the relation of pillar–modiolar position and V1/2 of synaptic Ca2+ influx as well as glutamate release (Fig 4B–E). This analysis confirmed a pillar–modiolar gradient of V1/2 of synaptic Ca2+ influx (r = 0.48; P = 0.0001) that we previously reported for an earlier postnatal stage (P14–20) (Ohn et al, 2016). Furthermore, it showed a pillar–modiolar gradient of the voltage threshold (r = 0.47; p = 0.0002), V1/2 (r = 0.32; P = 0.013), and dynamic range (r = −0.38; P = 0.003) of release. Ca2+ cooperativity did not show a significant correlation with the position along the pillar–modiolar axis (r = 0.17; P = 0.21; Appendix Fig S10). However, Ca2+ cooperativities ≥ 3 were mainly found for AZs on the modiolar side.
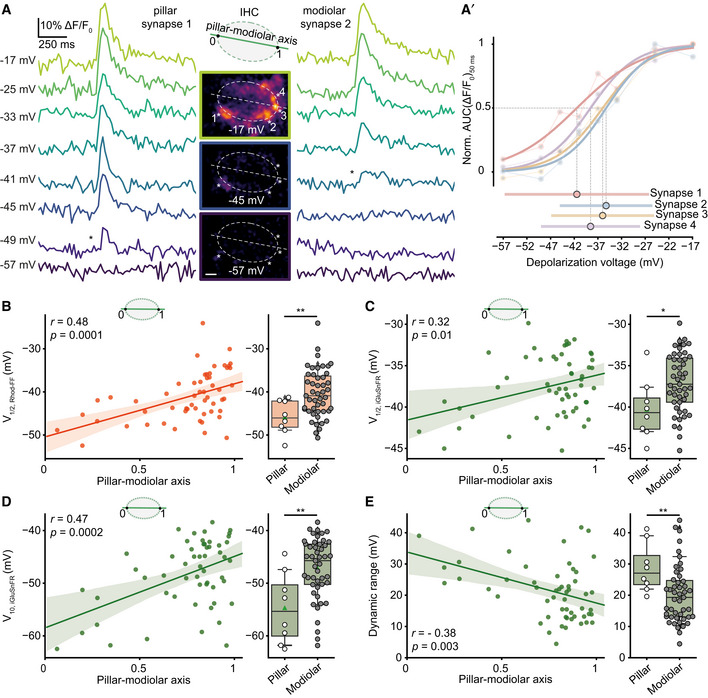
Pillar synapses are active at more negative potentials than modiolar synapses
AThe single cell example shows release dynamics of two synapses innervating the same IHC from either pillar or modiolar side. iGluSnFR signals (band‐stop filtered at 33.3 Hz) in response to 50‐ms‐long step depolarizations to the given depolarization voltages are depicted (ruptured patch‐clamp, 10 mM intracellular EGTA, 5 mM [Ca2+]e). The middle panel shows ΔF images of iGluSnFR, recorded from the mid‐section of the IHC. * depict the first detected response in the given synapse. Note that pillar synapse 1 is already active at −49 mV, while modiolar synapse 2 starts responding only at −41 mV. (Scale bar: 2 μm).
A′The normalized iGluSnFR‐AUC as a function of depolarization voltage. Dynamic range and V1/2 of the synapses are depicted in the lower panel.
B–ELeft panel shows the linear regression analysis (solid lines) of V1/2 of synaptic Ca2+ influx (B), V1/2 (C), threshold (D), and dynamic range (E) of glutamate release as a function of position along the pillar–modiolar axis. Shaded areas depict the associated 95% confidence intervals. Significance of correlation coefficients is reported by a two‐tailed P‐value. Right panel shows box and whisker plots of these properties of synapses grouped into pillar and modiolar halves of the IHCs. Box plots indicate first quartile (25th percentile), median and third quartile (75th percentile) with whiskers reaching from 10 to 90%. For comparison of pillar and modiolar synapses, either Student's t‐test (for normally distributed data) or Mann–Whitney U‐test (for non‐normally distributed data) was applied. *P ≤ 0.05, **P ≤ 0.01.
In conclusion, pillar and modiolar AZs differed in their voltage dependence and dynamic range of glutamate release. These differences between pillar and modiolar synapses support the hypothesis that diversity of the spontaneous and sound‐evoked SGN firing is, at least in part, rooted in the heterogeneous biophysical properties of presynaptic Ca2+ channels and transmitter release. Activation at more negative potentials of pillar synapses agrees with the high SR and low sound threshold of the corresponding SGNs. However, the wider dynamic range of glutamate release at pillar AZs is more difficult to reconcile with the narrower dynamic range of sound encoding of high SR–low threshold SGNs (Taberner & Liberman, 2005). While the exciting hypothesis of a modiolar–pillar segregation of synaptic properties has kept instructing important experiments, we should be aware of bias arising from this model. In fact, the present data seem to support a model that is between a strict ordering and a “salt‐and‐pepper” distribution of AZ properties in IHCs.
By the sequential dual‐color imaging of synaptic Ca2+ influx and release, we quantified each synapse with 15 parameters. Correlations among several of these parameters can be intuitively explained, such as the voltage dependence of a synapse, which is primarily rooted in that of Ca2+ channel activation (Fig EV6). Moreover, a supralinear coupling of release to Ca2+ influx is expected to compress the dynamic range of release. While the comparative analysis of pillar and modiolar synapses (see Fig 4) aims to elucidate synaptic correlates of the functional SGN properties, it has both value and limits. For an unbiased and in‐depth analysis, we applied K‐means clustering (K = 3) on the 11th‐dimensional space of single‐synapse properties (excluding positional and whole‐cell information) and obtained three synapse clusters (putative subtypes; see Appendix Fig S11 for clustering results with K = 2 and K = 4). To visualize the clusters in two or three dimensions, we performed principal component analysis (PCA) and used the first three principal components that explained 79% of the variance (Fig 5A–D). The main factors contributing to the first three PCs were the dynamic range of glutamate release, thresholds of glutamate release, and synaptic Ca2+ influx (Appendix Fig S12).
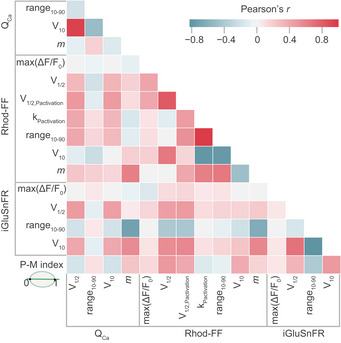
Correlation map of synaptic properties. Related to Fig 3
This correlation matrix shows the Pearson correlation coefficients (Pearson's r) between various properties assigned to individual synapses. The degree of correlation is color coded: light (weak) to dark (strong). Positive correlations are depicted in red and negative ones in blue.
Three putative synapse subtypes, co‐existing in individual IHCs, differ in their synaptic transfer functions and Ca2+ dependencies
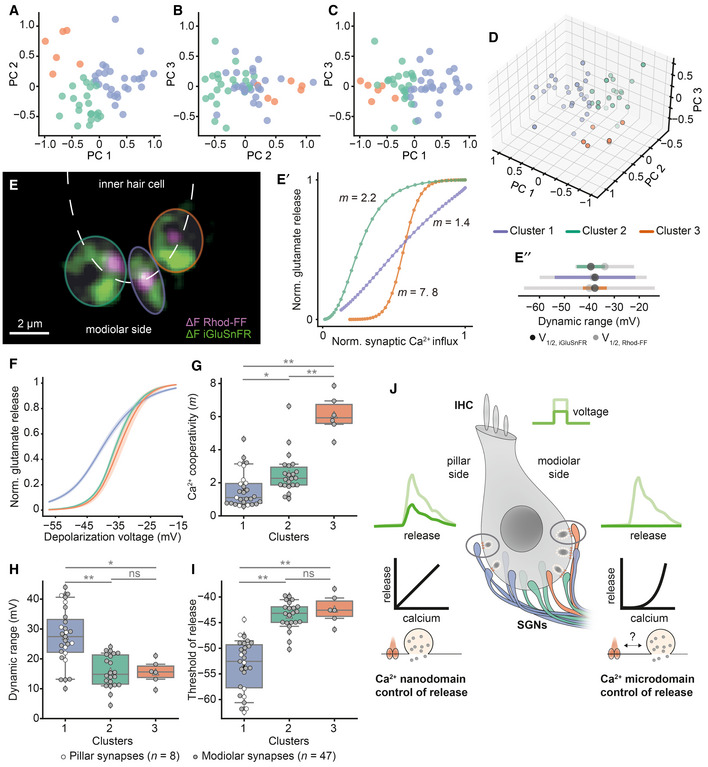
11 synaptic properties (except for the positional and whole‐cell information; see Fig EV6) of 55 synapses (N = 34 IHCs from 28 mice, ruptured patch‐clamp, 10 mM intracellular EGTA, 5 mM [Ca2+]e) were used for the PCA and K‐means clustering.
A–CThe 2D plots of the first three principal components (PCs), labeled based on the clusters obtained by K‐means clustering.
D3D plot showing the first three PCs.
ESingle IHC exhibits different modes of Ca2+‐control of release. The overlaid mean ΔF image of Rhod‐FF (magenta) and iGluSnFR (green) shows synaptic Ca2+ influx and glutamate release at three neighboring modiolar synapses (individual synapses are color coded based on their clusters).
E′The relation between Ca2+ influx and glutamate release of given synapses in the voltage range of −57 to −17 mV plotted with 1 mV increments. A power function was fitted until the 25% of normalized iGluSnFR‐AUC. Synapses showed different Ca2+ dependencies (m = 2.2, 1.4, 7.8; green, purple, orange).
E″Dynamic ranges of corresponding Ca2+ influx (gray) and glutamate release (color coded) with V1/2 depicted. Note that the synapses from Cluster 1 (purple), employing Ca2+ nanodomain‐like control of release (m = 1.4), exhibit wider dynamic range than the other synapses.
F–IMean glutamate release (iGluSnFR‐AUC) as a function of depolarization voltage in the three identified clusters (mean ± SEM, Cluster 1: n = 27 synapses, Cluster 2: n = 22 synapses, Cluster 3: n = 6 synapses). The Ca2+ cooperativity (m) (G), dynamic range (H), and glutamate release threshold (V10) (I) show differences for the three clusters. Cluster 1 is composed of linear synapses with wider dynamic range and lower threshold compared to the other clusters. Pillar synapses are depicted as white‐filled circles, and modiolar ones as gray‐filled circles. Box plots indicate first quartile (25th percentile), median and third quartile (75th percentile) with whiskers reaching from 10–90%. The clusters were compared by one‐way ANOVA test, followed by a post hoc Tukey's test. *P ≤ 0.05, **P ≤ 0.01.
JThe proposed model for sound intensity encoding in an IHC. Differences in the presynaptic control of release, in terms of Ca2+ signaling and Ca2+ channel–exocytosis coupling, enable IHC to diversify the transfer functions of individual synapses for the same receptor potentials.
Next, we checked the response properties of these putative synapse subtypes. The first subtype of synapses showed a low m (1.56 ± 1.07, 27 synapses) indicating a Ca2+ nanodomain‐like control of release as well as a wide dynamic range (27.52 ± 9.37 mV) and a hyperpolarized activation threshold (−53 ± 5.07 mV) of release. In contrast, the third synapse subtype showed a high m (6.10 ± 1.18, six synapses) with smaller dynamic range (15.53 ± 3.95 mV) and a more depolarized threshold (−42 ± 2.8 mV; Fig 5F–I). Synapses from the first cluster are predicted to be active already around the IHC receptor potential (−55 mV, Fig 5I) (Johnson et al, 2011). The properties of the second synapse subtype fell in between those of subtypes 1 and 3. Finally, we evaluated positions of the three synapse subtypes in an effort to match them to the concept of a SGN‐subtype‐specific innervation pattern along the pillar–modiolar axis. Pillar synapses were exclusively of subtype 1, while modiolar synapses were distributed across all subtypes. This is exemplified by three neighboring modiolar synapses of an IHC (Fig 5E): Each synapse belongs to a separate cluster, employing different apparent Ca2+ dependencies (see Appendix Fig S9 for the data of all individual IHCs). Hence, different topographies of Ca2+ channels and SV release sites apparently co‐exist even in compact presynaptic cells. How the IHC manages to vary the AZ organization and, thereby, Ca2+ influx–exocytosis coupling remains to be elucidated. Our data indicate some extent of pillar–modiolar segregation of synaptic properties, while substantial heterogeneity is found among the AZ at all positions. Taken together, we propose a model in which IHCs fractionate the coding of sound intensity information, contained in the receptor potential, via heterogeneous synaptic input–output functions that are sourced by differences in voltage dependence and release site coupling to Ca2+ channels (Fig 5J).
The auditory system encodes sound pressures over a range of six orders of magnitude. The sensory mechanisms contributing to this fascinating behavior include active cochlear micromechanics, adaptation at various stages, as well as diversity of SGNs and their synapses with IHCs. At each tonotopic position in the cochlea, SGNs differ in their spontaneous and evoked firing, effectively tiling the range of audible sound pressures with their responses (Kiang et al, 1965; Sachs & Abbas, 1974; Liberman, 1978; Winter et al, 1990; Taberner & Liberman, 2005). Differences in the transcriptomic profiles of SGNs have led to their categorization into molecular subtypes (Sun et al, 2018; Shrestha et al, 2018; Petitpré et al, 2018). Moreover, heterogeneity in the pre‐ and postsynaptic properties of afferent IHC‐SGN synapses as well as of efferent SGN innervation have been proposed to explain the fractionation of the entire range of audible sound pressures, detected by the same IHC, into different neural representations (Ruel et al, 2001; Frank et al, 2009; Liberman et al, 2011; Ohn et al, 2016; Neef et al, 2018). Here, we studied the transfer at individual IHC‐SGN synapses, by imaging of synaptic Ca2+ signals and glutamate release during IHC patch‐clamp recordings. On average, glutamate release had a voltage threshold near the physiological resting potential (Figs 1 and 4) and showed a near‐linear dependence on the whole‐cell Ca2+ influx when primarily varying the open‐channel number (Fig EV3). We then employed sequential dual‐color imaging of Ca2+ signals and glutamate release of single AZs (Fig 2). This way we revealed the heterogeneity of synaptic transfer functions, rooted in differences in voltage dependence of the Ca2+ influx and in its coupling to exocytosis (Fig 3). We found a pillar–modiolar gradient of AZ transfer functions: consistent with the preferred innervation of high‐SR SGNs on the pillar side, pillar AZs operated at more negative potentials than the modiolar ones (Fig 4). By K‐means clustering of AZs according to the single‐synaptic parameters, we obtained three putative synapse subtypes, differing in the voltage dependence, apparent Ca2+ dependence, and dynamics of release (Fig 5).
Studying Ca2+ signals and glutamate release at individual AZs revealed that the coupling of Ca2+ influx to exocytosis varies among the AZs, unlike previously assumed based on average AZ behavior (Brandt et al, 2005; Goutman & Glowatzki, 2007; Wong et al, 2014; Pangrsic et al, 2015). We show that it ranges from Ca2+ nanodomain to Ca2+ microdomain control of exocytosis and differs even among neighboring IHC AZs. Approximately one‐half of the AZs showed Ca2+ nanodomain‐like control of exocytosis (operationally defined as m < 2) during primary manipulation of the open‐channel number. Hence, different from what was proposed based on an AZ summation model (Heil & Neubauer, 2010), Ca2+ nanodomain‐like control of exocytosis occurs at individual IHC AZs. However, we found the other half of the AZs with m> 2 suggesting Ca2+ microdomain control of exocytosis to co‐exist. We assume all AZs share the same intrinsic Ca2+ cooperativity of 4–5 that was established for IHC exocytosis by Cm recordings (Beutner et al, 2001; Brandt et al, 2005). This likely reflects the cooperative binding of 4–5 Ca2+ ions to the putative Ca2+ sensor of IHC release, otoferlin (Roux et al, 2006). In the 4th postnatal week, we consider IHCs to have reached maturity but further changes might occur (Liberman & Liberman, 2016). However, the heterogeneity was preserved in all recorded ages (P21–26, Appendix Fig S13). Here, we studied synapses of apicocochlear IHCs and, given the previously described tonotopic differences in Ca2+ channel–release coupling on the whole‐cell level (Johnson et al, 2017), single‐synapse analysis in basocochlear IHCs remains an important task for the future. Taken together, we propose a model by which IHCs vary the topographies of Ca2+ channels and SV release sites at the AZs likely to diversify synaptic transmission beyond the heterogeneity of AZ size and Ca2+ signaling.
Non‐exclusive candidate mechanisms for position‐dependent AZ diversification in IHCs include (i) developmental competition of synapses, (ii) transsynaptic signaling from SGNs, and (iii) planar polarity signaling. One interesting idea is that, during development, pioneer SGN axons (Druckenbrod et al, 2020) making the first synaptic contact at the modiolar side of IHCs attract large amounts of presynaptic resources. In addition to such potential transsynaptic cueing of AZ properties, IHCs might employ their planar polarity signaling to instruct modiolar–pillar gradients of AZ size (Jean et al, 2019). How such signaling differentially shapes AZ properties remains an exciting topic for future studies. Clearly, polarized trafficking of components of the Ca2+ channel complex or other AZ proteins could contribute. This might, for instance, involve the adapter and PDZ‐domain protein Gipc3, defective in human deafness (Charizopoulou et al, 2011), required for the modiolar–pillar gradient of maximal synaptic Ca2+ influx (Ohn et al, 2016). Intriguingly, the spatial distribution of the number of Ca2+ channels and their voltage dependence might be regulated by different mechanisms (Jean et al, 2019). While the number of Ca2+ channels scales with AZ/ribbon size (Frank et al, 2009; Ohn et al, 2016; Neef et al, 2018) and shows a modiolar–pillar gradient, the topography relative to SV release sites and biophysical properties of the Ca2+ channels seem to follow an opposing gradient. For instance, the voltage dependence of synaptic Ca2+ influx (Ohn et al, 2016; Jean et al, 2019, and Fig 4) and, consecutively, glutamate release (Fig 4) shows a pillar–modiolar gradient, with activation at more hyperpolarized potential for the pillar AZs that show smaller Ca2+ channel clusters. Likewise, m of exocytosis was typically lower at the pillar side, indicating that Ca2+ nanodomain control of release prevails with the lower number of Ca2+ channels, while an increased channel number favors domain overlap as also predicted by modeling (Wong et al, 2014). Future studies will need to probe for differences in the abundance of potential molecular linkers (Han et al, 2011; Liu et al, 2011; Jung et al, 2015; Krinner et al, 2017) or spacers of Ca2+ channels and release sites such as RIM and RIM‐BP among the IHC AZs and to explore actual Ca2+ channels–release site topography of IHC AZs e.g. by electron microscopy (Nakamura et al, 2015).
As for size and Ca2+ channel number of the AZ, the positional dependence of biophysical properties and topography of Ca2+ channels might be shaped during postnatal development. For instance, AZs of immature IHCs, on average, employ a Ca2+ microdomain‐like control of exocytosis. Maturation tightens the coupling of Ca2+ influx and exocytosis at least when considering the collective behavior of all IHC AZs (Wong et al, 2014), coinciding with the appearance of high‐SR fibers (Wong et al, 2013). Our study indicates that a subset of mature IHC synapses employs Ca2+ microdomain control of release, representing an additional mechanism employed by the IHC to diversify synaptic transmission and endowing this subset with further potential of presynaptic plasticity (Vyleta & Jonas, 2014).
Potential pitfalls of our imaging approach to single IHC AZ function include the following: (i) glutamate spill‐over from neighboring synapses, (ii) saturation of iGluSnFR and other non‐linear effects resulting from the glutamate binding to endogenous receptors in the postsynapse, and (iii) contamination of synaptic Ca2+ signals by mitochondrial‐Ca2+ changes, as some rhodamine‐based dyes partition into mitochondria (Oheim et al, 2014). We aimed to minimize synaptic crosstalk by choosing well‐separated boutons. Moreover, simulations showed iGluSnFR provides a linear indication of glutamate release (Armbruster et al, 2020). While we cannot rule out a contribution of mitochondrial Rhod‐FF, the use of 10 mM EGTA would make mitochondrial‐Ca2+ uptake unlikely. This is supported with the strict co‐localization of the Rhod‐FF signals with the synaptic ribbon (Fig EV4).
The functional subtypes of SGNs are said to spatially segregate their IHC innervation: High‐SR SGNs preferentially innervate the pillar side of the IHC, while low‐SR SGNs preferentially innervate the modiolar side of the IHC in the cat cochlea (Liberman, 1982). Here, we demonstrate by iGluSnFR imaging in the apical organ of Corti of mice that glutamate release from pillar synapses operates at more hyperpolarized potentials than the modiolar ones. This offers an exciting presynaptic hypothesis for the functional SGN diversity: Resting potential or weak receptor potentials will primarily recruit pillar synapses, which can readily explain the high SR and low sound threshold of SGNs innervating the pillar IHC side. While this hypothesis was previously phrased based on the heterogeneous voltage dependence of Ca2+ influx (Ohn et al, 2016), whether and how this translates into heterogeneity of glutamate release remained unclear. Indeed, unlike we had previously assumed (Ohn et al, 2016), the present study revealed differences in the Ca2+ channel–release coupling among the IHC AZs.
Heterogeneity of Ca2+ channel–release coupling, too, could contribute to diversifying SGN function. First, Ca2+ nanodomain control of exocytosis would increase the SR, as stochastic opening of Ca2+ channels could trigger release in such a tight coupling scenario (Moser et al, 2006; Eggermann et al, 2012). Interestingly, AZs of vestibular type I hair cells on average show very tight coupling of Ca2+ channels and exocytosis (Vincent et al, 2014) and are innervated by neurons with high spontaneous activity (~ 90 spikes/s) (Goldberg & Fernandez, 1971). Second, Ca2+ nanodomain control of exocytosis likely also promotes low voltage threshold for the same reason, and indeed, we found a correlation between the threshold of release and m (Fig EV6). Third, Ca2+ nanodomain control of exocytosis widens the dynamic range of release. Indeed, we found a negative correlation between dynamic range and m (Fig EV6). One of the most puzzling questions is how the pillar AZs with more hyperpolarized operation driving high‐SR SGNs that show a smaller dynamic range of sound encoding can be reconciled with the wider dynamic range of glutamate release found for pillar AZs. One possible explanation is high SR at the in vivo IHC resting potential lowers the standing RRP available for sound‐evoked release and hence causes a narrower dynamic range of release (reviewed in ref. (Moser et al, 2019)). Indeed, disruption of PDZ protein Gipc3 resulted in enhanced SR and narrower dynamic range (Ohn et al, 2016). Furthermore, as rate‐level functions are usually assessed in response to sound stimuli lasting more than 50 ms, there is likely a contribution of RRP replenishment (Pangrsic et al, 2015). We cannot exclude possible contribution of postsynaptic properties, efferent modulation, dynamic range adaptation (Wen et al, 2009), and non‐linearity imposed by the basilar membrane (Sachs & Abbas, 1974) on the dynamic range of SGN firing. Lastly, differences in Ca2+ channel–exocytosis coupling could affect the short‐term plasticity (reviewed in ref. (Böhme et al, 2018)), note the higher adaptation strength of high‐SR SGNs in vivo (Heil & Peterson, 2015). A similar example of linear and non‐linear synapses comes from the zebrafish bipolar cells (Odermatt et al, 2012) that encode light intensities over four orders of magnitude. In conclusion, we propose a model where differences among the IHC AZs in the presynaptic control of release, in terms of presynaptic Ca2+ signaling and Ca2+ channel–exocytosis coupling, enable a single IHC to diversify the synaptic signaling to SGNs for the same receptor potential. We suggest that non‐linear transformation of the sensory signal by heterogeneous synapses extends the dynamic range of intensity coding.

| Reagent/resource | Reference or source | Identifier or catalog number |
|---|---|---|
| Experimental Models | ||
| C57BL/6J (Mus musculus) | ||
| Recombinant DNA | ||
| pAAV‐hSyn‐iGluSnFR | Marvin et al (2013) | RRID:Addgene_98929 |
| Antibodies | ||
| Chicken anti‐GFP | Abcam | Abcam Cat# ab13970, RRID:AB_300798 |
| Guinea pig anti‐parvalbumin | Synaptic Systems | Cat# 195 004, RRID:AB_2156476 |
| Mouse anti‐CtBP2 | BD Biosciences | Cat# 612044, RRID:AB_399431 |
| Chemicals, enzymes and other reagents | ||
| Rhod‐FF, tripotassium salt | AAT Bioquest, Biomol | Cat #: 21075 |
| TAMRA‐conjugated CtBP2 peptide | Zenisek et al (2004) | BioSynthan |
| Abberior Star 488‐conjugated CtBP2 peptide | Zenisek et al (2004) | BioSynthan, MPIbpc |
| Amphotericin B | Merck (Calbiochem) | Cat #: 171375 |
| Software | ||
| Python | Python Software Foundation | https://www.python.org/psf/ |
| Igor | WaveMetrics | https://www.wavemetrics.com/ |
| PatchMaster (Software), HEKA EPC‐10 (Hardware) | HEKA Electronic GmbH | https://www.heka.com/ |
| ImageJ | https://imagej.nih.gov/ij/ |
All experiments were done in compliance with national animal care guidelines and were approved by the University of Göttingen Board for Animal Welfare and the Animal Welfare Office of the State of Lower Saxony (permit number: 17‐2394). Postnatal AAV injections were made into scala tympani of the right ear through the round window (Akil et al, 2012; Jung et al, 2015). P5–7 WT C57Bl/6 mice were used for the injection of AAV9 virus under human synapsin promoter (pAAV9.hSyn.iGluSnFR.WPRE.SV40, Cat#98929‐AAV9, Addgene, USA, or produced in our own laboratory, see Reagents and Tools Table, and Huet and Rankovic, 2021) to drive transgenic expression of iGluSnFR in SGNs. In brief, the right ear was accessed through a dorsal incision. Once the round window membrane was located, a quartz capillary pipette was used to gently puncture it and inject ∼ 1–1.5 μl of pAAV9.hSyn.iGluSnFR (titer ≥ 1 × 10¹³ vg/ml). Subsequently the wound was sutured. The whole procedure was performed under general isoflurane anesthesia. For analgesia, buprenorphine (0.1 mg/kg) was injected subcutaneously prior the surgery, additional local analgesia (xylocaine) was applied to the skin and post‐surgery pain was covered by metamizol (1.33 mg/kg) provided in the drinking water for 5 days. The recovery of the animals was monitored on a daily basis. All animals were kept in a 12‐h light/dark cycle, with access to food and water ad libitum and together with the mother until the end of the weaning period (∼ P21). Injected WT mice were used for experiments either 1 week (P15–19) or 2 weeks (P21–26) after the injection.
Recordings of auditory brainstem responses (ABR) were performed on P29 mice as previously described (Strenzke et al, 2016). Briefly, mice were anesthetized with a combination of ketamine (125 mg/kg) and xylazine (2.5 mg/kg) intraperitoneally. The core temperature was maintained constant at 37°C using a heat blanket (Hugo Sachs Elektronik–Harvard Apparatus). The TDT II system run by BioSig software (Tucker Davis Technologies) or by MATLAB (MathWorks) was used for stimulus generation, presentation, and data acquisition. Tone bursts (6/12/24 kHz, 10‐ms plateau, 1 ms cos2 rise/fall) or clicks of 0.03 ms were presented at 40 Hz (tone bursts) or 20 Hz (clicks) in the free field ipsilaterally using a JBL 2402 speaker.
The cochlea was fixed in formaldehyde (4% in phosphate‐buffered saline [PBS], 1 h on ice). For immunostaining of the whole‐mount organs of Corti, the apical turns of organs of Corti were dissected out and washed three times with PBS. For immunostaining of the cryosections, the cochlea was decalcified in 0.5 M EDTA overnight. After a PBS washing step, the cochleae were incubated in 25% sucrose in PBS at 4°C. The cochlea was frozen in Tissue‐Tek and cryosectioned with section thickness of 16 µm.
The samples (cochlear apical turns or cryosections) were blocked with a goat serum dilution buffer (16% normal goat serum, 450 mM NaCl, 0.3% Triton X‐100, 20 mM phosphate buffer, pH 7.4) for 1 h at room temperature in a wet chamber. The blocking was followed by an overnight incubation with the primary antibodies at 4°C. After 3 × 5 min PBS washing steps, the samples were incubated with the secondary antibodies for 1 h at room temperature. Following the final 4 × 5 min PBS washing steps, the samples were mounted in mounting medium (Mowiol 4‐88, Sigma). The primary antibodies used were the following: mouse anti‐CtBP2 (1:200, BD Biosciences, 612044, See Reagents and Tools table)—to detect synaptic ribbons—chicken anti‐GFP (1:200, Abcam, 13970)—to detect iGluSnFR— and guinea pig anti‐parvalbumin (1:200, Synaptic Systems, 195004)—to detect SGNs, OHCs, and IHCs. Secondary goat antibodies were used with 1:200 dilution: Alexa Fluor 488‐conjugated anti‐chicken (Dianova, 703‐45‐155), Alexa Fluor 633‐conjugated anti‐mouse (Invitrogen, A31571), Alexa Fluor 488 anti‐chicken (Invitrogen, A11039), and Alexa Fluor 568 anti‐guinea pig (Invitrogen, A11075). Images were acquired using an Abberior Instruments Expert Line STED microscope, with excitation lasers at 488, 561, and 640 nm using a 1.4 NA 100× or 20× oil immersion objective, in confocal mode. Z‐step sizes of 0.5 or 0.6 µm were used with 100× or 20× objectives, respectively. Images were adjusted for brightness and contrast using ImageJ for illustration purposes.
The apical 2/3 turn of organs of Corti was acutely dissected from P15 to P26 animals in HEPES Hanks' solution containing (in mM): 5.36 KCl, 141.7 NaCl, 10 HEPES, 0.5 MgSO4, 1 MgCl2, 5.6 d‐glucose, and 3.4 l‐glutamine (pH 7.2, ∼ 300 mOsm/l). The IHC basolateral membranes were exposed by cleaning of nearby cells with a suction pipette by approaching from either pillar or modiolar side. All experiments were conducted at room temperature (20–25°C). Patch pipettes were made from GB150‐8P or GB150F‐8P borosilicate glass capillaries (Science Products, Hofheim, Germany) for perforated and ruptured patch‐clamp recordings, respectively. To decrease the capacitive noise, pipettes were coated with Sylgard and their tips were polished with a custom‐made microforge. All patch‐clamp recordings were done simultaneously with fluorescent imaging of iGluSnFR or of iGluSnFR and Ca2+.
Perforated patch‐clamp was performed as described previously (Moser & Beutner, 2000). For Ca2+ current and membrane capacitance (Cm) measurements, the extracellular solution contained the following (in mM): 110 NaCl, 35 TEA‐Cl, 2.8 KCl, 1 MgCl2, 1 CsCl, 10 HEPES, 1.3 CaCl2, and 11.1 d‐glucose (pH 7.2, ∼ 305 mOsm/l) and was introduced into the recording chamber via a perfusion system. The pipette solution contained (in mM): 130 Cs‐gluconate, 10 TEA‐Cl, 10 4‐AP, 10 HEPES, 1 MgCl2, as well as 300 mg/ml amphotericin B (pH 7.17, ∼ 290 mOsm/l). The intracellular solution also contained the TAMRA‐conjugated dimeric CtBP2/RIBEYE‐binding dimer peptide (10 μM, Biosynthan, Germany, See Reagents and Tools table) (Francis et al, 2011; Wong et al, 2014). To label the synaptic ribbons, the peptide was introduced to the cell by rupturing the membrane patch toward the end of the recordings. The intracellular exposure to amphotericin (used to perforate the membrane for electrical access) did not result in a noticeable increase in IHC conductance and compromise IHC health. All the measurements were done via EPC‐10 amplifiers controlled by Patchmaster software (HEKA Elektronik, Germany). The holding potential was −87 for all the recordings. All voltages were corrected for liquid junction potential offline (17 mV). Currents were leak‐corrected using a p/10 protocol. Recordings were used only if the leak current was lower than 30 pA and the series resistance (Rs) was lower than 30 mOhm. The Lindau‐Neher technique was used to measure the Cm changes (Lindau & Neher, 1988). Exocytosis was quantified from Cm changes as described previously (Moser & Beutner, 2000; Neef et al, 2014). IHCs were stimulated by step depolarizations of different durations (2–100 ms, applied in a pseudo‐randomized manner) to −23 mV at intervals of 60–100 s (Fig EV1D–G). To probe voltage dependence of release, IHCs were step depolarized for 10 ms to potentials ranging from −62 to −22 mV in 5 mV increments in a pseudo‐randomized order (Figs 1 and EV2). For the Zn2+ perfusion experiments, 1 mM Zn2+ was slowly perfused in and out of the recording chamber, while IHCs were step depolarized for 10 ms to −23 mV simultaneously up to 20 times (Figs EV1A and B, and EV3D‐F).
Ruptured patch experiments were performed in extracellular solution containing (in mM): 2.8 KCl, 102 NaCl, 10 HEPES, 1 CsCl2, 1 MgCl2, 35 TEA‐Cl, 2 mg/ml d‐Glucose, and 5 CaCl2 (pH 7.2, 300 mOsm). The patch pipette solution contained (in mM): 111 l‐glutamate, 1 MgCl2, 1 CaCl2, 10 EGTA, 13 TEA‐Cl, 20 HEPES, 4 Mg‐ATP, 0.3 Na‐GTP and 1 l‐Glutathione (pH 7.3, ∼ 290 mOsm). For fluorescent imaging, 800 μM of the low‐affinity chemical Ca2+ indicator Rhod‐FF tripotassium salt (Kd:19 μM, AAT Bioquest, USA, See Reagents and Tools table) was added to the intracellular solution. The recordings were discarded when the leak current exceeded −50 pA at −87 mV or RS was greater than 15 MΩ within 4 min after break‐in. For Ca2+ imaging experiments, a voltage ramp (from −87 to +63 mV during 150 ms; 1 mV/ms) was applied to evoke Ca2+ influx (Figs 2 and 3).
For all IV recordings, the IHCs were step depolarized for 20 ms from −87 to +63 mV in 5 mV increments. The IV recordings were used to assess the fitness of the cell, and recordings were discarded when the Ca2+ current rundown exceeded 25%.
Imaging experiments were performed with a spinning disk confocal scanner (CSU22, Yokogawa, Germany) mounted on an upright microscope (Axio Examiner, Zeiss, Germany) with 63×, 1.0 NA objective (W Plan‐Apochromat, Zeiss). The spinning disk speed was set to 2,000 rpm to avoid uneven illumination. A scientific CMOS camera (Neo, Andor, Northern Ireland) with a pixel size of 103 nm was used to acquire images. iGluSnFR and Rhod‐FF or TAMRA peptide were excited by diode‐pumped solid‐state lasers with 491 nm and 561 nm wavelength, respectively (Cobolt AB).
To avoid photobleaching, iGluSnFR‐expressing SGN boutons were detected via low intensity 491 nm excitation. The imaging plane for the target IHC was selected when several transduced boutons were visible, in the mid‐basal section of the cell, avoiding the high synapse density at the basal pole. A brief step depolarization was applied to the cell to check for the functional signal in the given plane. iGluSnFR fluorescence was acquired at 50 Hz simultaneously with patch‐clamp recordings. The iGluSnFR signal was evoked by step depolarizations of different durations to different voltage values, as it is specified in every dataset.
For the sequential dual‐color imaging of Ca2+ and glutamate release, as described above for iGluSnFR imaging, the imaging plane was selected based on the baseline fluorescence of iGluSnFR. Once the middle plane was set, the fluorescence of Rhod‐FF was imaged at 100 Hz while Ca2+ currents were triggered by applying five voltage ramps (from −87 to +63 mV, 1 mV/ms) in five alternating planes separated by 0.5 μm. To precisely control the Z‐plane, a piezo positioner for the objective (Piezosystem, Germany) was used. After the Ca2+ imaging, the iGluSnFR signal was acquired at 50 Hz by applying 50‐ms‐long step depolarizations from the holding potential of −87 to different voltage values. Depolarizations (to −57, −49, −45, −41, −37, −33, −25, −17 mV) were applied in a pseudo‐randomized manner and covered the dynamic range of IHC glutamate release.
Electrophysiological recordings were analyzed using custom‐written programs in Igor Pro 6.3. Whole‐cell Ca2+ charge (QCa) was calculated by the time integral of the leak‐subtracted current during the depolarization step. ∆Cm was calculated as the difference between the average Cm 400 ms before and after the depolarization, skipping the initial 100 ms after the depolarization.
Image and further data analysis and visualization were done in Python (Python software foundation) with custom written code using the following Python libraries: NumPy, Pandas, Matplotlib, Skimage, SciPy, Sklearn, statmodels, and Seaborn.
The ∆F image was created by subtracting baseline fluorescence (F0, an average of 15 frames before stimulus) from the fluorescence images acquired during/after stimulation (F, an average of five frames). The ∆F image was median‐filtered with a two‐dimensional pixel array size of 4–6 depending on the signal amplitude. To create a mask for ROI detection, maximum entropy thresholding was applied to the median‐filtered ∆F image. To label and separate individual ROIs, a watershed segmentation algorithm was used. A single mask was generated per cell, using the recording with strongest stimulation, and applied for all images. Individual ROIs, corresponding to postsynaptic SGN boutons, were further confirmed by the nearby presence of presynaptic ribbon peptide (TAMRA‐conjugated dimeric CtBP2‐binding peptide). The fluorescence of every pixel in the defined ROI was averaged over time for further analysis. The background fluorescence was calculated by averaging 60 × 60 pixels in the pillar region of the image, where no iGluSnFR fluorescence is expected: By their anatomy, SGNs innervate IHCs and leave the cochlea toward the modiolus.
The average background value was subtracted from the raw fluorescence traces (F). Following background subtraction, ∆F traces were generated by subtraction of mean baseline fluorescence (F0). ∆F was normalized to F0 to create ∆F/F0 traces. For peak detection, ∆F/F0 traces were smoothened using a Hanning window function with a window size of 7. To correct for photobleaching, we fitted a single exponential to ∆F/F0 traces. The area under the curve (AUC) was estimated by calculating the area between ∆F/F0 and the fit in an interval of 40 frames from the beginning of the stimulus.
For iGluSnFR, mean of 10 frames before stimulation is compared pairwise per synapse with the mean of four frames after stimulation. For ∆Cm, mean of 400 points before and after stimulation is used for pairwise comparison per cell.
To obtain decay constant (τ off), the following function was fitted to the 30 points of photobleaching corrected ∆F/F0 traces after stimulation.
To assess the dynamics of RRP and sustained exocytosis, we fitted a sum of an exponential and linear function (Pangrsic et al, 2015) to ∆Cm and iGluSnFR‐AUC for different stimulus durations.
With the assumptions of ∆Cm of ~ 40 aF contributed by a single SV (Grabner & Moser, 2018) and ~ 12 AZs (Meyer et al, 2009) for the apical IHCs, we obtained iGluSnFR‐AUC increase of 0.23 a.u. per SV.
The ROIs were picked as described above. Differently, a Gaussian filter with sigma of 1–3 was applied consistent with the detection of Ca2+ hot spots (see below). A mean mask was generated per cell using all the recordings. ROIs were confirmed by the presence of a corresponding Ca2+ “hot spot”.
Similarly, a ∆F image was created from the mean time series, in this case, by averaging all the trials from five recorded planes. This ∆F image was treated the same way as described for iGluSnFR‐ROI detection. The created mask was applied to all recording planes and the plane with the maximum ∆F for a given ROI was used for further analysis. This way we used the plane with the highest signal for each Ca2+ “hot spot”.
To remove the noise caused by the spinning disk speed at 2,000 rpm (33.3 Hz), obvious in the Fourier amplitude spectrum, the raw traces were filtered with a 33.3 Hz band‐stop filter. The obtained traces were background‐subtracted and normalized to F0 as described above. Fluorescence–voltage (FV) relations for iGluSnFR were estimated from the step depolarizations to different voltage values. iGluSnFR‐AUC for each depolarization was calculated as described above.
A Boltzmann fit was used to estimate the two fitting parameters: voltage of half‐maximum activation (V1/2) and slope factor (k) of glutamate release.
For Ca2+ imaging, FV curves were estimated from voltage ramps. To optimize the raw FV traces against noise such as readout or shot noise from the CCD camera, the following equation was used (Ohn et al, 2016):
The slope factor (k) was obtained with this equation. The resulting fit was used to estimate V1/2 by minimizing the scalar at the mid‐point. The reversal potential (Vr) was fixed to +47.6 mV after LJ potential (17 mV) correction. In addition, this fit was used to calculate the fractional activation curve, dividing it by the extrapolated linear fit to the decay of fluorescence. To estimate fractional V1/2,Pactivation and k 1/2,Pactivation (see Fig EV6), an additional Boltzmann fitting was done.
The peak of the Rhod‐FF signal was obtained by averaging three frames corresponding to the voltage values between −17 and 3 mV during ramp depolarization. Dynamic ranges were calculated from the fits as the voltage range of 10–90% of the maximal activation. Threshold was calculated as the voltage value where there is 10% of the maximal activation. Note that V1/ 2 values obtained from fluorescence traces after denoising (band‐stop filter at 33.3 Hz) were comparable to the ones from the raw fluorescence traces.
FV fits for Rhod‐FF or QCa and iGluSnFR‐AUC were plotted against each other in the voltage range of −57 to −17 mV. To obtain single‐synapse glutamate release–Ca2+ signal/whole‐cell Ca2+ charge relationship, a power function was fitted:
To estimate the cell boundary, an ellipse was fitted to the baseline fluorescence of Rhod‐FF. We defined the pillar–modiolar axis of the cell as the major axis of the ellipse. We calculated the shortest distance from the center of a given Ca2+ "hot spot" to the normalized major axis. A number was assigned to a given synapse on the normalized scale from 0 (pillar side) to 1 (modiolar side).
K‐means clustering algorithm (K = 3) was applied to the whole dataset of 11 synaptic properties for three clusters (see Fig 5). Principal component analysis was used to display the clusters obtained by the K‐means clustering.
All the statistical tests were performed in Python (Python Software Foundation). Averages are expressed as mean ± SD or as mean ± SEM (specified in the figure legends), and box plots indicate 25–75 quartile with whiskers reaching from 10 to 90%. Datasets were checked for normal distribution by D'Agostino & Pearson omnibus normality test and for equality of variances. For normally distributed data, unpaired two‐tailed student's t‐test was applied, and for non‐normally distributed data, Mann–Whitney U‐test was used. Dependent samples were compared by paired t‐test (for normally distributed data) or Wilcoxon's signed rank test (for non‐normally distributed data). Comparison of dispersion was performed by Levene's test. We used one‐way ANOVA for multiple comparisons followed by post hoc Tukey's test. The Pearson correlation coefficient was used to test for linear correlation. Significant differences are reported as *P ≤ 0.05, **P ≤ 0.01, ***P ≤ 0.001.
TM and ÖDÖ designed the study. ÖDÖ performed the experiments and the analysis. TM and ÖDÖ prepared the manuscript.
The authors declare that they have no conflict of interest.
We thank Dres. Christian Vogl and Vladan Rankovic for their contributions in the initial phase of the project, N. Dietrich, S. Gerke, D. Gerke, and C. Senger‐Freitag for expert technical assistance. We thank Dr. G. Ramos‐Traslosheros for his initial assistance with the analysis. We thank Dr. Thomas Euler for providing us with a sample of AAV9 hSyn.iGluSnFR. We thank Dres. J. Neef, L.M. Jaime Tobón, E. Neher, and S.O. Rizzoli for helpful comments on the manuscript. We thank Dr. Vladimir Belov for providing Abberior Star 488‐conjugated peptide. This work was supported by the Deutsche Forschungsgemeinschaft (DFG, German Research Foundation) under Germany's Excellence Strategy—EXC 2067/1‐390729940 to T.M. as well as via the collaborative research center 889 and the collaborative research center 1286 to T.M. Open access funding enabled and organized by ProjektDEAL.
This study includes no data deposited in external repositories.
 A sensory cell diversifies its output by varying Ca2+ influx‐release coupling among active zones
 Facebook
 Twitter
 Linkedin
 Whatsapp

