
The authors have declared that no competing interests exist.
Bacteria utilize endoribonuclease-mediated RNA processing and decay to rapidly adapt to environmental changes. Here, we report that the modulation of hns mRNA stability by the endoribonuclease RNase G plays a key role in Salmonella Typhimurium pathogenicity. We found that RNase G determines the half-life of hns mRNA by cleaving its 5′ untranslated region and that altering its cleavage sites by genome editing stabilizes hns mRNA, thus decreasing S. Typhimurium virulence in mice. Under anaerobic conditions, the FNR-mediated transcriptional repression of rnc encoding RNase III, which degrades rng mRNA, and simultaneous induction of rng transcription resulted in rapid hns mRNA degradation, leading to the derepression of genes involved in the Salmonella pathogenicity island 1 (SPI-1) type III secretion system (T3SS). Together, our findings show that RNase III and RNase G levels-mediated control of hns mRNA abundance acts as a regulatory pathway upstream of a complex feed-forward loop for SPI-1 expression.
Recent studies have shown that pathogenic bacteria with ribonuclease mutations display attenuated virulence, impaired mobility, and reduced proliferation in host cells. However, the molecular mechanisms underlying ribonuclease-associated pathogenesis have not yet been characterised. Here, we provide strong experimental evidence that the coordinated modulation of endoribonuclease activity constitutes an additional regulatory layer upstream of a complex feed-forward loop controlling global regulatory systems in the Salmonella pathogenicity island 1 (SPI-1) type III secretion system (T3SS). In addition, we showed that this regulatory pathway plays a key role in the virulence of S. Typhimurium in the host. Thus, our study improves the understanding of the mechanisms through which bacterial pathogens sense the host environment and respond precisely by expressing gene products required for adaptation to that particular niche.
Bacterial ribonucleases regulate gene expression via RNA processing and decay. They are essential for processing RNA precursors into mature, functional RNAs, and initiate the reactions that cleave and differentially regulate certain polycistronic mRNAs [1–5]. Bacterial ribonucleases also degrade mRNAs in response to environmental changes, such as nutrient starvation, exposure to toxic compounds, and changes in physicochemical factors such as temperature, pH, oxygen, pressure, redox-state, and salt concentration [2–7].
In Escherichia coli, mRNA decay is heavily dependent on endoribonuclease E (RNase E) [8–10], whose paralog endoribonuclease G (RNase G; encoded by rng) has a 36% amino acid sequence identity with the RNase E N-terminal catalytic domain [11,12]. Both enzymes are single-stranded RNA-specific endoribonucleases with a preference for cleaving AU-rich sequences [11,13,14]. RNase G participates in rRNA maturation and mRNA degradation [9,11,15–19]. E. coli lacking rne can be made viable by overexpressing RNase G; however, rng-complementation affects the abundance of a small portion of mRNAs in rne-deficient cells [9], indicating that RNase G and E play distinct physiological roles.
Salmonella enterica serovar Typhimurium (Salmonella Typhimurium) is a gram-negative, facultative intracellular bacterial pathogen of animals and humans. Since its RNase E and G homologs are evolutionarily close to those found in E. coli [20], S. Typhimurium is an excellent model system for studying the effect of RNA processing and degradation on bacterial pathogenicity. S. Typhimurium contains chromosomal regions, known as Salmonella pathogenicity islands (SPIs), that encode virulence factors. The SPI-1 region contains 39 genes encoding a type III secretion system (T3SS) that is essential for host cell invasion [21]. SPI-1 and other SPI genes are required for different stages of Salmonella pathogenesis [22–24], and the expression of SPI-1 invasion and effector genes can change in response to multiple environmental signals, decreasing under high oxygen, low osmolarity, low pH, and stationary phase conditions [23,25,26].
Coordinated signalling systems regulate SPI-1 gene expression via the transcription factors HilA, HilC, and HilD, encoded by SPI-1 [27,28], which are regulated upstream by histone-like nucleoid-structuring protein (H-NS). H-NS is a nucleoid-associated global transcriptional silencer abundant in enteric bacteria and represses AT-rich gene expression to protect the bacterial genome from horizontally acquired sequences [29,30]. H-NS regulates SPI-1 expression by binding to and down-regulating the hilA promoter [31], and is thought to form a complex with Hha, a small nucleoid-associated protein encoded by the hly operon in E. coli [32,33]; however, S. Typhimurium H-NS may bind the hilA promoter independently of Hha [31,34,35].
mRNA stability modulation has been associated with the ability of S. Typhimurium to rapidly adapt to host environments [36]. For instance, S. Typhimurium with RNase E and RNase III mutations display attenuated virulence, impaired mobility, and reduced proliferation inside Galleria mellonella and mice [37]. RNase III and polynucleotide phosphorylase (PNPase) are involved in the regulation of small regulatory RNAs in S. Typhimurium [38,39], and we previously showed that RNase G affects S. Typhimurium aminoglycoside resistance by processing the 5′ end of 16S rRNA [19]; however, the molecular mechanisms underlying ribonuclease-mediated S. Typhimurium pathogenesis have not yet been elucidated.
In this study, we observed that S. Typhimurium pathogenicity is associated with RNase G expression and further investigated the molecular mechanism underlying the pathophysiological role of RNase G in SPI-1 T3SS expression.
First, we examined whether RNase G levels affected S. Typhimurium pathogenicity using an epithelial cell infection assay. This method is a good model system for examining S. Typhimurium virulence since mutants with defective invasion and persistence in epithelial cells display markedly reduced virulence in animal hosts [40,41]. To assess the effect of RNase G levels on bacterial virulence, we measured the colony forming units (CFUs) of wild-type (WT; SL1344 + pACYC177), rng-deleted (Δrng; SL1344rng + pACYC177), and rng-complemented (Δrngcomp; SL1344rng + pSt-rng) S. Typhimurium strains following the infection of human intestinal epithelial cells (HCT116; Fig 1A). We found that the Δrng strain produced 51% fewer CFUs in HCT116 cells than the WT, whereas the Δrngcomp strain displayed a comparable number of intracellular CFUs to the WT strain (Fig 1B).

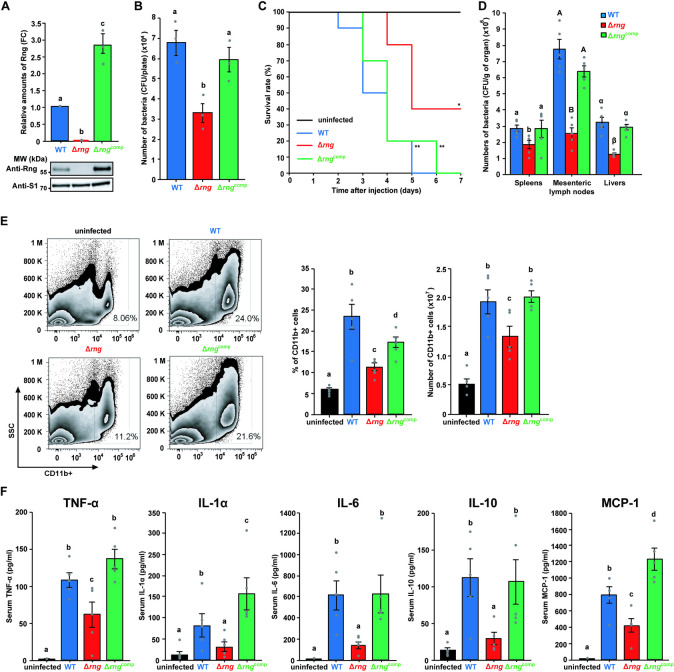
Effect of RNase G on S. Typhimurium pathogenicity.
(A) Western blot analysis of Rng in S. Typhimurium strains (WT, Δrng, and Δrngcomp). WT Rng levels were set to 1 and ribosomal protein S1 was used as an internal standard. (B) Effect of rng expression on S. Typhimurium epithelial cell invasion. Epithelial cells (HCT116) were infected with the S. Typhimurium cultures used in (A) at a multiplicity of infection (MOI) of 100 and the number of intracellular bacteria counted as CFUs. For (A) and (B), data present the mean ± s. e. m. of at least three independent experiments. Statistically significant differences are indicated by different letters. Western blot data were analyzed by one-way analysis of variance (ANOVA) with Student-Newman-Keuls test, P < 0.0001. Epithelial cell invasion data were analyzed using the one-way ANOVA with Student-Newman-Keuls test, P < 0.05. (C) Survival rate and duration of BALB/c mice infected with S. Typhimurium strains (WT, Δrng, and Δrngcomp) and PBS as a control. Survival was monitored for 7 days (n = 10 per group). * P < 0.05 and ** P < 0.01 for WT-, Δrng-, or Δrngcomp-infected mice vs. PBS-treated mice (two-sided unpaired Student’s t-test). (D) Colonization assay in BALB/c mice (n = 5 per group) infected with S. Typhimurium strains (WT, Δrng, and Δrngcomp). Bacterial CFUs were counted in the spleens, livers, and mesenteric lymph nodes. Data represent the mean ± s. e. m. of at least three independent experiments. Statistically significant differences by one-way ANOVA with Student-Newman-Keuls tests (P < 0.0001) are indicated by different letters: small letters indicate a difference from the spleens; large letters indicate a difference from the mesenteric lymph nodes; Greek symbols indicate a difference from the livers. (E) Flow cytometry analysis of innate myeloid immune cells (CD11b+) in mouse splenocytes from BALB/c mice infected with or without S. Typhimurium strains (WT, Δrng, or Δrngcomp). Cell numbers were calculated from total splenocyte counts. (F) Serum inflammatory cytokine (TNF-α, IL-1α, IL-6, IL-10, and MCP-1) levels in BALB/c mice infected with or without S. Typhimurium strains (WT, Δrng, or Δrngcomp) for 60 h. Data represent the mean ± s. e. m. of at least two independent experiments. Statistically significant differences from one-way ANOVA with Student-Newman-Keuls tests (P < 0.0001 for TNF-α and MCP-1; P < 0.01 for IL-1α, IL-6, and IL-10) are indicated by different letters.
Next, we investigated RNase G level-associated S. Typhimurium pathogenicity in a mouse model infected with S. Typhimurium at 104 CFUs (S1 Fig). While mice infected with either WT or Δrngcomp strain exhibited a similar mortality rate (all succumbed to the infection within 7 days), 40% of the mice infected with the Δrng strain survived 7 days post-infection (Fig 1C). In addition, we assessed bacterial load in the spleens, livers, and mesenteric lymph nodes of the infected mice. There were significantly fewer Δrng cells than WT cells in all the three organs. Furthermore, this colonization defect was restored to WT levels by complementation with the rng gene (Δrngcomp; Fig 1D).
Since the spleen plays key roles in the clearance of invading pathogens and the generation of specific immune responses, we assessed whether RNase G levels in S. Typhimurium affect host immune responses against bacterial infection by analysing the proportion of innate myeloid immune cells (CD11b+) in spleens by flow cytometry (Fig 1E). Mice infected with the WT strain displayed a higher percentage (uninfected: 5.9%, WT-infected: 23.4%) and number (uninfected: 0.5 × 10⁷, WT-infected: 1.9 × 10⁷) of CD11b+ cells than those infected with Δrng cells (11.3% and 1.3 × 10⁷) and this reduction was restored in mice infected with the Δrngcomp strain (17.3% and 2.0 × 10⁷; Fig 1E).
These results were confirmed by measuring serum levels of inflammatory cytokines, including IL-1α, IL-1β, IL-6, IL-10, IL-12p70, IL-17A, IL-23, IL-27, MCP-1, IFN-β, TNF-α, and GM-CSF. While IL-1β, IL-12p70, IL-17A, IL-23, IL-27, IFN-β, and GM-CSF levels did not change significantly in Δrng-infected mice (S2 Fig), WT infection sharply increased the levels of TNF-α, IL-1α, IL-6, IL-10, and MCP-1 in the serum of mice (Fig 1F), indicating that RNase G plays a pathogenic role in inflammation induced by S. Typhimurium infection. Consistent with our previous results, mice infected with the Δrngcomp strain displayed inflammatory cytokine levels comparable to those of the WT-infected mice.
Cytokines released from activated innate immune cells play essential roles as mediators of inflammation and in the elimination of invading pathogens [42]; however, the excessive expression of inflammatory cytokines such as TNF-α, IL-1α, and IL-6 is directly involved in bacterial pathogenicity, leading to the death of infected hosts [43–45]. Our data revealed that the mortality rate of infected mice correlated positively with the levels of inflammatory cytokines, including TNF-α, IL-1α, and IL-6 (Fig 1F). Thus, inflammatory cytokine expression was lower in the RNase G-deficient strain than in the RNase G-sufficient strain and may explain the reduced mortality of mice infected with the Δrng strain. Taken together, these results suggest that RNase G levels are strongly associated with S. Typhimurium pathogenicity.
The proteome of S. Typhimurium cells is known to change dynamically throughout adhesion, colonization, invasion, intracellular survival, proliferation, and biofilm formation under the control of SPI gene expression [46,47]. To understand the effect of RNase G on T3SS expression, we examined the protein expression profiles in supernatants of the WT and Δrng strains by SDS-PAGE (S3 Fig) and the major protein bands between 30 to 90 kDa by tandem mass spectrometry. The two strains displayed overall similar growth rates and protein secretion levels during cultivation in Luria-Bertani (LB) medium with aeration (S3A Fig) except that the WT strain was able to secrete higher levels of the T3SS effector proteins SipA and SipC during early-stationary (or late-exponential) growth phase (9 h incubation), compared to the Δrng strain (Figs 2 and S3B). The mass spectrometry results showed that the secretion of SlrP and SopA was also higher in the WT than in the Δrng strain (Table 1). We also observed that the secretion levels of several cytoplasmic proteins (FusA, GlpK, LpdA, PflB, and Pta) in the WT strain were relatively lower compared to the major T3SS effector proteins (Table 1). Further studies are needed to explain this phenomenon and, in this study, we focused on the change of SPI-related genes expression to understand the effects of RNase G levels on the pathogenicity of S. Typhimurium.
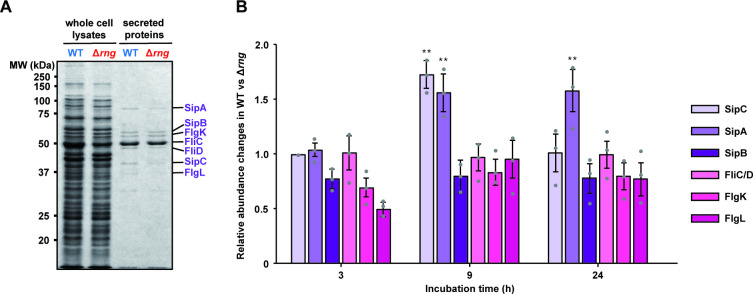
Differentially expressed proteins in WT and Δrng strains.
(A) SDS-PAGE analysis of T3SS effector proteins and flagellar proteins in the whole-cell lysates and concentrated supernatants of S. Typhimurium strains (WT and Δrng). Seven specific protein bands (SipA, SipB, FlgK, FliC, FliD, SipC, and FlgL denoted on the right of the gel) were identified by in-gel digestion and tandem mass spectrometry, as described in the Materials and Methods. (B) The relative abundance of T3SS effector proteins and flagellar proteins determined from the protein expression profiles in the supernatants of WT and Δrng strains, as described in S3 Fig. Relative abundance of these proteins was measured by densitometric analysis of the band intensities of these proteins. For this analysis, the relative abundance of FliC/FliD proteins was set to 1. Statistically significant differences in relative SipA and SipC levels between WT and Δrng cells were compared to the FliC/FliD levels by two-tailed t-tests. ** P < 0.01.

| Accession No. | Description (protein name) | Protein | Molecular | PSM No. | NASF | Fold | ||
|---|---|---|---|---|---|---|---|---|
| length (a. a) | Mass (kDa) | WT | Δrng | WT | Δrng | WT/Δrng | ||
| CBW16874.1 | T3SS effector protein (SlrP) | 765 | 86.8 | 8 | 4 | 0.003 | 0.002 | 1.776 |
| CBW18139.1 | T3SS effector protein (SopA) | 782 | 86.7 | 14 | 7 | 0.005 | 0.003 | 1.776 |
| CBW17217.1 | Flagellar hook-associated protein 3 (FlgL) | 317 | 34.2 | 3 | 2 | 0.003 | 0.002 | 1.332 |
| CBW16256.1 | Dihydrolipoamide acetyltransferase component E2 (AceF) | 629 | 66.0 | 7 | 5 | 0.003 | 0.003 | 1.243 |
| CBW17984.1 | Flagellar hook associated protein (FliD) | 467 | 49.8 | 208 | 152 | 0.128 | 0.106 | 1.215 |
| CBW18959.1 | SPI-1 T3SS effector protein (SipA) | 685 | 73.9 | 602 | 458 | 0.253 | 0.217 | 1.167 |
| CBW18961.1 | SPI-1 T3SS effector protein (SipC) | 409 | 43.0 | 6 | 5 | 0.004 | 0.004 | 1.066 |
| CBW18855.1 | Flagellin (FljB) | 506 | 52.5 | 388 | 356 | 0.221 | 0.229 | 0.968 |
| CBW17983.1 | Flagellin (FliC) | 495 | 51.6 | 605 | 565 | 0.353 | 0.371 | 0.951 |
| CBW18962.1 | SPI-1 T3SS effector protein (SipB) | 593 | 62.4 | 10 | 10 | 0.005 | 0.005 | 0.888 |
| CBW17216.1 | Flagellar hook-associated protein 1 (FlgK) | 553 | 59.1 | 5 | 5 | 0.003 | 0.003 | 0.888 |
| CBW19351.1 | Polynucleotide phosphorylase (Pnp) | 711 | 77.0 | 8 | 10 | 0.003 | 0.005 | 0.710 |
| CBW19923.1 | ATP synthase beta subunit (AtpD) | 460 | 50.3 | 4 | 5 | 0.003 | 0.004 | 0.710 |
| CBW19508.1 | Elongation factor G (FusA) | 704 | 77.6 | 5 | 9 | 0.002 | 0.004 | 0.493 |
| CBW20124.1 | Glycerol kinase (GlpK) | 502 | 56.0 | 7 | 13 | 0.004 | 0.008 | 0.478 |
| CBW16257.1 | Dihydrolipoamide dehydrogenase (LpdA) | 474 | 50.6 | 5 | 10 | 0.003 | 0.007 | 0.444 |
| CBW17006.1 | Formate acetyltransferase 1 (PflB) | 760 | 85.0 | 4 | 13 | 0.002 | 0.006 | 0.273 |
| CBW18409.1 | Phosphate acetyltransferase (Pta) | 714 | 77.2 | 2 | 9 | 0.001 | 0.004 | 0.197 |
N.b. Mass spectrometric data combines all the gel slices obtained from the supernatants of WT and Δrng S. Typhimurium at different cultivation times of 3 h, 9 h, 24 h, and 48 h, as shown in S3 Fig. PSM (peptide spectrum match) numbers and NSAF (normalized spectral abundance factor) of each protein identified by filtering the tandem mass spectrometric data with two or more unique peptides are shown in S1 and S2 Tables.
SPI-1 T3SS induction in aerobically grown late-exponential phase Salmonella is known to export effector proteins into the medium or host cells that are necessary for invasion, stimulating inflammation, and virulence [48,49]. During Salmonella pathogenesis, increased SipA and SipC secretion in the supernatant of WT cells can aid invasion by facilitating the trafficking of the mammalian tetraspanning membrane protein PERP at the apical surface of host cells [50] and remodelling its actin cytoskeleton [51]. The two strains displayed no significant changes in normalized spectral abundance factors (NSAFs) or flagellar proteins, such as FlgK, FlgL, FljB, FliC, and FliD. Similar results have been reported for salt-activated expression in the Salmonella T3SS without altering flagellar protein secretion by increasing the transcription of hilA, hilC, and hilD [52]. Together, our findings suggest that WT S. Typhimurium can secrete more SPI-1 T3SS effector proteins than the Δrng strain.
RNase G is a bacterial endoribonuclease known to negatively regulate gene expression via mRNA decay [9,15–17]; however, SDS-PAGE and mass spectrometry revealed that some SPI-1 T3SS effectors (SlrP, SopA, SipA, and SipC) were up-regulated in the WT strain compared to that in the Δrng strain, indicating that changes in their mRNA levels were not a direct consequence of mRNA decay by RNase G. To assess this further, we analyzed upstream pathways to identify a SPI-1 T3SS repressor that can be negatively regulated by RNase G. When S. Typhimurium invades host cells or responds to elevated sucrose or salt concentrations, SPI-1 T3SS effector gene expression is activated by the major transcriptional activator HilA, which is generally repressed by H-NS [31,35,52]. To explore the relationships between sipA, sipC, hilA, and hns mRNA expression levels, real-time reverse transcription polymerase chain reaction (qRT-PCR) was performed using total RNA from WT cells cultured under aerobic and anaerobic conditions, since SPI-1 T3SS expression is known to be up-regulated during Salmonella growth under low oxygen conditions and during host cell infection [27,53]. Expression levels of sipA, sipC, hilA, and hns gene changed dynamically in WT S. Typhimurium cells in response to anaerobic conditions. Steady-state sipA, sipC, and hilA mRNA expression increased by approximately 1.6-, 1.7-, and 1.9-fold, respectively, compared to cells grown under aerobic conditions, whereas hns mRNA abundance decreased by ~ 40% under anaerobic conditions (Fig 3A). In addition, the relative abundance of rng mRNA increased by ~ 2.8-fold under anaerobic conditions (Fig 3A). Changes in RNase G, H-NS, and SipC protein levels following changes in oxygen availability correlated with their mRNA abundance (Fig 3B), indicating that RNase G is associated with the positive and negative regulation of SPI-1-related gene expression by HilA and H-NS, respectively.
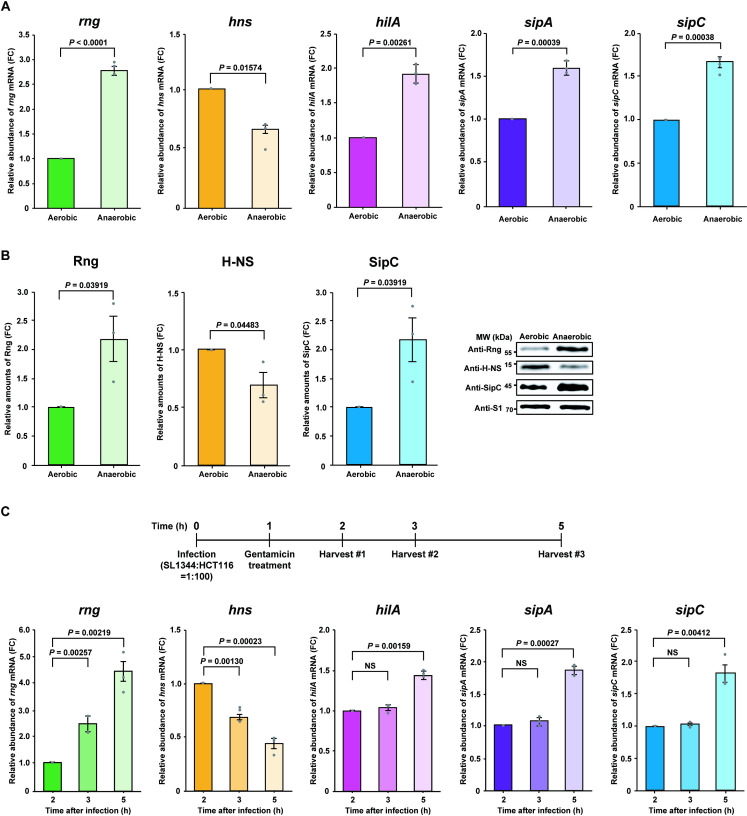
Effect of RNase G on SPI-1 T3SS.
(A) Analysis of rng, hns, and SPI-1-related gene (hilA, sipA, and sipC) mRNA expression in WT S. Typhimurium under aerobic and anaerobic conditions by qRT-PCR. Expression levels of rng, hns, hilA, sipA, and sipC mRNA under aerobic conditions were set to 1. (B) Western blot analysis of Rng, H-NS, and SipC in the S. Typhimurium cultures used in (A). WT Rng, H-NS, and SipC levels under aerobic conditions were set to 1. Ribosomal protein S1 was used as an internal standard. (C) Analysis of rng, hns, and SPI-1-related gene (hilA, sipA, and sipC) mRNA expression in the infection stage by qRT-PCR. HCT116 cells were infected with WT S. Typhimurium at a multiplicity of infection (MOI) of 100. rng, hns, hilA, sipA, and sipC mRNA expression levels at 2 h after infection were set at 1. For (A) and (C), rng, hns, hilA, sipA, and sipC mRNA expression levels were normalized to ribE mRNA and gene expression was quantified using the ΔΔCt method. For (A), (B), and (C), data represent the mean ± s. e. m. of three independent experiments. Statistically significant values from two-sided unpaired Student’s t-tests are indicated. NS; not significant.
Next, we investigated the association between the expression of RNase G and that of virulence factors in WT S. Typhimurium cells infecting epithelial cells. The differential expression of SPI-1-associated genes was monitored by qRT-PCR in total RNA samples from WT S. Typhimurium cells 2, 3, and 5 h after epithelial cell infection. The relative abundance of sipA, sipC, hilA, and rng mRNA gradually increased as hns mRNA levels decreased during infection (Fig 3C); therefore, we hypothesized that increased RNase G levels downregulate hns transcript expression in S. Typhimurium infecting host cells or under anaerobic conditions, thus enhancing SPI-1 T3SS gene expression.
To determine whether hns mRNA abundance is directly regulated by RNase G, we determined the decay rate of hns mRNA in WT, Δrng, and Δrngcomp strains under anaerobic conditions. Northern blot analysis revealed that the half-life of hns mRNA was ~ 2.6-fold higher in Δrng cells than in WT cells (7.6 min vs. 3.0 min; Fig 4A), whereas the Δrngcomp strain rapidly degraded hns mRNA with a half-life of 1.7 min. These experimental results suggest that hns mRNA stability is greatly influenced by RNase G levels.
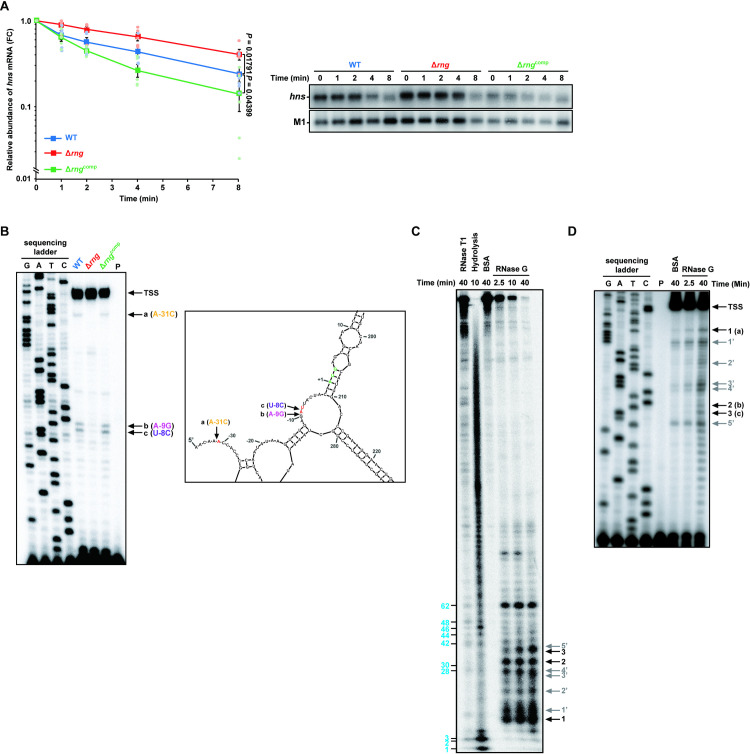
Down-regulation of hns mRNA abundance by RNase G.
(A) Effect of cellular RNase G on hns mRNA decay in S. Typhimurium strains (WT, Δrng, and Δrngcomp) grown under anaerobic conditions, as measured by northern blot analysis. Data represent the mean ± s. e. m. of three independent experiments and presented on a semi-logarithmic plot. Statistically significant values from two-sided unpaired Student’s t-tests are indicated. (B) Primer extension analysis of hns mRNA 5′ UTR in vivo. Left: Total RNA samples isolated from the S. Typhimurium cultures used in (A) were analyzed. Sequencing ladders were synthesized with the same primer used in cDNA synthesis and PCR DNA encompassing the hns gene as a template. Right: The secondary structure of the 5′ UTR of hns mRNA deduced from the M-Fold program. Arrows indicate RNase G cleavage sites. The start codon is indicated by bold, green characters. TSS; transcription start site. (C) In vitro cleavage of hns mRNA. RNase T1 cleavage products are indicated by blue bold characters. Black arrows indicate the cleavage sites identified in (B) (1, 2, and 3). (D) Primer extension analysis of the in vitro-cleaved hns mRNA products purified from (C). Black arrows indicate the cleavage sites identified in (B) and (C) (1 = a, 2 = b, and 3 = c). For (C) and (D), grey arrows indicate (1′-5′) nonspecific RNase G cleavage sites.
Since RNase E/G family proteins are known to influence mRNA half-life by cleaving the 5′ untranslated region (UTR) of most biochemically characterised mRNA substrates [15–17,54], we performed primer extension analysis to identify the exact RNase G cleavage sites in the 5′ UTR of hns mRNA. Total RNA extracted from the WT, Δrng, and Δrngcomp strains cultivated under anaerobic conditions was used to synthesise cDNA, which formed three bands (a, b, and c) distinct from those in WT and Δrngcomp cells (Fig 4B, left panel) and corresponded to sites in the 5′ UTR of hns mRNA (Fig 4B, right panel). When the full-length hns mRNA sequence (450 nucleotides) was analyzed using the M-Fold program (http://unafold.rna.albany.edu) [55], we observed the unique secondary structure of hns 5′ UTR, in which the identified RNase G cleavage sites, are in single-stranded regions, in six thermodynamically stable structures of 16 secondary structures. The analysis indicated two cleavage sites (b and c) in the putative Shine-Dalgarno sequence and another (a) in a region close to the transcriptional start site.
To demonstrate biochemically enzymatic cleavage of hns mRNA by RNase G, we carried out an in vitro cleavage assay using purified S. Typhimurium RNase G protein and synthetic RNA containing the full-length hns sequence. In vitro RNase G cleavage of the 5′-32P-end-labeled synthetic hns mRNA generated three major cleavage products (bands 1, 2, and 3 in Fig 4C) whose size corresponded to the cleavage sites detected by primer extension analysis (Fig 4D). We also observed RNase G-dependent cleavage products (1′-5′) that were not detected by primer extension analysis (Fig 4C and 4D). These products may be due to non-specific RNase G cleavage activity against the synthetic hns transcript in vitro, as noted for other substrates [16,17]. Nonetheless, these results provide experimental evidence that RNase G can cleave specific sites in the 5′ UTR of hns mRNA, possibly affecting hns mRNA stability.
Although RNase G is known to preferentially cleave single-stranded, AU-rich sequences [11,13,14], the structural RNA determinants of RNase G cleavage activity have not yet been characterised. To examine whether RNase G cleavage is responsible for hns mRNA degradation, we introduced nucleotide substitutions at positions A-31, A-9, or U-8 in the hns 5′ UTR (A of the start codon defined as +1). This was then introduced into an hns::cat fusion construct to produce a reporter system expressing the 5′ UTR of hns mRNA fused to the chloramphenicol acetyl transferase (cat) coding region, with nucleotide substitutions from A to C at position -31 (A-31C), A to G at position -9 (A-9G), or U to C at position -8 (U-8C). These nucleotide substitutions were chosen to avoid AU-rich sequences which are known to be a property of RNase G cleavage sites. The fusion gene was constitutively expressed from a mutant tryptophan promoter (trpc) in a multi-copy plasmid in WT cells to measure CAT expression levels. Western blot analysis revealed that WT cells expressing the hns::cat fusion mRNAs with nucleotide substitutions at RNase G cleavage sites produced ~ 1.8- to 8.2-fold more CAT protein than those expressing WT hns::cat fusion mRNA (S4A Fig). The increased CAT protein levels produced by mutant hns::cat mRNAs was attributed to stabilisation of the fusion mRNA in the WT strain, as indicated by a strong correlation between CAT levels and the half-lives of the mutant fusion mRNAs (A-31C, A-9G, and U-8C: 7.9, 2.5, and 6.6 min, respectively, WT: 2.0 min; S4B Fig).
To further investigate the effects of RNase G cleavage site alterations on S. Typhimurium virulence, we introduced the same nucleotide substitutions into the hns gene 5′ UTR in the S. Typhimurium genome using a CRISPR-Cas9 system [17,56] (S5 Fig) and measured H-NS levels in the mutant strains. Western blot analysis revealed that the mutant strains expressing hns mRNA containing A-31C (hns A-31C) or U-8C (hns U-8C) showed ~ 3.6- or 4.8-fold higher production of the H-NS protein, respectively, than that showed by WT cells expressing WT hns mRNA (Fig 5A). However, H-NS protein levels did not significantly change in the mutant strain expressing hns mRNA containing A-9G (hns A-9G; Fig 5A).
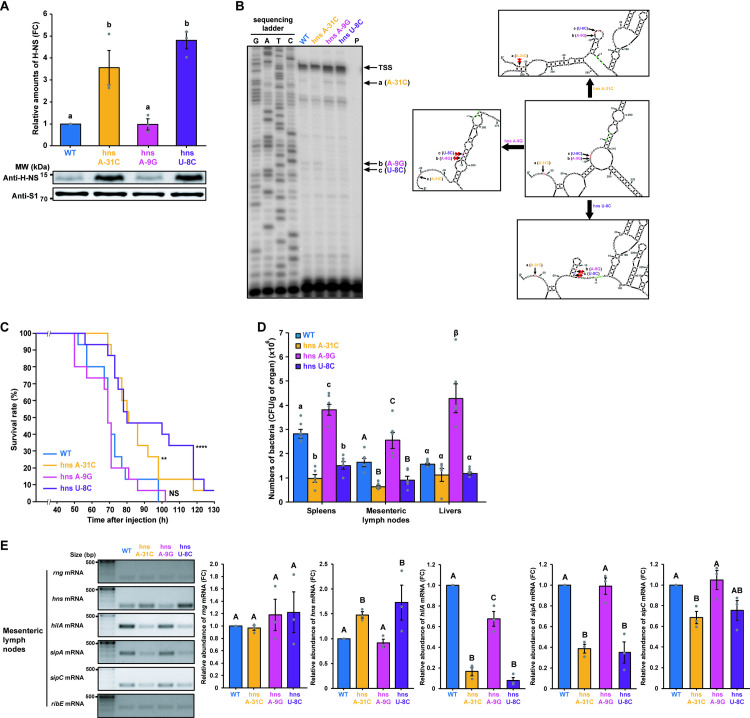
Effects of nucleotide substitutions in the RNase G cleavage sites of the hns mRNA 5′ UTR on hns expression.
(A) Western blot analysis of H-NS in S. Typhimurium strains (WT, hns A-31C, hns A-9G, and hns U-8C). WT H-NS levels were set to 1. Ribosomal protein S1 was used as an internal standard. (B) Primer extension analysis of hns mRNA 5′ UTR containing the wild-type or mutated sequence (hns A-31C, hns A-9G, or hns U-8C) in vivo. Left: Total RNA samples isolated from the S. Typhimurium cultures used in (A) were analyzed. Sequencing ladders were synthesized with the same primer used in cDNA synthesis and PCR DNA encompassing the hns gene as a template. Right: The secondary structure of the full-length hns sequence containing the wild-type or mutated sequence (hns A-31C, hns A-9G, or hns U-8C) was deduced using the M-Fold program. Representative structures of the 5′ UTR that most frequently occur when the mutated sequences are used to deduce the secondary structure of full-length hns mRNA. Arrows indicate RNase G cleavage sites. Start codon is indicated by bold, green characters. TSS; transcription start site. (C) Survival rates and duration of BALB/c mice (n = 15 per group) infected with S. Typhimurium. strains (WT, hns A-31C, hns A-9G, and hns U-8C). Survival was monitored for 7 days. ** P < 0.01 and **** P < 0.0001 for hns A-31C-, hns A-9G-, or hns U-8C-infected mice vs. WT-infected mice (two-sided unpaired Student’s t-test). (D) Colonization assay for S. Typhimurium. BALB/c mice (n = 5 per group) intraperitoneally infected with S. Typhimurium strains (WT, hns A-31C, hns A-9G, and hns U-8C). Data represent the mean ± s. e. m. of at least three independent experiments. Statistically significant differences from one-way ANOVA with Student-Newman-Keuls test (P < 0.0001) are indicated by different letters: small letters indicate differences from spleens; large letters indicate differences from mesenteric lymph nodes; Greek symbols indicate differences from livers. (E) Characterisation of hns and SPI-1-related gene (hilA, sipA, and sipC) mRNA expression levels in the mesenteric lymph nodes of S. Typhimurium (WT, hns A-31C, hns A-9G, and hns U-8C)-infected mice (n = 3 per group). The relative mRNA abundance of hns and SPI-1-related genes is shown on the right side of the gel images. hns and SPI-1-related gene expression levels were normalized to ribE mRNA. Data represent the mean ± s. e. m. of at least three independent experiments. Statistically significant differences from one-way ANOVA with Student-Newman-Keuls tests are indicated by different letters. P < 0.05 for hns and sipC mRNA and P < 0.0001 for hilA and sipA mRNA.
To analyze the in vitro RNase G reactivity of the hns mRNA carrying the 5′ UTR mutations, we carried out an in vitro cleavage assay using purified S. Typhimurium RNase G protein and synthetic full-length hns transcripts containing the WT or the mutated sequences (hns A-31C, hns A-9G, or hns U-8C) (S6A Fig). We observed that the amounts of cleavage products generated at site (1) were markedly diminished when the hns A-31C mutant transcript was used. However, the accumulation of cleavage products at site (2) was increased compared to that from the WT transcript (S6A Fig). The rate of accumulation of cleavage products at site (1) when the hns A-9G mutant transcript was used was similar to that when WT transcript was used, whereas the amounts of the cleavage products at sites (2) and (3) decreased compared to those from the WT transcript (S6A Fig). For the hns U-8C mutant transcript, cleavage product accumulation at sites (1) and (2) was similar to that for the WT transcript, whereas the accumulation of cleavage products at sites (3) was increased compared to that from the WT transcript (S6A Fig). Higher levels of uncleaved full-length transcripts were observed for the hns U-8C mutant transcript than those from other transcripts (S6B Fig). The results from in vitro cleavage of hns U-8C mutant transcript was not consistent with experimental results showing increased half-life of hns mRNA and H-NS expression levels when the U-8C mutation was introduced (Figs 5A and S4A Fig). We believe that this difference resulted from alterations of secondary structures of the hns 5′ UTR due to the incorporation of three G residues at the 5′-terminus of synthetic hns transcripts. These residues were incorporated because of the intrinsic property of T7 RNA polymerase used for the synthesis of synthetic hns transcripts (S6C Fig). When the secondary structures of synthetic hns transcripts were analyzed using the M-Fold program, the introduction of nucleotide substitution at the nucleotide A-31 (A-31C) resulted in the formation of a stem-loop that buried the cleavage site (1) in the region. We observed a similar result when the A-9G mutation is introduced (S6C Fig). Unlike these mutations, the U-8C mutation resulted in forming an open bulge in the region (S6C Fig). These results suggest that the introduction of nucleotide substitution in the hns transcript as well as addition of three G residues at the 5′-terminus resulted in alterations in the secondary structure of the hns 5′ UTR, leading to changes in RNase G reactivity on these synthetic transcripts.
We further investigated RNase G cleavage reactivity on hns mutant mRNA by performing primer extension analysis on total RNA from S. Typhimurium cells expressing WT or mutant hns mRNAs. The A-31C mutation resulted in diminished RNase G cleavage reactivity at site (a), whereas A-9G and U-8C mutations reduced RNase G cleavage reactivity at both sites (b and c) (Fig 5B, left panel). RNase G cleavage activity on the hns U-8C mRNA appeared to be different when analyzed in vivo using primer extension analysis compared to that analyzed in vitro (S6A Fig). When the secondary structures of hns mRNA 5′ UTR without three additional G residues were analyzed using the M-Fold program, all mutations lead to the formation of a stem-loops containing the corresponding cleavage site with high frequency (Fig 5B, right panel). We speculate that different secondary structures of the hns mRNA 5′ UTR can be formed because of three additional G residues at the 5′-terminus of synthetic transcripts, resulting in altered RNase G reactivity at cleavage sites in hns mRNA. Nonetheless, the effects of RNase G cleavage site mutations on the half-life of hns mRNA and expression of H-NS can be explained by altered RNase G reactivity on hns mRNA by the mutations in vivo.
When the pathogenicity of these mutant strains was tested in a mouse model, higher survival rates were observed in mice infected with hns A-31C or hns U-8C strains than the WT or hns A-9G (Fig 5C). In addition, the number of bacterial cells in several organs from the infected mice correlated with the virulence of the mutant strains in the mouse model (Fig 5D). Furthermore, hns expression was inversely correlated with the mRNA abundance of SPI-1-related genes in the spleens, livers, and mesenteric lymph nodes of mice infected with the mutant strains (Figs 5E and S7). Thus, these findings indicate that changes in hns mRNA stability due to alterations in RNase G cleavage activity in its 5′ UTR is a direct cause of changes in S. Typhimurium virulence.
Although we revealed that increased RNase G levels contributes toward the down-regulation of hns expression in the host environment, it remains unclear how rng expression is up-regulated under these conditions. Previously, we showed that rng mRNA abundance is down-regulated by RNase III in E. coli [19]; therefore, we examined whether RNase III regulates RNase G by measuring its levels in WT and rnc-deleted (Δrnc; SL1344rnc + pACYC177) strains. RNase G protein levels were ~ 68% higher in the Δrnc strain than in the WT, whereas H-NS levels were ~ 49% lower in the Δrnc strain (Fig 6A).
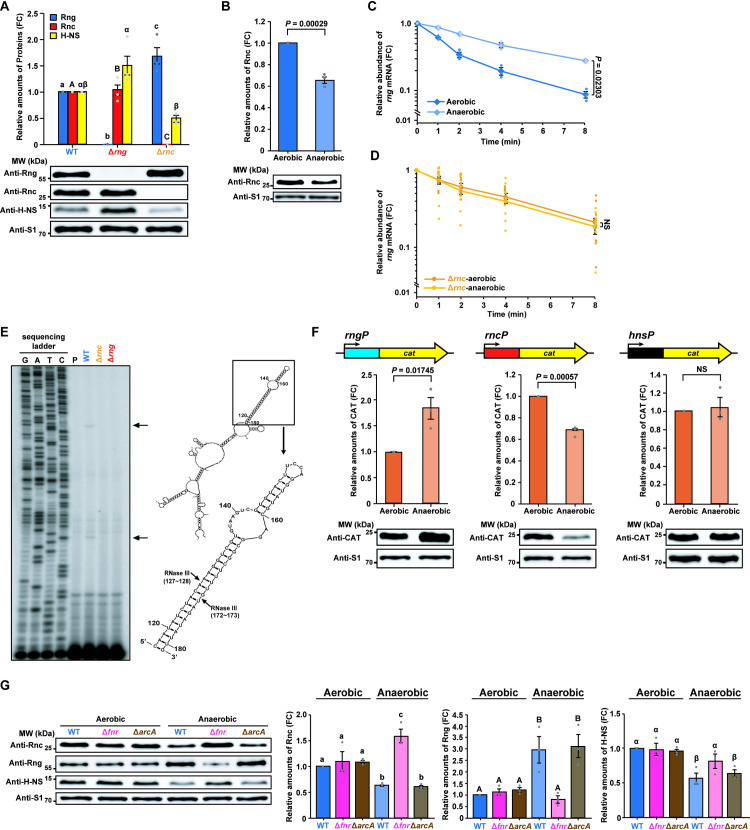
Increased RNase III activity down-regulates RNase G expression.
(A) Western blot analysis of Rng, Rnc, and H-NS in S. Typhimurium strains (WT, Δrng, and Δrnc). WT Rng, Rnc, and H-NS levels were set to 1. (B) Western blot analysis of Rnc levels in WT S. Typhimurium under aerobic and anaerobic conditions. Rnc levels under aerobic conditions were set to 1. (C) Effects of oxygen on rng mRNA stability in the S. Typhimurium cultures used in (B) measured by qRT-PCR. (D) Effects of oxygen on rng mRNA stability in S. Typhimurium Δrnc cells measured by qRT-PCR. NS; not significant. (E) Identification of RNase III cleavage sites in rng mRNA in vivo. Left: Primer extension analysis of total RNA from S. Typhimurium strains (WT, Δrnc, and Δrng). Black arrows indicate RNase III cleavage sites. Right: rng mRNA secondary structure was deduced using the M-Fold program. Black arrows indicate RNase III cleavage sites in rng mRNA identified by primer extension analysis. (F) Effects of oxygen on rng, rnc, and hns gene promoter activity in WT S. Typhimurium. Top: DNA fragments containing rng, rnc, or hns promoters cloned in-frame with the cat gene CDS into pCAT924. Bottom: Western blot analysis of CAT in WT S. Typhimurium harbouring rngP::cat, rncP::cat or hnsP::cat fusion constructs. WT CAT levels under aerobic conditions were set to 1. (G) Western blot analysis of Rnc, Rng, and H-NS to determine the effects of FNR and ArcA on S. Typhimurium strains (WT, Δfnr, and ΔarcA) under aerobic and anaerobic conditions. WT Rnc, Rng, and H-NS levels under aerobic conditions were set to 1. For (A), data represent the mean ± s. e. m. of at least three independent experiments. Statistically significant differences from one-way ANOVA with Student-Newman-Keuls test (P < 0.001 for Rng, P < 0.0001 for Rnc, and P < 0.05 for H-NS) are indicated by different letters: small letters indicate differences in Rng levels; capital letters indicate differences in Rnc levels; Greek symbols indicate differences in H-NS levels. For (B) and (F), data represent the mean ± s. e. m. of three independent experiments. Statistically significant values from two-sided unpaired Student’s t-tests are indicated. For (C) and (D), rng mRNA expression was normalized using 16S rRNA, and gene expression was quantified using the ΔΔCt method and represented on a semi-logarithmic plot. Data represent the mean ± s. e. m. of three or ten independent experiments. Statistically significant values from two-sided unpaired Student’s t-tests are indicated. For (G), data represent the mean ± s. e. m. of at least three independent experiments. Statistically significant differences from one-way ANOVA with Student-Newman-Keuls test (P < 0.0001 for Rng, P < 0.001 for Rnc and H-NS) are indicated by different letters: small letters indicate differences in Rnc levels; large letters indicate differences in Rng levels; Greek symbols indicate differences in H-NS levels. For (A), (B), (F), and (G), ribosomal protein S1 was used as an internal standard.
When RNase III levels were measured in WT cells grown in the presence and absence of oxygen, it was found to be ~ 35% lower under anaerobic conditions than under aerobic conditions (Fig 6B). The increase in RNase G levels observed under anaerobic conditions (Fig 3B) was attributed to changes in the half-life of rng mRNA, which was around 2.5-fold higher in WT cells under anaerobic conditions (3.9 min) than under aerobic conditions (1.6 min; Fig 6C). We compared the rng transcript lifetime under anaerobic and aerobic conditions in cells lacking RNase III using qRT-PCR. We observed no significant changes in half-lives of rng mRNA when rnc-deleted cells were grown under aerobic or anaerobic conditions (Fig 6D). These results indicate that RNase III determines rng mRNA stability. Primer extension analysis of rng mRNA under aerobic conditions identified two cDNA bands generated in WT cells but not Δrnc or Δrng cells. These bands corresponded to sites in the double stranded regions of the secondary structure of rng mRNA (Fig 6E) and were very similar to those identified in E. coli rng mRNA [19]. Taken together, these results indicate that RNase III post-transcriptionally regulates RNase G expression depending on oxygen availability.
Since RNase G levels were only ~ 68% higher in the Δrnc strain than in the WT strain (Fig 6A), the down-regulation of its expression by RNase III is unlikely to be wholly responsible for the three-fold increase in RNase G levels observed under anaerobic conditions (Fig 3B). Therefore, we tested whether oxygen availability affected rng promoter (rngP) activity using a reporter construct expressing cat under the control of the S. Typhimurium rngP. CAT levels were induced in WT cells grown under anaerobic conditions (Fig 6F, left panel), indicating that increased RNase G levels are also attributable to rngP induction under anaerobic conditions. Moreover, the promoter activity of the rnc gene (rncP) was found to be down-regulated under anaerobic conditions when measured using a cat construct fused to rncP (Fig 6F, middle panel), suggesting an additional molecular basis for the down-regulation of RNase III levels under anaerobic conditions (Fig 6B). However, hns promoter (hnsP) activity did not significantly change under anaerobic conditions when tested using a similar reporter construct expressing cat under the control of the S. Typhimurium hnsP (Fig 6F, right panel).
To understand the basis for the oxygen-dependent promoter activities of the rnc, rng, and hns genes, we analyzed their respective promoter sequence regions in S. Typhimurium. Bioinformatics analysis of these promoters (online database Prodoric) [57] indicated the existence of sequences similar to the binding sequences of the oxygen-sensitive transcription factors, fumarate nitrate reductase (FNR) and aerobic respiratory control (ArcA), in the rnc and rng genes (S8 Fig). Sequences similar to the binding sequences of FNR and ArcA were not identified in the hns gene (S8 Fig). This complex regulatory system has been well characterised in S. Typhimurium, wherein the DNA-binding proteins FNR and ArcA sense changes in oxygen availability and control the expression of many genes either alone or in cooperation with other regulators [58–61]. In strains that did not express FNR (Δfnr) or ArcA (ΔarcA), RNase III levels increased by 2.5-fold in the Δfnr strain but did not significantly change in the ΔarcA strain compared to the WT strain (Fig 6G). Conversely, the rng promoter was repressed, leading to a 3.7-fold reduction in RNase G expression in the Δfnr strain compared to the WT strain, whereas RNase G levels did not significantly differ between the ΔarcA and WT strains (Fig 6G). The simultaneous up-regulation of RNase III and down-regulation of RNase G expression at the transcriptional level in anaerobically grown Δfnr cells produced H-NS expression levels comparable to those in WT cells grown under anaerobic conditions (Fig 6G). Furthermore, fnr or arcA deletion did not significantly affect RNase III, RNase G, or H-NS levels under aerobic conditions (Fig 6G). Together, these findings indicate that FNR negatively and positively regulates RNase III and RNase G expression, respectively, at the transcriptional level under anaerobic conditions.
The expression of S. Typhimurium virulence genes is known to be regulated by changes in environmental conditions [23,25]. The SPI-1 T3SS is considered essential for the invasion of the host intestinal epithelium by Salmonella and its transcription is regulated by a variety of global regulatory systems that converge on HilA expression via a complex feed-forward loop in which H-NS acts as a repressor [21]. This study highlights an endoribonuclease-mediated mechanism that regulates H-NS expression as an additional layer upstream of this loop. We observed that hns mRNA abundance decreased in S. Typhimurium in the host environment, with reduced oxygen availability repressing rnc gene promoter activity via FNR. This then decreased the activity of RNase III against rng mRNA, resulting in the rapid degradation of hns mRNA by RNase G. Consequently, decreased H-NS levels derepressed the genes involved in the SPI-1 T3SS (Fig 7). It is unlikely that changes in S. Typhimurium pathogenicity by RNase G levels, especially in the host environment, resulted from RNase G cleavage activity on other RNA substrates. Our experimental results showing that hns expression levels by genomic alterations in the RNase G cleavage sites in the 5′ UTR of hns are inversely correlated with S. Typhimurium virulence strongly support that this endoribonuclease-mediated regulation of hns mRNA abundance largely contributes to changes in S. Typhimurium virulence in the host environment.
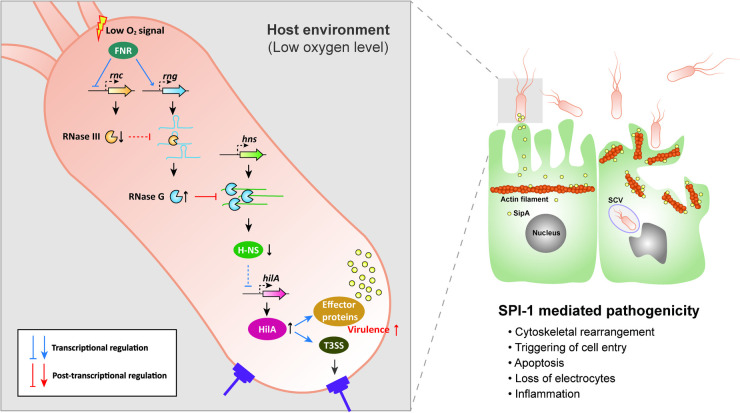
Model for the adaptive pathogenicity of S. Typhimurium to the host environment via the sequential modulation of RNase III and RNase G endoribonucleolytic activity.
Host environmental signals triggered by the exposure of S. Typhimurium to low oxygen (anaerobic) conditions activate the regulation of the oxygen sensing regulator, FNR. FNR reduces RNase III levels by inhibiting rnc gene expression and promotes rng mRNA by activating rng gene expression, leading to increased cellular RNase G levels. RNase G induction accelerates the degradation of the hns mRNA 5′ UTR, thus downregulating hns mRNA levels. H-NS usually represses hilA gene expression; however, decreased cellular H-NS levels appear to activate the hilA promoter. HilA activates SPI-1 T3SS genes and induces the encoded effector proteins. These virulence cascades increase the invasiveness of S. Typhimurium to result in pathogenic S. Typhimurium infection.
The cellular levels of both RNase E and G are controlled post-transcriptionally via endoribonucleolytic cleavage of mRNAs encoding these enzymes in E. coli [19,62]. In addition, the activity of RNase E is regulated by protein inhibitors while such factors have not been identified for RNase G [63–65]. These findings indicate the importance of modulation of these endoribonucleases expression and activity in bacterial cellular physiology. In fact, for S. Typhimurium, mutations in RNase E and RNase III led to changes in pathogenicity that include attenuated virulence, impaired mobility, and reduced proliferation in the host environments [37]. However, these changes may well stem from pleiotropic effects driven by these mutant endoribonucleases, since RNase E and RNase III expression is known to affect the abundance of a large portion of mRNA species in E. coli [8–10,66].
A regulatory pathway involving RNase G and RNase III has been identified in E. coli in which incomplete 16S rRNA processing by RNase G is down-regulated by increased RNase III activity (not the protein level) under aminoglycoside antibiotics stress [19]. A recent study reported that enolase expression is regulated by the coordinated action of RNase III and RNase G in response to oxygen availability in E. coli [16]. However, it remains unclear how RNase III activity and expression are regulated in E. coli in response to different environmental changes [16,19,66]. We found that RNase III expression was negatively regulated by the oxygen sensing regulator, FNR, in S. Typhimurium cells grown anaerobically, whereas RNase G expression was enhanced. Together, our findings suggest how FNR can act as a global regulator of virulence in S. Typhimurium [61]. The key roles of FNR and its homologues in the virulence of some pathogens (i.e., Neisseria meningitides [67] and Pseudomonas aeruginosa [68]) have already been reported; however, future studies should investigate whether other pathogenic bacteria with FNR-associated virulence also adopt post-transcriptional regulatory pathways involving the modulation of endoribonuclease activity to rapidly respond to host environments.
All animal experiments were performed in accordance with the national guidelines for the use of animals in scientific research and were approved by Chung-Ang University Support Center (Approval No. CAU2012-0044).
Mouse feeding and experimental procedures were performed as described previously [69,70]. Pathogen-free 6-week-old female BALB/c mice (survival assay: n = 10 or 15 per group, colonization assay: n = 5 per group, immune response assay: n = 5 per group, and RT-PCR analysis of organs: n = 3 per group) were purchased from Orient Bio.
S. Typhimurium and E. coli strains were grown at 37°C in LB medium supplemented with ampicillin (100 μg ml-1), tetracycline (5 μg ml-1), or chloramphenicol (5 μg ml-1), where appropriate, at 37°C under aerobic or anaerobic conditions. For anaerobic growth, E. coli cells were added to a 30 ml cylindrical bottle containing a sterilised stir bar and filled with LB medium containing ampicillin (100 μg ml-1), sealed with tape, and cultured on a magnetic stirrer [16].
The bacterial strains, plasmids, and primers used in this study are listed in S3 and S4 Tables. The Δrng strain was constructed as described previously [19]. The Δrnc, Δfnr, and ΔarcA strains were constructed via one-step chromosomal gene inactivation using the method described by Datsenko and Wanner [71]. The Δrnc strain was constructed by amplifying the tetracycline resistance marker in E. coli strain HT115. Replacement of the resistance marker with the rnc gene was confirmed by PCR amplification of the chromosomal region encompassing the rnc locus. The Δfnr and ΔarcA strains were constructed by amplifying the chloramphenicol resistance marker in pKD3 [71]. Replacement of the resistance marker with the fnr or arcA gene was confirmed by PCR amplification of the chromosomal regions encompassing the fnr or arcA loci.
Genomic DNA from the S. Typhimurium SL1344 strain was used as a template for cloning. pSt-rng was constructed by amplifying the coding region of S. Typhimurium rng, which was digested with XhoI and BamHI and ligated into pACYC177. The pSt-rng-His plasmid was inserted with a hexahistidine affinity tag before the rng stop codon. The pSt-hns (WT)-cat, pSt-hns (A-31C)-cat, pSt-hns (A-9G)-cat, and pSt-hns (U-8C)-cat plasmids expressing St-hns (WT)::cat, St-hns (A-31C)::cat, St-hns (A-9G)::cat, and St-hns (U-8C)::cat, respectively, were constructed via multiple steps. To construct pSt-hns (WT)-cat, pSt-hns (A-31C)-cat, pSt-hns (A-9G)-cat, and pSt-hns (U-8C)-cat, NotI and NcoI sites were created using the overlap-extension PCR method. The PCR product was digested with NotI and NcoI and cloned into pCAT924 [66]. pSt-rngP-cat, pSt-rncP-cat, and pSt-hnsP-cat plasmids expressing cat under the control of the S. Typhimurium rng, rnc, or hns promoters, respectively, were constructed using the overlap-extension PCR method. PCR products were digested using NotI and NcoI and cloned into pCAT924.
The hns A-31C, hns A-9G, and hns U-8C strains were constructed using a CRISPR-Cas9 system. The pCas and pTargetF plasmids were both available via the non-profit plasmid distribution service Addgene (# 62225 and 62226, respectively) [72]. pTargetF (Amp) was constructed by replacing aadA (spectinomycin-resistant gene) with bla (ampicillin-resistant gene) using the overlap-extension PCR method. The resulting PCR product was digested using XhoI and MluI and cloned into pTargetF. To construct pTargetF (Amp)-original N20, a DNA fragment containing a 20 bp native protospacer (N20) of the hns gene 5′ UTR was amplified, digested using SpeI and EcoRI, and ligated into pTargetF (Amp). pTargetF (Amp)-artificial N20 was then inserted with N20 into pTargetF (Amp) and Basic Local Alignment Search Tool (http://www.rgenome.net/cas-offinder/) used to ensure that the selected 23 bp (N20-NGG) sgRNA target had no significant match elsewhere in the S. Typhimurium SL1344 genome.
Nucleotide substitutions were introduced at positions A-31, A-9, and T-8 in the hns 5′ UTR sequence (A in start codon defined as +1) in the S. Typhimurium genome as described previously [17,72]. Two CRISPR events were performed using pTargetF (Amp)-original N20 and pTargetF (Amp)-artificial N20 with pCas, which was transformed into S. Typhimurium SL1344 and the transformed product spread onto LB agar containing kanamycin (50 μg ml-1). S. Typhimurium-competent cells harbouring pCas were prepared as described previously [73].
Human intestinal epithelial cells (HCT116) were routinely cultured in McCoy’s 5A (Welgene) medium supplemented with 10% (v/v) heat-inactivated foetal bovine serum (Welgene) and 1% (v/v) penicillin-streptomycin solution (Welgene). Cell lines were cultivated at 37°C in a humidified atmosphere of 5% CO2 in air.
S. Typhimurium strains were grown overnight in LB medium, washed with PBS, resuspended in PBS, and mixed with HCT116 at a multiplicity of infection (MOI) of 100. Infection assays were performed in the presence of antibiotics in serum free McCoy’s 5A medium. After incubation under 5% CO2 at 37°C for 1 h, extracellular bacteria were killed by treatment with gentamicin (100 μg ml-1) for 2 h (3 h post-infection) under the same conditions. Cells were then washed with PBS and intracellular bacteria were released using 0.25% sodium deoxycholate. The quantity of intracellular bacteria was assessed by measuring viable counts on non-selective and selective LB agar plates including appropriate antibiotics.
Proteins were resolved and analyzed by western blotting, as described previously [9,70].
Mice were intraperitoneally infected with 104 CFUs of S. Typhimurium strains in 100 μl of PBS and euthanised after two days. The spleens, livers, and mesenteric lymph nodes were removed aseptically and viable intracellular bacterial cells counted as described previously [69].
To analyze CD11b+ cell frequency, mouse splenocytes were incubated with antibodies specific for murine CD11b (Tonbo Biosciences). To quantify inflammatory cytokines, serum IL-1α, IL-1β, IL-6, IL-10, IL-12p70, IL-17A, IL-23, IL-27, MCP-1, IFN-β, TNF-α, and GM-CSF levels were analyzed using a LEGENDplex mouse inflammation panel kit (BioLegend) according to the manufacturer’s instructions. Data were collected using an Attune NxT Acoustic Focusing Cytometer (Thermo Fisher Scientific) and analyzed using Flowjo software (BD Biosciences).
Protein expression patterns in the supernatants and whole cell lysates of WT and Δrng cells were compared following cultivation in LB medium with aeration (180 rpm) at 37°C. Cells harvested from 10 ml cultures were mixed with 300 μl of lysis buffer containing 8 M urea, 20 mM 3-[(3-cholamidopropyl) dimethylammonio]-1-propanesulfonate (CHAPS), and 10 mM dithiothreitol (DTT), and disrupted using 0.5 mm glass beads and a MINI BEADBEATER (BioSpec). Next, whole cell lysates were obtained by centrifugation at 4°C and 13,200 rpm for 15 min and protein concentration was determined using a Quick Start 1 × Dye Bradford reagent and bovine serum albumin standard (Bio-Rad Laboratories). Cellular enolase (Eno) levels in the whole cell lysates of WT and Δrng cells were assessed by western blotting to evaluate whether eno mRNA levels were controlled by RNase G, as in E. coli [9,16].
Supernatants from the 10 ml cultures were treated with 10 mM DTT and 1× protease cocktail (Roche Diagnostics), filtered to remove cell debris using 0.2 μm membranes, and concentrated using centrifugal filter units with a cutoff value of 10 kDa (Merck Millipore). Concentrated supernatants were analyzed by SDS-PAGE and protein bands between 30 and 90 kDa were subjected to cysteine alkylation with 4.5% (w/v) iodoacetamide (Sigma-Aldrich) followed by trypsin digestion for mass spectrometry analysis, as described previously [74]. Eluted tryptic peptides were dissolved in 0.4% acetic acid and analyzed using a Velos Pro Mass analyser (Thermo Fisher Scientific) with a nano-liquid chromatography system and a Magic C18AQ column (75 μm × 75 mm), as described previously [75]. Tandem mass spectrometric data were analyzed using a SEQUEST search in Thermo Proteome Discoverer version 1.3 against a sequence database of proteins derived from the complete genome assembly of S. Typhimurium SL1344 (GCA_000210855.2) in the U.S. National Center for Biotechnology Information. The search options were as follows: average mass (m/z), maximum of one miscleavage site for trypsin digestion, precursor mass tolerance of 1.5 Da, fragment mass error of 1.0 Da, dynamic modification for methionine oxidation, static modification for cysteine alkylation, protein probability > 99%, and a false-discovery rate (FDR) < 0.01. Individual peptides were filtered at a probability > 0.95 to identify those with two or more unique peptides. Relative protein levels in each sample were quantitated using the normalized spectral abundance factor (NSAF) method [76].
Total cellular RNA was extracted from cultures grown under aerobic and anaerobic conditions at 37°C to an OD600 of 0.6 and 0.3, respectively, using an RNeasy mini prep kit (Qiagen). qRT-PCR was performed as described previously [70].
Total RNA was isolated and analyzed by northern blotting, as described previously [9]. The random hexamer probes used to detect hns mRNA were synthesised using a random primer DNA labeling kit (Roche Diagnostics). PCR products containing the hns ORF were synthesised using RT-St-hns-F (+149) and St-hns (stop)-R primers and used as a template to synthesise random hexamer probes. The oligonucleotide probe M1-R was used to probe M1.
Primer extension analysis was performed as described previously [16,70]. To analyze the RNase G cleavage sites in the hns 5′ UTR, total cellular RNA was extracted from cells (WT, hns A-31C, hns A-9G, or hns U-8C) grown under anaerobic conditions at 37°C to an OD600 of 0.6 using St-hns-R (+30) primers. To analyze in vitro-cleaved synthetic hns RNA, the cleavage products were purified by phenol extraction and ethanol precipitation and hybridised with the 5′-32P-labeled primer, St-hns-R (+30). To identify the exact RNase III cleavage site in rng mRNA, total cellular RNA was extracted from cells cultured under aerobic conditions at 37°C to an OD600 of 0.6 using phenol extraction and ethanol precipitation, and then hybridised with the 5′-32P-labeled primer, St-rng (+219)-R.
S. Typhimurium RNase G (Rng) was purified from E. coli strain N3433rng containing pSt-rng-His using Ni-NTA agarose (Qiagen). Cultures were grown to an OD600 of 0.7 and harvested. RNase G was eluted from the columns using 250 mM imidazole, concentrated, and stored as described previously [9].
Synthetic hns RNA containing the 5′ UTR (WT, hns A-31C, hns A-9G, or hns U-8C) was synthesised from PCR DNA using a MEGAscript T7 kit (Thermo Fisher Scientific) according to the manufacturer’s instructions. PCR DNA was amplified from S. Typhimurium SL1344 genomic DNA (WT, hns A-31C, hns A-9G, or hns U-8C) using two primers, St-T7-hns-F and St-hns (stop)-R. RNA transcripts were labeled at the 5′ end using [γ-32P]ATP (Perkin Elmer, Waltham, MA, USA) and T4 polynucleotide kinase (New England Biolabs, Ipswich, MA, USA) and purified using 12% polyacrylamide gel containing 8 M urea. RNase G cleavage assays were performed as described previously [9].
WT cells harbouring pSt-hns (WT)-cat, pSt-hns (A-31C)-cat, pSt-hns (A-9G)-cat, and pSt-hns (U-8C)-cat plasmids were cultured overnight in LB medium at 37°C with aeration, diluted 1:100 in same medium, and incubated at 37°C to an OD600 of 0.6. To stop RNA transcription, rifampicin (Sigma-Aldrich) was added to the cultures at a final concentration of 1 mg ml-1. For the zero-time point, culture samples were taken before rifampicin addition. To measure the half-life of cat mRNA, culture samples were taken 1, 2, 4, and 8 min after rifampicin addition and qRT-PCR analysis was performed as described above. To measure the half-life of rng mRNA, overnight cultures of WT or Δrnc cells grown in LB medium at 37°C with aeration were diluted 1:100 in same medium and incubated at 37°C to an OD600 of 0.6 and 0.3, respectively, in the presence or absence of oxygen. Total RNA preparation and qRT-PCR were carried out as described above.
Three 6-week-old female mice were intraperitoneally infected with 104 CFUs of the WT, hns A-31C, hns A-9G, or hns U-8C strains in 100 μl of PBS. Mice were euthanised after 2 days and their spleens, livers, and mesenteric lymph nodes were removed aseptically and homogenised in 500 μl of ice-cold TRIzol (Thermo Fisher Scientific). Total RNA samples were purified by phenol extraction and ethanol precipitation.
The numerical data used in all main figures are included in S1 Data. The statistical details of all experiments are included in the figure legends. Multiple comparisons were performed using SAS v. 9.2 with the Student-Newman-Keuls test (SAS Institute) and Student’s t-tests were used for control comparisons in SAS v. 9.2 and SigmaPlot 10.0 (Systat Software). Data represent the mean ± standard error of the mean (s. e. m) and P < 0.05 was considered to indicate statistical significance. See S5 Table for exact statistics and reproducibility.
We thank Dr. Stanley N. Cohen for his kind gift of RNase G (Rng) antibodies and Dr. Boeun Lee for technical assistance.
1
2
3
4
5
6
7
8
9
10
11
12
13
14
15
16
17
18
19
20
21
22
23
24
25
26
27
28
29
30
31
32
33
34
35
36
37
38
39
40
41
42
43
44
45
46
47
48
49
50
51
52
53
54
55
56
57
58
59
60
61
62
63
64
65
66
67
68
69
70
71
72
73
74
75
76
 Endoribonuclease-mediated control of hns mRNA stability constitutes a key regulatory pathway for Salmonella Typhimurium pathogenicity island 1 expression
 Facebook
 Twitter
 Linkedin
 Whatsapp

