
Competing Interests: The authors have declared that no competing interests exist.
Sarcopenia is a progressive generalized skeletal muscle disorder, which may increase the risk of osteopenia. The aim of this study was to systematically review studies on the association between sarcopenia and osteopenia by pooled analysis. The PubMed and Embase databases were searched from inception to October 2020 for studies focusing on the association between sarcopenia and osteopenia. Two reviewers independently extracted data and assessed study quality. A pooled analysis was performed to calculate odds ratios (ORs) and 95% confidence intervals (CIs) using random-effects models. Subgroup analysis was conducted to explore the source of heterogeneity and the stability of outcome. A total of 25 independent studies involving 47,744 participants fulfilled the inclusion criteria. Sarcopenia significantly increased the risk of osteopenia (OR, 2.08; 95% CI, 1.66–2.60); Sensitivity analyses indicated the outcome was stable. Subgroup analyses showed that sarcopenia significantly increased osteopenia risk in each subgroup. No evidence of publication bias among the studies existed. In this study, our findings showed that sarcopenia significantly increased the risk of osteopenia. Thus, we suggest that sarcopenia can be a predictor of osteopenia risk.
Sarcopenia is a muscle disorder involving depletion of skeletal muscle mass with a risk of adverse outcomes, such as physical disability and poor quality of life [1], is associated with many clinical conditions, such as cancer, diabetes, rheumatoid arthritis, and osteopenia [2–4]. Osteopenia, defined by the World Health Organization that is a t-score between -1 to -2.5, is a clinical term used to describe a decrease in bone mineral density [5]. Projections estimate that over 47 million Americans will be afflicted with osteopenia [5, 6]. Thus osteopenia is one of the major public health problems globally, and the burden is extremely heavy.
Some studies have indicated that osteopenia is associated with an increased risk of sarcopenia [4, 7–16]. However, others have shown no significant association exists between sarcopenia and osteopenia [17–19]. Therefore, we performed a pooled analysis to assess the relationship between sarcopenia and osteopenia risk.
This analysis was conducted in accordance with the Meta-analysis of Observational Studies in Epidemiology guidelines and the Preferred Reporting Items for Systematic Reviews and Meta-analyses standards [20, 21].
We systematically searched PubMed and Embase (from their inception to October 1, 2020) for studies conducted on the association between sarcopenia and osteopenia. Our core search keywords are as follows: “sarcopenia”, “osteopenia”, and “low bone mineral density”. Two researchers (TZW and ZY) independently reviewed the titles and abstracts of the studies retrieved from the databases. We included studies that reported sufficient data on sarcopenia increasing osteopenia risk, such as risk estimates (relative risks [RRs], odds ratios [ORs]) with 95% confidence intervals (CIs). The studies were assessed based on the Strengthening the Reporting of Observational Studies in Epidemiology (STROBE) statement [20]. All disagreements were resolved by discussion with the corresponding authors.
The data extraction and analysis were similar as our previous studies [22]. The following variables were recorded as: name of the first author, year of publication, region in which the study was performed, type of study design, sample size, participant gender and age, risk estimates with 95% CIs, adjustment factors. When one study included more than one trial, we pooled the trials and considered each trial an independent study. We computed a pooled OR and 95% CI. The Cochrane Q and I2 statistics were used to evaluate the statistical heterogeneity [23]. When the P value was < 0.1 and the I2 value was > 50%, the data were considered to be heterogeneous, and a random-effects model [24] was applied. To further explore the origin of heterogeneity and the stability of conclusion, we also performed subgroup analyses by sex, study design, study region, and criteria of sarcopenia. A sensitivity analysis was conducted to estimate the influence of each individual study on the pooled result. Begg’s test and Egger’s test were used to assess the potential publication bias [25, 26]. STATA version 12.0 (College Station, TX, USA) was used to analyze the data.
A total of 1727 studies were retrieved from PubMed and Embase, after removing duplicates, 1475 were identified. After screening the title and abstract, 288 necessitated reading of the full article. Ultimately, 20 studies [4, 7–19, 27–32] involving 47,744 participants were included (Fig 1). The study characteristics are listed in Table 1. The quality of the studies access by the STROBE statement (S1 Table).

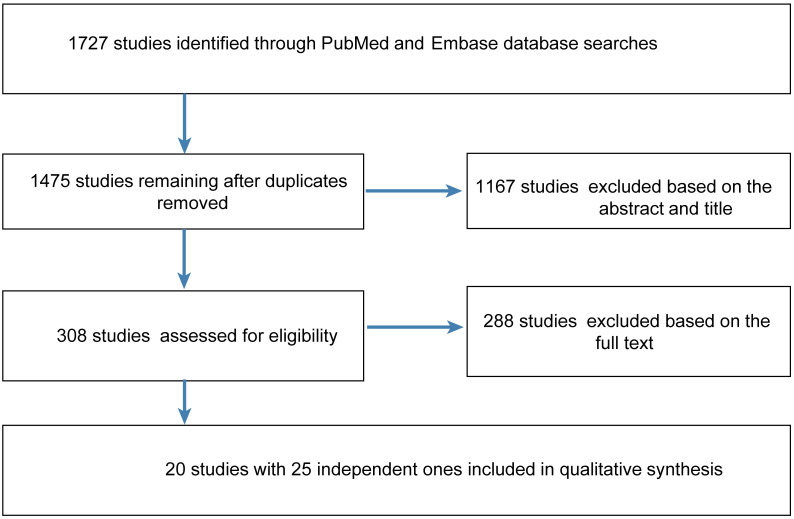
Flow diagram of the steps for study inclusion.

| Study, year | Age (years) | Gender | Study design | Region | Sample size | OR | LCI | UCI | Population | Statistical analysis method | Adjustment factors | Diagnostic criteria for osteopenia | Diagnostic criteria for sarcopenia |
|---|---|---|---|---|---|---|---|---|---|---|---|---|---|
| Schneider, 2008 | 36.2±13.9 | Female and male | Case-control study | France | 132 | 4.529 | 2.072 | 9.903 | Crohn’s disease | Chi-square test | NA | Osteopenia: T-score for BMD (g/cm2) below -1.0 | Sarcopenia: appendicular skeletal muscle index (ASMI) < 5.45 kg/m2 for women and < 7.26 for men |
| Falutz, 2013 (M) | 18–75 | Male | NA | Modena | 1243 | 2.610 | 1.836 | 3.709 | HIV patients | Chi-square test | NA | Analysis-determined differences between proportions of patients with osteoporosis and normal bone mineral density (BMD) | Baumgartner (<7.26 kg/height2 in males) |
| Falutz, 2013 (W) | 15–70 | Female | NA | Modena | 724 | 2.626 | 1.589 | 4.341 | HIV patients | Chi-square test | NA | Analysis-determined differences between proportions of patients with osteoporosis and normal BMD | Baumgartner (<5.45 kg/height2 in females) |
| Lee, 2013 (M) | ≥60 | Male | Cross-sectional study | Korea | 1596 | 1.680 | 1.220 | 2.330 | KNHANES (2009–2010) participants | Multivariable logistic regression analysis | Regular exercise, smoking status, alcohol consumption, and vitamin supplementation | T-score<−1.0 | Sarcopenia: <1 SD below the sex-specific mean for a young reference group |
| Lee, 2013 (W) | ≥60 | Female | Cross-sectional study | Korea | 1886 | 1.430 | 1.120 | 1.820 | KNHANES (2009–2010) participants | Multivariable logistic regression analysis | Regular exercise, smoking status, alcohol consumption, and vitamin supplementation | T-score<−1.0 | Sarcopenia: <1 SD below the sex-specific mean for a young reference group |
| Wu, 2013 | 40–85 | Female and male | Cross-sectional study | Taiwan | 600 | 1.720 | 1.090 | 2.720 | Ambulatory and healthy volunteers | Multiple logistic regression analysis | Age, gender, BMI group, exercise, antiosteoporotic agent use, vitamin/mineral supplement use, menopause, and HRT | T-score <-1.0 | SMI < 8.87 and < 6.42 kg/m2 in Taiwanese men and women, respectively |
| Bryant, 2015 | 18–50 | Female and male | Cross-sectional study | Australia | 137 | 6.300 | 1.400 | 27.900 | Irritable bowel disease (IBD) patients | Multivariate logistic regression analysis | NA | T-score of either site: -1 to -2.5 | Sarcopenia: both ASMI and grip strength (GS) ≥1 SD below population mean |
| Pereira, 2015 | 68.3±6.8 | Male | Cross-sectional study | Brazil | 198 | 9.000 | 2.088 | 38.787 | Healthy men | Regression analyses | Age and weight | Abnormal BMD for men: T-score < -1.0 | EWGSOP: RASM <7.26 kg/m2 +low muscle strength or low physical performance (walking speed <1.0 m/s) |
| Chung, 2016 | ≥50 | Female and male | Cross-sectional study | Korea | 2344 | 1.069 | 0.791 | 1.444 | KNHANES V (2010) participants | Multivariable logistic regression analysis | Age, sex, household income, current smoking status, alcohol consumption, vitamin D, hypertension and dyslipidemia | T-score < -1.0 | Sarcopenia: SMI score in the fifth percentile of sex-matched younger (20–40 years of age) reference KNHANES V-1 participants; SMI cutoff values: 28.9% for men and 22.4% for women |
| He, 2016 | 18–97.5 | Female and male | Cross-sectional study | USA | 17891 | 1.87 | 1.09 | 3.20 | Chinese individuals African American individuals Caucasian individuals | Multivariate logistic regression analysis | Age, gender, height, weight, race, city, smoking, alcohol drinking, and regular exercise | WHO diagnostic classification: T-score < -1 SDs | Sarcopenia: (1) 6.08 and 4.79 kg/m2 for healthy Chinese men and women, respectively; (2) RASM ≤7.26 kg/m2 and RASM ≤5.45 kg/m2 in men and women, respectively, plus either low muscle strength or low physical performance |
| Lee, 2016 | ≥50 | Female and male | Cross-sectional study | Korea | 858 | 3.495 | 2.315 | 5.278 | KNHANES IV, V (2008–2011) participants with chronic obstructive pulmonary disease (COPD) | Multivariate logistic regression analysis | Age; gender; height; smoking frequency; blood levels of vitamin D, parathyroid hormone (PTH), and alkaline phosphatase (ALP); forced expiratory volume in 1 second (FEV1, %); and physical inactivity level | WHO diagnostic classification: T-score < -1 SD | AWGS; sarcopenia: ASMI by DXA ≤7.0 kg/m2 for male patients and ≤ 5.4 kg/m2 for female patients |
| Lee Ih, 2016 | ≥65 | Female | Cross-sectional study | Korea | 269 | 1.240 | 0.583 | 3.210 | Postmenopausal women living in local community centers | Binary logistic regression analyses | Age, postmenopausal period, body fat level and physical activity | Osteopenia: BMD > 1.0 but < 2.5 SDs below the young adult mean | Sarcopenia: weight-adjusted ASM < -2 SDs |
| Lee Ih, 2016 | 73.1 ± 5.5 | Female | Cross-sectional study | Korea | 119 | 4.420 | 0.962 | 20.315 | Elderly women | Logistic regression analyses | Age | Osteopenia: -1.0 ≥ T-score > -2.5 | ASMI < 5.27 kg/m2 |
| Choi, 2017 non-TB | ≥50 | Male | Cross-sectional study | Korea | 2699 | 3.283 | 2.690 | 4.007 | KNHANES (2008–2011) participants | Chi-square test | NA | osteopenia: T-score between -2.5 and -1 | Sarcopenia: ASMI cutoff of 6.96 kg/m2 |
| Choi, 2017 (TB1) | ≥50 | Male | Cross-sectional study | Korea | 98 | 7.448 | 2.488 | 22.299 | Tuberculosis (TB) survivors among KNHANES (2008–2011) participants | Chi-square test | NA | osteopenia: T-score between -2.5 and -1 | Sarcopenia: ASMI cutoff of 6.96 kg/m2 |
| Choi, 201 (TB2) | ≥50 | Male | Cross-sectional study | Korea | 245 | 3.268 | 1.855 | 5.757 | TB survivors among KNHANES (2008–2011) participants | Chi-square test | NA | osteopenia: T-score between -2.5 and -1 | Sarcopenia: ASMI cutoff of 6.96 kg/m2 |
| Choi, 2017 (TB3) | ≥50 | Male | Cross-sectional study | Korea | 186 | 5.115 | 2.452 | 10.672 | TB survivors among KNHANES (2008–2011) participants | Chi-square test | NA | Osteopenia: T-score between -2.5 and -1 | Sarcopenia: ASMI cutoff of 6.96 kg/m2 |
| França, 2017 | ≥50 | Female and male | Cross-sectional study | Brazil | 214 | 2.410 | 1.070 | 5.400 | Health Survey-Sao Paulo (ISA-Capital2014/2015) participants | Logistic regression analysis | Age, sex and 25-hydroxyvitamin D (25OHD) levels | T-score <-1.0 | ASM (sum of muscle mass of arms and legs, kg) divided by height2 (m2) classified according to the EWGSOP |
| Harris, 2017 | 50–79 | Female | Observational and clinical trials | USA | 10937 | 1.421 | 1.289 | 1.566 | Women’s Health Initiative (WHI)- enrolled women | Chi-square test | NA | T-score <-1.0 | Sarcopenia: 20th percentile of the distribution of residuals from a model in which aLM was corrected for fat mass and height and linear regression was performed to model the associations between aLM and (meters) and between aLM and fat mass (kg) |
| Hwang, 2017 | 63.9 ± 10.6 | Male | Cross-sectional study | Korea | 777 | 3.898 | 1.270 | 11.957 | Male KNHANES (2008–2011) participants with COPD | Logistic regression analyses | NA | WHO criteria (T-score between -2.5 and -1) | Sarcopenia: ASMI < 2 SDs |
| Kim, 2017 (M) | 25–49 | Male | Cross-sectional study | Korea | 1702 | 0.953 | 0.719 | 1.264 | KNHANES IV, V (2008–2011) participants | Univariable logistic regression analysis | Confounders | T-score < -1.0 | Severely low muscle mass: SMI >2 SDs below the gender-specific mean of the younger reference group (SMI [%]) calculated as the ASM (kg)/weight (kg) ×100 |
| Kim, 2017 (W) | 20–55 | Female | Cross-sectional study | Korea | 2192 | 0.843 | 0.665 | 1.068 | KNHANES IV, V (2008–2011) participants, premenopausal women | Multivariable logistic regression analysis | Age, BMI, smoking, drinking, hypertension, physical activity, and serum 25OHD levels | T-score < -1.0 at the lumbar spine, femoral neck, and/or total hip | Severely low muscle mass: SMI >2 SDs below the gender-specific mean of the younger reference group (SMI [%]) calculated as the ASM (kg)/weight (kg) ×100 |
| Magdalena, 2017 | 50–75 | Female | Case-control study | Poland | 51 | 3.778 | 1.144 | 12.472 | Psoriatic arthritis patients | Chi-square test | NA | WHO diagnostic classification: T-score -1 to -2.5 SDs | Baumgartner et al.: aLM index < 5.45 kg/m2 |
| Lee, 2017 (ACOS) | ≥50 | Female and male | Cross-sectional study | Korea | 110 | 6.935 | 1.194 | 44.272 | KNHANES IV, V (2008–2011) participants with asthma-COPD overlap syndrome (ACOS) | Multivariate logistic regression analysis | Age; gender; height; smoking frequency; blood levels of vitamin D, PTH, and ALP; FEV1 (%); and physical inactivity level | WHO diagnostic classification: T-score −1 to −2.5 SDs | AWGS; sarcopenia: ASMI by DXA ≤7.0 kg/m2 for male patients and ≤ 5.4 kg/m2 for female patients |
| Lee, 2017 (COPD) | 748 | 3.131 | 2.101 | 4.666 | |||||||||
| Lee, 2017 (Asthma) | 89 | 0.268 | 0.043 | 1.684 | |||||||||
| Santos, 2018 | 80–95 | Female and male | Cross-sectional study | Brazil | 128 | 2.810 | 1.110 | 7.110 | Elderly residents | Binary logistic regression analysis | Gender, age and smoking | WHO diagnostic classification: T-score < -1.0 SD | aLM index < 7.59 kg/m2 and < 5.57 kg/m2 for men and women, respectively, with a gait speed < 0.8 m/s in a 3 m walking test |
| Bieliuniene, 2019 | 22–89 | Female and male | Prospective study | Lithuanian | 100 | 2.648 | 1.123 | 6.243 | Patients with chronic pancreatitis (CP) and pancreatic ductal adenocarcinoma | Chi-square test | NA | Osteopenia: T-score from -1 to -2.5 | Sarcopenia: SMI < 34.4 cm2/m2 for females and < 45.4 cm2/m2 for males |
NA: not available; OR: estimate of the risk; LCI: low limit of 95% confidence interval; UCI: upper limit of 95% confidence interval.
A pooled analysis of 20 studies involving 25 researches showed that sarcopenia significantly increased osteopenia risk (OR, 2.08 [95% CI, 1.66–2.60]; Pheterogeneity = 0.000, I2 = 86.1%) (Fig 2). Substantial heterogeneity was observed (P<0.10, I2 >50%) (Fig 2); however, the analysis revealed that exclusion of any single study did not alter the overall combined results, which indicated that the outcome was stable (Fig 3). Subgroup pooled analyses performed according to gender, study design type, different criteria of sarcopenia, and region also indicated that sarcopenia significantly increased osteopenia risk in each subgroup (Table 2). The Begg and Egger test indicated no evidence of publication bias among the studies [Begg, P > |z| = 0.168; Egger, P = 0.058, 95% CI -0.055–3.098] (Fig 4).
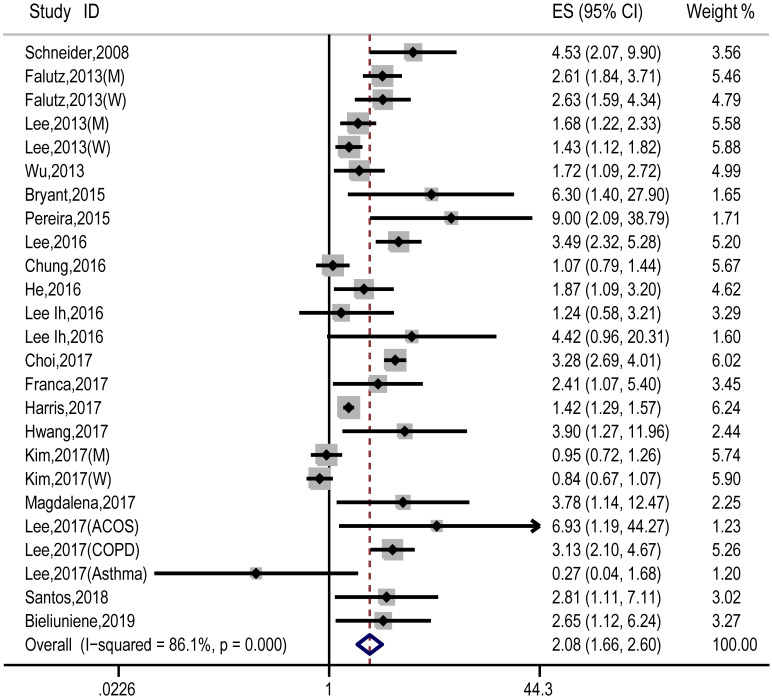
Forest plot of the estimated effects of sarcopenia on osteopenia risk.
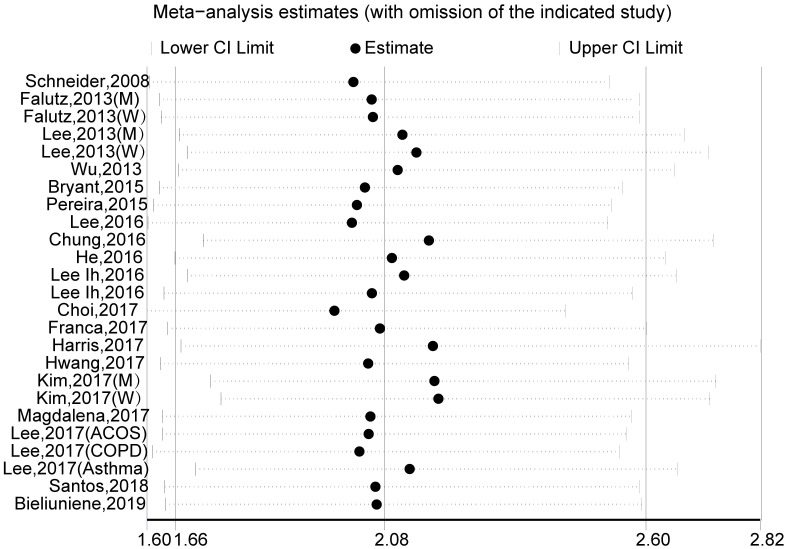
Sensitivity analysis for the estimated effects of sarcopenia on osteopenia risk.
The analysis was performed via recalculation of the pooled results of the primary analysis after exclusion of one study per iteration.
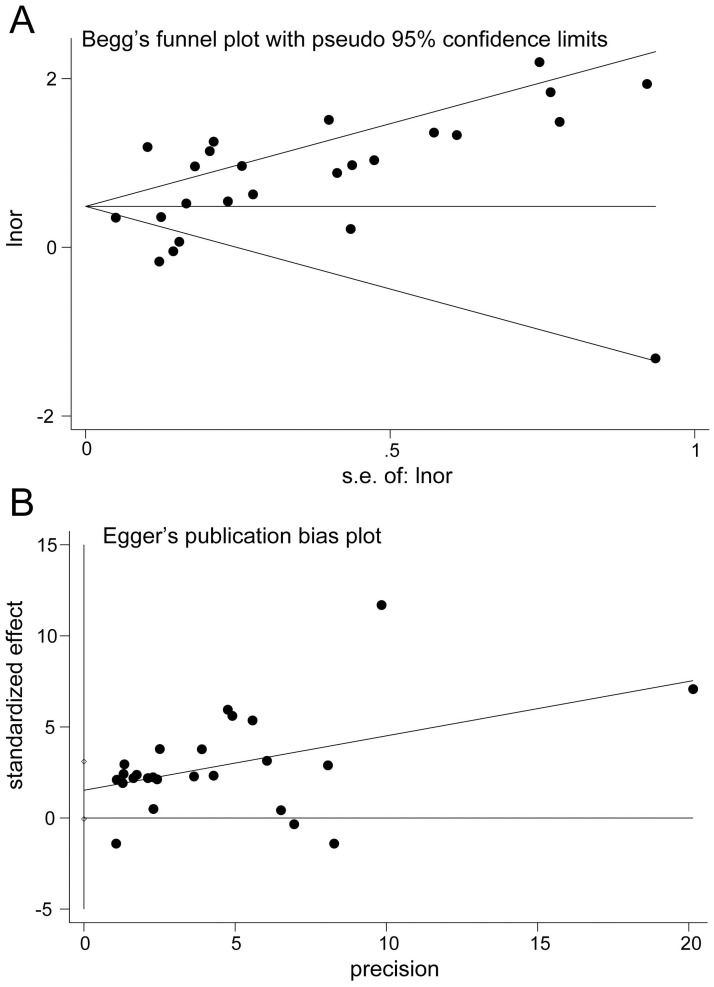
Publication bias plot.
A, Begg’s funnel plot. B, Egger’s publication bias plot.
| Factor | No. | OR (95% CI) | I2 (%) | Pheterogeneity |
|---|---|---|---|---|
| Study design | ||||
| Cross-sectional study | 19 | 1.99 (1.47, 2.70) | 87.5 | 0.000 |
| Case-control study | 2 | 4.29 (2.23, 8.25) | 0.0 | 0.803 |
| Other | 4 | 2.14 (1.37, 3.32) | 82.4 | 0.001 |
| Sex | ||||
| Male | 6 | 2.36 (1.39, 4.02) | 91.3 | 0.000 |
| Female | 7 | 1.49 (1.11, 2.00) | 78.8 | 0.000 |
| Male and female | 12 | 2.37 (1.64, 3.44) | 74.4 | 0.000 |
| Sarcopenia criteria | ||||
| 1- Ba 1-Baumgartner’s | 7 | 2.45 (1.74, 3.44) | 82.8 | 0.000 |
| 2- EWGSOP | 5 | 2.39 (1.52, 3.78) | 42.1 | 0.141 |
| 3- AWGS | 4 | 2.83 (1.56, 5.15) | 62.1 | 0.048 |
| 4-Others | 9 | 1.34 (1.02, 1.75) | 76.3 | 0.000 |
| Region | ||||
| 1-Europe | 5 | 2.82 (2.19, 3.62) | 0.0 | 0.750 |
| 2-America | 4 | 2.41 (1.25, 4.64) | 68.8 | 0.022 |
| 3-Asia | 15 | 1.78 (1.28, 2.46) | 89.5 | 0.000 |
| 4-Australia | 1 | 6.30 (1.41, 28.12) | - | - |
OR: estimate of the risk; CI: 95% confidence interval; No.: number of the included studies.
Osteopenia is characterized by loss of bone mass, reduced bone mineral density, which will develop into osteoporosis, may further lead to heavy economic and social burdens. Sarcopenia is one of the most important contributing factors related to osteopenia. Muscle and bone are interconnected biochemically and biomechanically, and they can mutually influence each other [33, 34]. Sarcopaenia and osteopaenia are two musculoskeletal pathologies mutually influencing each other, both associated with aging, lifestyle factors, falls and fractures [1, 3]. Thus, sarcopenia and osteopaenia frequently occur concomitantly, which leads to osteosarcopenia, and all of these conditions are critically associated with bone fragility, increased fall risk, fractures [35]. And osteosarcopaenia should be consciously incorporated into daily life and therapeutic strategies. This pooled analysis indicated that sarcopenia significantly increased osteopenia risk. Although heterogeneity was substantial, sensitivity analysis did not alter the overall combined results, subgroup analyses showed that sarcopenia significantly increased the risk of osteopenia in each pooled subgroup, which all demonstrated the credibility of the results. This pooled analysis has strengthened previous findings, for example, one study showed that older women with sarcopenia exhibited lower bone mineral density than those without sarcopenia [35]. Therefore, it may be possible to prevent osteopenia and related adverse events by the treatment of sarcopenia.
This study has several limitations. First, the study design included cross-sectional studies, case-control studies, and others, which might have led to substantial heterogeneity. Second, some trials did not provide the data as estimates with 95% CIs, so we had to calculate these values according to specific numbers of participants, which might have influenced the accuracy of the results. Third, different studies used different diagnostic criteria for sarcopenia, which might have slightly affected the results. Therefore, the results should be interpreted with caution.
In this study, our findings showed that sarcopenia significantly increases osteopenia risk. However, care should be taken when interpreting the findings, and large randomized controlled trials are still needed to further specify the association between osteopenia and sarcopenia.
We appreciate the contribution of all patients, their families, the investigator and the medical staff.
1
2
3
4
5
6
7
8
9
10
11
12
13
14
15
16
17
18
19
20
21
22
23
24
25
26
27
28
29
30
31
32
33
34
35
 An analysis and systematic review of sarcopenia increasing osteopenia risk
 Facebook
 Twitter
 Linkedin
 Whatsapp

