
Competing Interests: The authors have declared that no competing interests exist.
Culicoides are one of the smallest hematophagous flies measuring 1–5 mm in size with only females seeking blood for egg development. The present study investigated spatio-temporal distribution of Culicoides species trapped between 1990 and 2018 at 13 sites in the New England region of NSW, Australia using automated light traps. Trapping locations were divided into three subregions (tablelands, slopes and plains). Nineteen Culicoides species were identified. Culicoides marksi and C. austropalpalis were the most abundant and widespread species. Culicoides brevitarsis, the principal vector of livestock diseases in New South Wales comprised 2.9% of the total catch and was detected in 12 of the 13 locations in the study. Abundance as determined by Log10 Culicoides count per trapping event for the eight most abundant species did not vary significantly with season but trended towards higher counts in summer for C. marksi (P = 0.09) and C. austropalpalis (P = 0.05). Significant geographic variation in abundance was observed for C. marksi, C. austropalpalis and C. dycei with counts decreasing with increasing altitude from the plains to the slopes and tablelands. Culicoides victoriae exhibited the reverse trend in abundance (P = 0.08). Greater abundance during the warmer seasons and at lower altitudes for C. marksi and C. austropalpalis was indicative of temperature and rainfall dependence in this region with moderate summer dominance in rainfall. The Shannon-Wiener diversity index of species was higher on the tablelands (H = 1.59) than the slopes (H = 1.33) and plains (H = 1.08) with evenness indices of 0.62, 0.46 and 0.39 respectively. Culicoides species on the tablelands were more diverse than on the slopes and plains where C. marksi and C. austropalpalis dominated. The temporal and spatial variation in abundance, diversity and evenness of species reported in this diverse region of Australia provides additional insight into Culicoides as pests and disease vectors and may contribute to future modelling studies.
Biting midges, Culicoides Latreille (Diptera: Ceratopogonidae), are one of the smallest hematophagous flies measuring 1–5 mm in size [1–3]. The family is divided into 6,206 recognized extant valid species arranged in three subfamilies and 112 genera [4, 5]. The presence of Culicoides, Leptoconops Skuse, Austroconops Wirth and Lee, and the sub-genera Lasiohelea Kieffer which feed on blood of vertebrates has been reported in Australia [6–8]. In the genus Culicoides, only females seek blood for egg development [1]. Borkent and Dominiak [5] created a list of 1,347 Culicoides species occurring from tidal areas to the highest mountain peaks of up to 4,651 meters and on all continents with exception of the extreme polar regions and New Zealand [1, 9, 10].
Several species of Culicoides are considered as vectors for a wide array of viruses, bacteria and nematodes affecting a wide range of domestic and wild animals [11]. In Australia, Barmah Forest virus (Alphavirus), Eubenangee and Warrego viruses (Orbivirus) were isolated from C. marksi Lee and Reye, and Wallal virus (Orbivirus) from C. dycei Lee and Reye [12]. However, bluetongue and Akabane viruses are of most importance to the livestock industry with the former having a significant impact on global sheep and cattle trade [13–15]. In Australia, proven vectors of bluetongue virus are C. actoni Smith, C. fulvus Sen and Das Gupta and C. brevitarsis Kieffer, while C. dumdumi Sen and Das Gupta, C. oxystoma Kieffer, C. peregrinus Kieffer and C. wadai Kitaoka are regarded as probable vectors [16, 17]. Surveillance on the spatial and temporal distribution of these vectors is continuously monitored by the National Arbovirus Monitoring Program (NAMP) [18].
Culicoides can fly up to 151 meters above the ground [19, 20] with flight activity in search of hosts limited to less than 2 kms [21]. However, they can be transported passively as aerial plankton over greater distances on a prevailing wind [14, 22]. There are reports of long-range introduction of Culicoides from Indonesia, Timor-Leste and Papua New Guinea into northern Australia especially during the monsoon season [9, 23]. The Australian continent is a large landmass, which is mostly flat favouring the potential for long-distance spread of Culicoides under suitable conditions. Continuous monitoring of Culicoides arbovirus vector species is important for establishing and maintaining protocols for the Australian livestock export industry.
Globally, the distribution of vectors and vector-borne diseases of livestock and humans is increasing at an alarming rate [24] with distribution of vectors dependent on changes related to climate, environment, an increase in host mobility, unplanned urbanization and agricultural intensification [24, 25]. In Australia, Standfast and Muller [26] predicted a “Greenhouse Effect” on the distribution of C. wadai with a 3°C rise in minimum temperature and 20% increase in summer rainfall leading to incursion of this species into new areas. More specifically, changes in distribution are associated with the seasonal movement of vectors resulting from changes in temperature, precipitation, soil moisture and host availability [27].
The Australian Culicoides fauna is extensive and diverse with species presence and distribution determined by geography, weather and breeding habitat preferences [28–30]. For example, C. brevitarsis and C. wadai breed exclusively in bovine dung pats [31]. Dyce et al. [10] provided a comprehensive list of Australian Culicoides species of which 49 species are present in New South Wales (NSW). This paper reports Culicoides species composition, abundance and spatio-temporal distribution based on trapping results from the New England region of NSW between 1990 and 2018.
The New England region of New South Wales is located in the north of the state and west of the Great Dividing Range (GDR), including the tableland areas around Armidale and north to the Queensland border. It covers a total area of 99,100 km2 or 12% of the state with agricultural and conservation lands comprising 79,400 km2 (80%) and 14,400 km2 (15%) respectively [32]. The most common land use in the area is grazing upon modified pastures which occupies 39,200 km2 (40%) [33]. The New England region generally declines in altitude from east to west and can be broadly categorized into Tablelands (800–1400 m altitude), Slopes (400–800 m) and Plains (<400 m) subregions [34, 35] with varied land use as shown in Fig 1. Grazing areas are dominated by sheep and cattle, and various common wildlife species [36].

![Map on the land use practices in the New England region of NSW, Australia [33] with the approximate boundaries of the tablelands, slopes and plains areas and location of the sampling sites (numbered) superimposed.](/dataresources/secured/content-1766006143707-0cd356b8-41ac-403e-bd6d-f153bf2bab2b/assets/pone.0249468.g001.jpg)
Map on the land use practices in the New England region of NSW, Australia [33] with the approximate boundaries of the tablelands, slopes and plains areas and location of the sampling sites (numbered) superimposed.
Reprinted from [Catchment Scale Land Use of Australia] under a CC BY license, with permission from [Australian Bureau of Agricultural and Resource Economics and Sciences, ABARES], original copyright [2019].
As part of the NAMP monitoring of Culicoides-borne arboviruses of ruminant livestock in Australia [37], Culicoides trapped from 34 sites on cattle properties at thirteen locations in the New England region between 1990 and 2018 were used in this study (Table 1). Trap sites were occasionally redeployed to nearby cattle property sites within locations following destocking events. For the location Mungindi, there were few trapping events and the data sets generated were merged with data from the nearby site, Boomi. Details of trapping locations used with their basic climatic conditions are provided in Table 1.

| Locations | Alt(m) | Subregions | Mean annual Rainfall (mm) | Mean minimum and maximum temperature (°C) | Sitesa | |||||||
|---|---|---|---|---|---|---|---|---|---|---|---|---|
| Spring | Summer | Autumn | Winter | |||||||||
| Tmin | Tmax | Tmin | Tmax | Tmin | Tmax | Tmin | Tmax | |||||
| 1. Tenterfield | 850 | Tablelands | 784.2 | 7.6 | 22.5 | 14.0 | 26.3 | 8.3 | 19.8 | 1.3 | 15.9 | 2 |
| 2. Armidale | 980 | Tablelands | 749.1 | 7.4 | 20.3 | 12.8 | 25.4 | 7.5 | 18.7 | 1.8 | 12.9 | 2 |
| 3. Wollomombi | 964 | Tablelands | 735.6 | 7.4 | 20.3 | 12.8 | 25.4 | 7.5 | 18.7 | 1.8 | 12.9 | 1 |
| 4. Jeogla | 964 | Tablelands | 875.7 | 7.4 | 20.3 | 12.8 | 25.4 | 7.5 | 18.7 | 1.8 | 12.9 | 1 |
| 5. Yarrowich | 940 | Tablelands | 1045.8 | 11.8 | 25.7 | 17.3 | 28.8 | 12.7 | 22.5 | 6.5 | 19.5 | 2 |
| 6. Wallangra | 550 | Slopes | 725.9 | 10.2 | 26.1 | 17.0 | 31.2 | 10.3 | 23.8 | 2.5 | 18.7 | 4 |
| 7. Inverell | 582 | Slopes | 791.3 | 7.9 | 24.6 | 14.6 | 29.9 | 7.4 | 23.5 | 0.5 | 17.4 | 3 |
| 8. Swanvale | 780 | Slopes | 779.8 | 7.2 | 20.7 | 12.9 | 25.2 | 7.9 | 18.8 | 1.3 | 13.7 | 1 |
| 9. Brodies Plains | 620 | Slopes | 786.4 | 7.9 | 24.6 | 14.6 | 29.9 | 7.4 | 23.5 | 0.5 | 17.4 | 1 |
| 10. Tamworth | 404 | Slopes | 631.9 | 9.6 | 25.5 | 16.7 | 31.6 | 10.1 | 23.4 | 2.8 | 17.3 | 7 |
| 11. Mungindi-Boomi | 184 | Plains | 583.9 | 13.9 | 28.7 | 20.7 | 35.0 | 12.9 | 26.5 | 5.8 | 20.6 | 6 |
| 12. Moree | 212 | Plains | 568.3 | 12.7 | 27.8 | 19.4 | 33.3 | 12.2 | 25.9 | 5.2 | 19.2 | 1 |
| 13. Narrabri | 212 | Plains | 618.9 | 12.1 | 27.8 | 19.3 | 33.7 | 11.4 | 25.3 | 4.8 | 18.8 | 3 |
aThe number of times trapping sites were changed to different farms.
Alt: Altitude; Tmin: Mean Minimum Temperature; Tmax: Mean Maximum Temperature. (Details for the climate data between 1990 and 2018 sourced from archival records at: www.bom.gov.au).
Most Culicoides species are crepuscular and can be sampled using light traps [38, 39]. Initially, the NAMP used CDC-style light traps fitted with incandescent globes (1990 to 2005) as described previously [38]; however, in 2005 the traps were retrofitted with three green light-emitting diodes (LED) as these were proven efficient in collecting arbovirus vector species [40]. The lamp design was further upgraded in 2016 with eight 5 mm, 525 nm LEDs with an intensity of 21000 mcd (Millicandela). These are battery powered and a sensor automatically switches the light and fan on at dusk and off at dawn. The fan draws Culicoides attracted to the light source down into the capture bottle containing 100 ml of 80% ethanol.
The traps were deployed for approximately two nights per month in the week of the new moon. This prevented insects from being distracted from the light traps by moonlight. Similarly, traps were not deployed in the vicinity of buildings where light may also distract the Culicoides from the trap. Most trap deployments were made in the spring, summer and autumn months.
Trapped Culicoides were separated from by catch using morphological features, preserved in 80% ethanol and held in sealed containers away from light to prevent UV or sunlight damage. Though morphological identification of cryptic species is not reliable as mentioned previously [41], the Culicoides were identified to species using their wing patterns by entomologists at the Department of Regional NSW (DRNSW), Central Coast Primary Industries Centre in accordance with the pictorial wing atlas [10].
No trapping was done in 1993 and no catches made in 1994, so these years were excluded from the analysis. Similarly, the very small number of trapping events in winter were excluded from the dataset. The annual trapping period went from early spring (September) until the end of autumn (May) resulting in a total of 26 trapping years. The MS-Excel spreadsheets data from 13 trapping locations were merged and the final dataset comprised records of 4421 trapping events. However, only eight Culicoides species representing 99.2% of the total count were considered for the analysis.
The data were analysed using JMPv.14 statistical software (SAS Institute Inc., Cary, NC, USA). Culicoides per trapping event (Count) were Log10 transformed [y = Log10 (x+1)] to meet the assumptions of analysis of variance. Analysis of counts of each Culicoides species for the repeated measure effects: Years (trapping years 1990/91-2017/18), Seasons [spring (September to November), summer (December to February), autumn (March to May)] and Subregions (tablelands, slopes, plains) and their interactions were fitted as fixed effects in a mixed REML (restricted maximum likelihood model) with trapping location fitted as a random variable. The effect of trap light changes; incandescent globe (1990/91-2004/05), Change 1 (3 green LED; 2005/06-2015/16) and Change 2 (8 green LED; 2016/17-2017/18) on Culicoides counts were fitted as repeated measures model with location as a random effect and analysed using one-way ANOVA. The significance of differences between means within an effect was tested using Tukey’s HSD test. To test differences in binomial data (e.g. success or failure of trapping events), contingency table analysis was used with the Pearson Chi-Square test. A significance value of P<0.05 is used throughout with count data presented as least squares means and standard error (LSM ± SE).
The Shannon-Wiener diversity index (H) was used to determine diversity of Culicoides species across the three subregions using the formula below:

A total of 152,629 Culicoides were trapped between 1990/91 and 2017/18 from thirteen locations in the New England region of NSW. From total green LED (n = 2320) and incandescent (n = 2101) light trap deployments, 88.8% and 81.0% respectively resulted in successful catches. More than a 10-fold increase in abundance and a rise in species diversity from six to ten was observed when the green LED was introduced in 2005/06 (S1 Table). Overall, a total of nineteen species were identified with C. marksi (38.6%), C. austropalpalis Lee and Reye (36.7%), C. victoriae Macfie, (9.6%), C. dycei (6.6%), C. bundyensis Lee and Reye (2.9%), C. brevitarsis (2.9%) and C. nattaiensis Lee and Reye (1.1%) being the most abundant species. Culicoides shermani Causey, C. parvimaculatus Lee and Reye and C. moreensis Lee and Reye were the least common species (Table 2).
| S/N | Culicoides spp. | No. of times detected | No. of midges trapped | Mean F/Da | Locations detectedb | No. of years trapped (n) | Detected in trap types | Seasons detectedc |
|---|---|---|---|---|---|---|---|---|
| 1 | C. marksi | 638 | 58932 | 92 | All (13) | 26 | Both | 3 (Sp, Su &A) |
| 2 | C. austropalpalis | 814 | 56029 | 69 | All | 26 | Both | 3 (Sp, Su &A) |
| 3 | C. victoriae | 807 | 14710 | 18 | All | 26 | Both | 3 (Sp, Su &A) |
| 4 | C. dycei | 366 | 10093 | 28 | 12 (not 4) | 25 | Both | 3 (Sp, Su &A) |
| 5 | C. bundyensis | 368 | 4392 | 12 | All | 24 | Both | 3 (Sp, Su &A) |
| 6 | C. brevitarsis | 238 | 4361 | 18 | 12 (not 9) | 22 | Both | 3 (Sp, Su &A) |
| 7 | C. nattaiensis | 166 | 1734 | 10 | All | 25 | Both | 3 (Sp, Su &A) |
| 8 | C. bunrooensis | 186 | 1097 | 6 | 11 (not 3 & 4) & 3 | 25 | Both | 3 (Sp, Su &A) |
| 9 | C. fulbrighti | 72 | 925 | 13 | 2, 7, 4, 1, 6, 3 & 5 | 15 (>1999/2000) | Both | 3 (Sp, Su &A) |
| 10 | C. (Ornatus Gp sp) #8 | 9 | 144 | 16 | 12, 11, 13, 10 & 6 | 3 (>2015/16) | LED | 2 (Su &A) |
| 11 | C. marginalis | 20 | 50 | 3 | 7, 12, 11, 8, 10 & 6 | 6 (>2011/12) | Both | 2 (Su &A) |
| 12 | C. rabauli | 20 | 39 | 2 | 2, 7, 13, 10, 6, 3 & 5 | 9 (>2004/05) | Both | 2 (Su &A) |
| 13 | C. williwilli | 14 | 38 | 3 | 2, 9, 7, 11, 10, 6, 3, & 5 | 7 (infrequent) | Both | 2 (Su &A) |
| 14 | C. zentae | 11 | 36 | 3 | 9, 7, 11, 8, & 10 | 2 (1990/91&1991/92) | Incandescent | 3 (Sp, Su &A) |
| 15 | C. sigmoidus | 18 | 28 | 2 | 2, 7, 1, 3, & 5 | 12 (>1999/2000) | Both | 3 (Sp, Su &A) |
| 16 | C. loughnani Edwards | 9 | 13 | 1 | 7, 12, 10 & 6 | 6 (>2010/11) | LED | 2 (Su &A) |
| 17 | C. shermani | 4 | 5 | 1 | 7, 11 & 13 | 3 (infrequent) | Incandescent | 2 (Su &A) |
| 18 | C. parvimaculatus | 2 | 2 | 1 | 7 & 11 | 1 (1991/92) | Incandescent | 1 (Su) |
| 19 | C. moreensis | 1 | 1 | 1 | 3 | 1 (2017/18) | LED | 1 (A) |
aMean F/D: Mean number of flies per detection.
bNumbers correspond to respective trapping locations as per Table 1.
cSeason: Sp-spring, Su-summer and A- autumn.
The highest number of detections, i.e., the success of trapping at least one Culicoides specimen, was in the trapping year 2017/18 (97.8%) and the lowest in 1996/97 (65.9%). Culicoides marksi, C. austropalpalis and C. victoriae were detected in all sampling years whereas C. parvimaculatus and C. moreensis were only detected in a single year (Table 2). Culicoides (Ornatus Gp sp) #8 was detected annually from 2015/16. An increase in the relative abundance of Culicoides species was observed when the green LED trap was introduced in 2005/06 (Change 1) and when the LED lamp design was upgraded in 2016/17 (Change 2). However, catches of C. nattaiensis were significantly higher (<0.0001) prior to LED trap introduction with details of abundances for the remainder species shown below (Table 3). Overall, of the 19 species identified, 13 (68%) were detected in both trap types whereas 3 (16%) were trapped with incandescent (CDC-style) lights only and 3 with green LED traps only as shown above in Table 2.
| Culicoides spp. | Log10 Culicoides count/trapping event (Mean ± SE) | P-value | ||
|---|---|---|---|---|
| CDC-style | green LEDa | LED-improvedb | ||
| C. marksi | 0.94 ± 0.04b | 1.05 ± 0.05b | 1.66 ± 0.09a | <0.0001 |
| C. austropalpalis | 0.92 ± 0.03c | 1.06 ± 0.04b | 1.76 ± 0.08a | <0.0001 |
| C. victoriae | 0.64 ± 0.03c | 0.86 ± 0.03b | 1.33 ± 0.06a | <0.0001 |
| C. dycei | 0.84 ± 0.04b | 0.91± 0.05b | 1.13 ± 0.09a | 0.01 |
| C. bundyensis | 0.64 ± 0.04b | 0.71 ± 0.03b | 0.99 ± 0.07a | <0.0001 |
| C. brevitarsis | 0.65 ± 0.06a | 0.75 ± 0.04a | 0.80 ± 0.10a | 0.28 |
| C. nattaiensis | 0.81 ± 0.05a | 0.47 ± 0.06b | 0.67 ± 0.09ab | <0.0001 |
| C. bunrooensis | 0.51 ± 0.04b | 0.54 ± 0.04b | 0.89 ± 0.07a | <0.0001 |
aRepresents mean Culicoides counts between 2005/06 and 2015/16 (Change 1).
bRepresents mean Culicoides count when the LED lamp design was modified since 2016/17 (Change 2). Means in rows with the same letter or case are not significantly different (P<0.05).
Of the 4421 trapping events (663 in spring, 2086 in summer and 1672 in autumn), 85.1% resulted in successful Culicoides catches. Analysis of the effect of season on the mean Culicoides count (Log10 count/trapping event) revealed no significant difference with details of seasonal variations in catches of the eight most abundant species shown below (Table 4). However, there was a non-significant trend towards lower catches of C. marksi (P = 0.09) and C. austropalpalis (P = 0.05) in spring.
| Culicoides spp. | Log10 count by season (LSM ± SE) | P-value | Log10 count by subregions (LSM ± SE) | P-value | ||||
|---|---|---|---|---|---|---|---|---|
| Spring | Summer | Autumn | Tablelands | Slopes | Plains | |||
| C. marksi | 0.78 ± 0.09a | 0.94 ± 0.07a | 0.85 ± 0.07a | 0.09 | 0.38 ± 0.11b | 0.89 ± 0.11a | 1.30 ± 0.11a | 0.002 |
| C. austropalpalis | 0.86 ± 0.10a | 1.01 ± 0.08a | 0.93 ± 0.09a | 0.05 | 0.48 ± 0.14b | 1.04 ± 0.14a | 1.28 ± 0.16a | 0.009 |
| C. victoriae | 0.72 ± 0.09a | 0.71 ± 0.06a | 0.69 ± 0.07a | 0.95 | 0.85 ± 0.08a | 0.79 ± 0.09a | 0.48 ± 0.13a | 0.08 |
| C. dycei | 0.71 ± 0.15a | 0.69 ± 0.09a | 0.58 ± 0.09a | 0.40 | 0.39 ± 0.18b | 0.61 ± 0.12ab | 0.98 ± 0.12a | 0.03 |
| C. bundyensis | 0.56 ± 0.11a | 0.67 ± 0.10a | 0.66 ± 0.09a | 0.66 | 0.67 ± 0.09a | 0.65 ± 0.10a | 0.57 ± 0.16a | 0.85 |
| C. brevitarsis | 0.50 ± 0.50a | 0.60 ± 0.09a | 0.62 ± 0.08a | 0.92 | 0.66 ± 0.18a | 0.49 ± 0.20a | 0.56 ± 0.25a | 0.45 |
| C. nattaiensis | 0.63 ± 0.11a | 0.61 ± 0.07a | 0.52 ± 0.08a | 0.41 | 0.57 ± 0.12a | 0.42 ± 0.11a | 0.78 ± 0.13a | 0.21 |
| C. bunrooensis | 0.67 ± 0.12a | 0.60 ± 0.07a | 0.66 ± 0.08a | 0.62 | 0.75 ± 0.14a | 0.55 ± 0.09a | 0.63 ± 0.10a | 0.47 |
Means in rows with the same letter or case are not significantly different (P<0.05).
The most widespread species were C. marksi, C. austropalpalis, C. bundyensis, C. nattaiensis and C. victoriae (present in thirteen locations) followed by C. brevitarsis and C. dycei (twelve locations) whereas C. moreensis was the least dispersed species as shown in Table 2. There were significant subregional differences in abundance for C. marksi (P = 0.002), C. austropalpalis (P = 0.009) and C. dycei (P = 0.03) all showing a decline in abundance with increasing elevation from the plains to the slopes and tablelands (Table 4). Culicoides victoriae on the other hand exhibited a non-significant trend (P = 0.08) in the opposite direction (Table 4). There were no significant interactions between the effects of season and subregion for the most abundant Culicoides species (Fig 2).
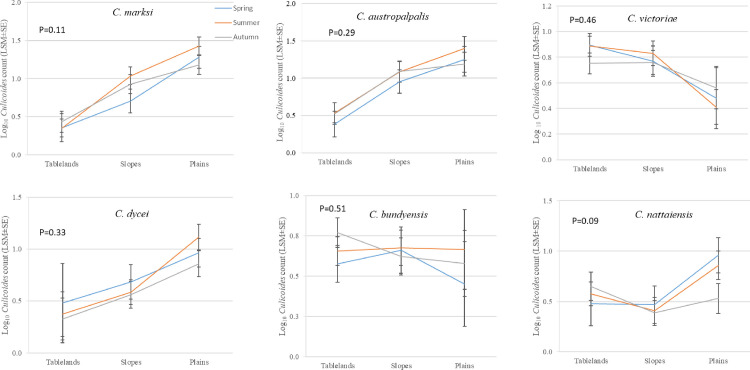
Effect of season and subregion on counts per trapping event (Log10, LSM ± SE) of the most abundant Culicoides species trapped in the New England region of NSW, Australia between 1990 and 2018.
The tablelands, slopes and plains have distinct geographical characteristics and therefore were treated as discrete habitats. The index for diversity of species on the tablelands (H = 1.59) was higher than the slopes (H = 1.33) and plains (H = 1.08) (Table 5). The same trend was observed for evenness index with values for the tablelands, slopes and plains being 0.62, 0.46 and 0.39 respectively. These findings clearly indicate that distribution of species on the tablelands was more diverse and even than on the slopes and plains where C. marksi and C. austropalpalis dominated.
| Culicoides species | Total catch in subregions | |||
|---|---|---|---|---|
| Tablelands (5)a | Slopes (5) | Plains (3) | Total | |
| C. austropalpalis | 4410 | 18210 | 33409 | 56029 |
| C. brevitarsis | 3279 | 828 | 254 | 4361 |
| C. bundyensis | 3074 | 1254 | 64 | 4392 |
| C. bunrooensis | 232 | 387 | 478 | 1097 |
| C. dycei | 92 | 1112 | 8889 | 10093 |
| C. fulbrighti | 923 | 2 | 925 | |
| C. loughnani | 10 | 3 | 13 | |
| C. marginalis | 28 | 22 | 50 | |
| C. marksi | 777 | 15470 | 42685 | 58932 |
| C. moreensis | 1 | 1 | ||
| C. nattaiensis | 295 | 148 | 1291 | 1734 |
| C. (Ornatus Gp sp) #8 | 133 | 11 | 144 | |
| C. parvimaculatus | 1 | 1 | 2 | |
| C. rabauli | 21 | 17 | 1 | 39 |
| C. shermani | 2 | 3 | 5 | |
| C. sigmoidus | 27 | 1 | 28 | |
| C. victoriae | 10677 | 3862 | 171 | 14710 |
| C. williwilli | 15 | 22 | 1 | 38 |
| C. zentae | 35 | 1 | 36 | |
| Total | 23823 | 41522 | 87284 | 152629 |
| Species diversity | 13 | 18 | 16 | |
| Diversity index(H) | 1.59 | 1.33 | 1.08 | |
| Evenness index (E) | 0.62 | 0.46 | 0.39 | |
aNumbers in brackets represent number of locations grouped in each subregion.
Based on monitoring of Culicoides-borne viruses between 1990 and 2018, nineteen Culicoides species identified from the New England region of NSW, Australia are reported in this study. With trapped numbers in excess of 56,000 each, the most abundant species were C. marksi (38.6%) and C. austropalpalis (36.7%), with eight of the species caught making up 99.2% of the total catch. Forty-nine Culicoides species have previously been reported in NSW [10], of which 39% were detected in this study. Seasonal abundance as measured by mean counts per trapping event for the eight most abundant species, revealed a non-significant trend towards increase in abundance of C. marksi and C. austropalpalis in summer. Within the New England region, the abundance of C. marksi, C. austropalpalis and C. dycei declined with increasing altitude from the plains to the slopes and tablelands while C. victoriae exhibited a non-significant trend (P = 0.08) in the opposite direction. The biting midge, C. (Ornatus Gp sp) #8, was detected in the region from 2015/16 onwards with its distribution limited to the plains and slopes. Dyce et al. [10] has previously mentioned the presence of this species in NSW. Culicoides brevitarsis, a major vector of livestock diseases comprised 2.9% of the total catch and was detected in 12 of the 13 locations in the study.
The overall increase in species abundance and detection following introduction of the green LED trap since 2005/2006 (Change 1&2; S1 Table) was likely due to the better performance of the trap as was reported previously [28]. The response of C. marksi, C. austropalpalis, C. dycei, C. victoriae, C. bunrooensis and C. bundyensis to the green LED lamp design improvement was significant and consistent with previous reports [28] except for C. nattaiensis which exhibited reduced catches with the improved trap type. Though an increase in mean counts with green LED was observed for C. brevitarsis, the response was not significant unlike previous studies [28, 30, 40]. This may be due to the comparatively low catch rate of this species in the present study. The change in trap type was associated with detection of new Culicoides species, C. loughnani, C. (Ornatus Gp sp) #8, and C. moreensis which could be due to better detection with the improved trap type or potential blow-ins (insects arriving on the wind). The overall increase in catches for eight of most abundant species since 2016/17 may be associated with improvements to the green LED lamp design but since there was no simultaneous deployment of trap types, the increase cannot be definitively attributed to the efficiency of the trap types used.
The trend towards higher counts of C. marksi and C. austropalpalis in summer was consistent with a decline in abundance of C. marksi and C. austropalpalis with decreasing temperature in the Hunter Valley of NSW [43]. Summer is the season with the highest rainfall in the region and this may have created favourable breeding conditions for the aquatic larvae of these species [13]. In NSW, C. brevitarsis dispersal from over-wintering foci on the mid-northern/northern coastal plain was reported to occur in spring and summer [44, 45] through to near the end of autumn [46], with present findings in agreement with these observations. However, a study from the coastal plains east of the study region found that the peak season for C. brevitarsis is summer [47]. The continuous detection of C. brevitarsis in the present study, with the availability of hosts, ideal temperatures of 20-25°C during the longer day light periods in spring and summer [43] may indicate establishment of the species on the tablelands as opposed to presence based on seasonal waves of movement [46]. This proposition requires further investigation as establishment could potentially be masked by C. brevitarsis dispersal from coast [48]. The arithmetically highest catch rate of C. brevitarsis was in autumn and this may be of significance in the region as a model showed proportion of potentially infected/infective C. brevitarsis dispersing from the coast increases with length of the season [1, 37, 46, 49]. Most predictions related to the seasonal dispersal of Culicoides are based on C. brevitarsis [44, 48] and studies on the habitat requirements of the other species could provide better understanding of their seasonal dispersal in the region.
The marked preference of C. dycei, C. marksi and C. austropalpalis for the lower altitude plains and slopes is likely due to less severe winters or a combination of factors such as availability of hosts, larval habitat, climate tolerance and longevity [13, 27, 29, 30]. In support of a preference for warmer temperatures, a study on simultaneous detection of C. marksi and C. austropalpalis in the NSW and Northern Territory (NT) with green LED traps yielded more counts in warmer NT [28]. Culicoides victoriae exhibited the reverse trend suggestive of a tolerance of a wider temperature range and consistent with this, it has been reported in all eastern states [10]. A model [46, 48] on the dispersal of C. brevitarsis through coastal valleys to central and northwest parts of NSW showed a delay in detection of the species determined by distance from the coast and altitude. The results of the present study are consistent with this prediction as in most cases the first detection on the tablelands was recorded in mid-summer. Trapping sites on the tablelands are situated on the top of the Great Dividing Range (GDR) where easterly winds from the coast during autumn might have sped up the rate of dispersal and caused relatively higher mean counts of C. brevitarsis. Moreover, the detection of C. brevitarsis on the New England plains provided evidence of its rare incursion and crossing the GDR [46], however as noted above, establishment of the species in the New England region cannot be ruled out. Further investigations on the role of bioclimatic variables determining the dispersal of most abundant species collected in the present study is recommended for future modelling [29, 50].
Despite the greater abundance and richness of Culicoides species, the plain and slope subregions had lower diversity and evenness indices. This is due to the dominance of C. marksi and C. austropalpalis in these subregions. The highest species richness [18] was observed on the slopes possibly be due to water run-off from the tablelands creating favourable breeding ecosystems for the immature stages of C. austropalpalis and C. marksi [51] though a slope of more than 5° has been reported detrimental [52]. There is also an intermediate zone between the plains and tablelands with a more diverse array of potential habitats, including those suitable for species that prefer either the plains or tableland habitats. The relatively small number of C. brevitarsis on the slopes and plains [46] relative to the tablelands may be due increasing dryness and reduced availability of larval breeding habitat as the area is largely used for crop production. This would be consistent with the suggestion that the distribution of C. brevitarsis to the west of NSW is limited by the availability of moisture [53]. However, the higher prevalence on the tablelands may also simply reflect closer proximity to coastal breeding grounds with wind borne ingress onto the tablelands.
This study provides the first comprehensive list of Culicoides species found in the New England region of NSW, Australia between 1990 and 2018. Nineteen species were identified with eight of the most abundant species making up over 99% of the total trap catch. Culicoides marksi and C. austropalpalis were the most abundant and widespread species. There was a significant increase in the trapping rate of C. marksi, C. austropalpalis, C. dycei, C. victoriae, C. bunrooensis and C. bundyensis with the change to green LED lamps although this was not the case for C. nattaiensis. A trend with higher abundance was observed during the warmer seasons and at lower altitudes for C. marksi, C. austropalpalis and C. dycei indicating dispersal of these species in the New England primarily dependent on temperature and rainfall. However, no marked difference in abundance of C. brevitarsis across seasons and subregions was observed and it is unclear to what extent the species is established in the region. Further research on bioclimatic factors influencing temporal and spatial dispersal of the different Culicoides species is recommended which will assist with modelling their dispersal and the potential dispersal of arboviruses that may affect livestock and wildlife species in the future.
The authors acknowledge the many Australian cattle producers and government agency staff who collected the samples on behalf of the NAMP. A special mention is deserved by DRNSW NAMP entomologists, Harry McKenzie (1995–2012) and Nyet (Fah) Eagleton (2013-present) and Culicoides taxonomist Dr Glenn Bellis (Northern Australian Quarantine Strategy) who identified the many thousands of samples. Animal Health Australia, Canberra is also thanked for sharing with us the NAMP Culicoides data. We also thank Dr Steve Eastwood of the Armidale Local Land Services for providing the initial impetus for this publication.
1
2
3
4
5
6
7
8
9
10
11
12
13
14
15
16
17
18
19
20
21
22
23
24
25
26
27
28
29
30
31
32
33
34
35
36
37
38
39
40
41
42
43
44
45
46
47
48
49
50
51
52
53
 Spatial and temporal distribution of Culicoides species in the New England region of New South Wales, Australia between 1990 and 2018
 Facebook
 Twitter
 Linkedin
 Whatsapp

