 Significant variants of type 2 diabetes in the Arabian Region through an Integration of exome databases
PLoS ONE

Competing Interests: The authors have declared that no competing interests exist.

- Altmetric
Type 2 diabetes (T2D) is a major global health issue, and it has also become one of the major diseases in Arab countries. In addition to the exome databases that have already been established, whole exome sequencing data for the Greater Middle East are now available. To elucidate the genetic features of T2D in the Arabian Peninsula, we integrated two exome databases (gnomAD exome and the Greater Middle East Variome Project) with clinical information from the ClinVar. After the integration, we obtained 18 single nucleotide polymorphisms and found two statistically and clinically significant variants in two genes, SLC30A8 rs13266634 and KCNJ11 rs5219. Interestingly, the two genes are linked to the uptake of the metals, Zn and K respectively, which indicating the regional features of the genetic variants. The frequency of the risk allele of rs13266634 among individuals in the Arabian Peninsula was higher than among individuals in other regions. On the other hand, the frequency of the risk allele of rs5219 in the Arabian Peninsula was lower than that in other regions. We identified and characterized T2D-related variants that show unique tendencies in the Arabian Peninsula. Our analyses contribute to and provide guidance for the clinical research of T2D in the Arabian Peninsula.
Introduction
Type 2 diabetes (T2D) is a disease characterized by insulin resistance. The risk factors of T2D include not only environmental factors but also genetic factors, such as a family history of diabetes and ethnicity [1]. Some genes, including ABCC8 (ATP binding cassette subfamily C member 8), CAPN10 (calpain 10), SLC2A2 (solute carrier family 2 member 2), and GCGR (glucagon receptor) have been reported to be genetic factors associated with T2D [2]. T2D ranks among the major health issues worldwide, and it has also become one of the major diseases in Arab countries, mostly in high-income countries such as the Kingdom of Saudi Arabia and the United Arab Emirates [3]. The International Diabetes Federation estimates that the prevalence of diabetes in regions of the Middle East and North Africa region will increase from 12.8% (2019) to 15.7% (2045), and the expense for treating diabetes will increase from 24.9 billion USD to 38.6 billion USD [4].
With advancements in the development of sequencing technologies, many human genome projects for several populations are ongoing. These include the International HapMap Project [5], The Human Genome Diversity Project (HGDP) [6], and The 1000 Genomes project [7]. The Genome Aggregation Database (gnomAD) [8] is a resource of both genome and exome sequence data and gnomAD version 2.1.1 exome database provides genetic variants on eight populations (African/African-American, Ashkenazi Jewish, Finnish, Non-Finnish European, South Asian, East Asian, Latino/Admixed American, and Other). Although the populations are wide-ranging, none of the projects have provided much information on Middle Eastern populations.
In 2016, the Greater Middle Eastern Variome Project (GME Variome) was published [9]. The project provides genotype frequencies for seven populations in the greater Middle Eastern regions (Northeast Africa, Northwest Africa, the Arabian Peninsula, Israel, the Syrian Desert, the Turkish Peninsula, and Central Asia). When data from GME Variome are combined data from the gnomAD exome database, exome data corresponding to most of the world become available.
Several genome-wide association studies have been conducted on T2D [10–15], which have identified the single nucleotide polymorphisms (SNPs) associated with T2D. The information is stored in publicly available databases, such as the dbSNP and ClinVar. ClinVar provides not only SNP information but also clinical significance. The allele frequencies of some SNPs related to diseases (including T2D) are different among populations [16]. Unfortunately, most of the studies have been performed on the European and Asian populations, whereas studies on the Middle Eastern populations are limited [17–19].
To reveal the genotype features of individuals who live in the Middle Eastern regions, particularly the Arabian Peninsula, we integrated these two exome databases with the ClinVar database. We performed statistical analyses by comparing allele frequencies between the Arabian Peninsula and other regions.
Materials and methods
Integration of exome databases
The gnomAD version 2.1.1 exome data are available at https://gnomad.broadinstitute.org/downloads; and we downloaded data in the VCF format. The data included 17,209,972 variants from 125,748 samples of eight populations. The VCF file contained the rs-number, AN_POP for Allele Count, and AC_POP for Alt Allele Count for a population POP, where POP is one of the following: afr (African/African American), amr (Latino/Admixed American), asj (Ashkenazi Jewish), eas (East Asian), fin (Finnish), nfe (Non-Finish European), sas (South Asian), and oth (Other). We calculated the number of reference alleles as AN_POP–AC_POP for each variant per population.
Additionally, we downloaded GME Variome autosomal data from http://igm.ucsd.edu/gme/download.shtml. This project provides genotype frequencies of 669,953 variants on the autosomal chromosome for seven regions in the Greater Middle East (Northeast Africa, Northwest Africa, Arabian Peninsula, Israel, Syrian Desert, Turkish Peninsula, and Central Asia). The Arabian Peninsula included the following regions: Kuwait, Oman, Qatar, Kingdom of Saudi Arabia, the United Arab Emirates, and Yemen [9].
Since both databases are based on the human reference genome GRCh37/hg19, we merged the data when the chromosome number, nucleotide position, reference allele, and alternative allele were the same in both databases for each SNP. We included the alleles if the allele frequencies in each population were >0.01 to exclude rare variants. Because gnomAD data are based on populations, and GME Variome are based on their definitions; thus, we use “populations/regions” as a unit for this analysis. We disregarded the differences in allele frequencies among other populations/regions to identify important SNPs that are unique to the Arabian Peninsula population. We summed up the numbers of alleles over the populations/regions except for the Arabian Peninsula to compare allele frequencies between the Arabian Peninsula population and the other populations/regions (which will be referred to as "other regions" hereafter). In this study, we ignored the differences among populations in “other regions.”
Identification of T2D-related SNPs
To obtain T2D-related SNPs, we searched the ClinVar database (https://www.ncbi.nlm.nih.gov/clinvar/) with the keyword ‘”type 2 diabetes”[dis] OR “diabetes mellitus type 2”[dis]’. We extracted SNPs that were common among gnomAD exome, GME Variome, and the result of keyword search at the ClinVar database based on the chromosome, position, reference allele, and alternative allele. ClinVar provides clinical significance, which we used to evaluate the clinical significance of SNPs.
Statistical analyses
To compare the allele frequencies and genotype frequencies between the Arabian Peninsula and other regions, we divided the data into the Arabian Peninsula and the other regions.
The observed number of each allele in the Arabian Peninsula was calculated as follows:


For the other regions, the calculation was as follows:


Then, the expected allele counts in the Arabian Peninsula were calculated as follows:


Additionally, we calculated the expected values for the genotype count using the same method. These expected allele counts represented the allele counts when the allele frequencies of each population were equal.
We performed Fisher’s exact test for each SNP to identify statistically significant SNPs that were not independent for the population, allele counts, or genotype counts. The Benjamini–Hochberg method was used with a q-value of 0.05 for the correction of multiple tests. For SNPs that were statistically significant, we further examined them using a residual analysis to reveal the differences between the observed counts and expected counts.
Results and discussion
Integration of gnomAD exome and GME Variome
Before the GME Variome data became available, genotype data for the Middle Eastern populations were scarce. In 2016, an exome project on the Greater Middle Eastern region was finally published [9], which allowed for analyses of worldwide genotype data including Middle Eastern populations by integrating gnomAD exome and GME Variome data.
We downloaded 17,209,972 and 669,953 variants from gnomAD exome and GME Variome, respectively. We merged the genotype information for gnomAD exome and GME Variome and obtained 475,239 variants for 15 populations/regions. After eliminating the rare variants, we obtained 195,718 variants (Fig 1a). Then, we summed up the numbers of alleles for the Arabian Peninsula and other regions and calculated the expected value for each variant. The allele frequency spectra of overlapped variants showed similar tendencies among the Arabian Peninsula and other regions (S1a Fig) and also among each population/region (S1b Fig).

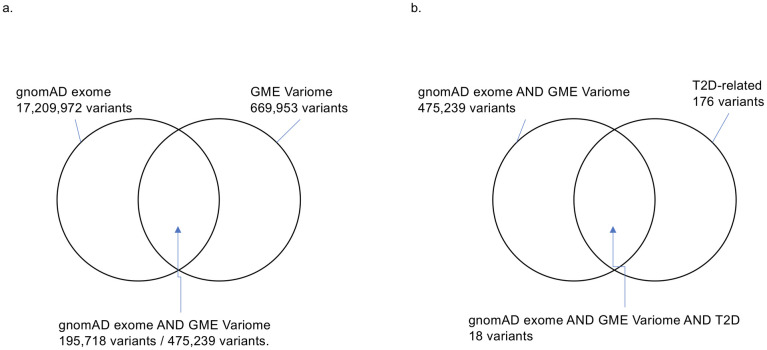
Number of variants.
(a) The intersection between the gnomAD exome and GME Variome data. 475,239 variants commonly exist in two databases. After the eliminating rare variants, 195,718 variants remained. (b) Intersection among the gnomAD exome, GME Variome, and T2D-related variants.
Significant T2D-related SNPs in the Arabian Peninsula
In addition to the genotype data, we integrated clinical information via ClinVar to reveal genetic features related to T2D. We downloaded 176 T2D-related variants from ClinVar as of January 17, 2021. Only 18 SNPs were common among the three databases (Table 1 and Fig 1b). To identify SNPs that were specifically biased in the Arabian Peninsula subpopulations, we performed Fisher’s exact test on these 18 SNPs. Even though the variants were mainly derived from populations outside of the Middle East, we found that six SNPs were statistically significant (Table 2). Two of the six SNPs were clinically significant, as described below. Among the two statistically and clinically significant SNPs, residual analysis revealed that a variant, rs13266634, increased the number of the risk allele (Fig 2).
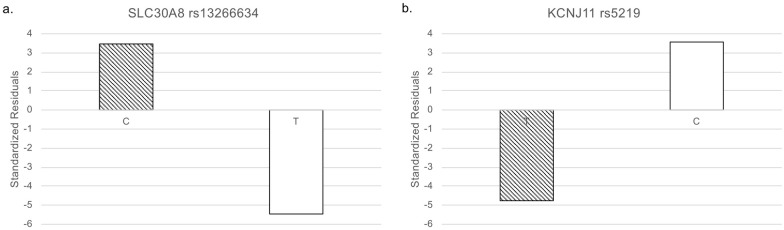
Standardized residuals of alleles.
White: non-risk allele and diagonal stripes: risk allele. (a) SLC30A8 rs13266634. (b) KCNJ11 rs5219.

| rs-number | Chr | Position | REF | ALT | Change | gene | protein | Clinical significance |
|---|---|---|---|---|---|---|---|---|
| rs41265094 | 2 | 227661003 | C | G | c.2452G>C (p.Gly818Arg) | IRS1 | insulin receptor substrate 1 | Likely benign |
| rs1801276 | 2 | 227661921 | C | G | c.1534G>C (p.Ala512Pro) | IRS1 | insulin receptor substrate 1 | Benign |
| rs1044498 | 6 | 132172368 | A | C | c.517A>C (p.Lys173Gln) | ENPP1 | ectonucleotide pyrophosphatase/phosphodiesterase 1 | Benign |
| rs1799999 | 7 | 113518434 | C | A | c.2713G>T (p.Asp905Tyr) | PPP1R3A | protein phosphatase 1 regulatory subunit 3A | Uncertain significance |
| rs13266634 | 8 | 118184783 | C | T | c.973C>T (p.Arg325Trp) | SLC30A8 | solute carrier family 30 member 8 | risk factor |
| rs5219 | 11 | 17409572 | T | C | c.67A>G (p.Lys23Glu) | KCNJ11 | potassium inwardly rectifying channel subfamily J member 11 | drug response |
| rs566325901 | 12 | 121177120 | A | G | c.1108A>G (p.Met370Val) | ACADS | acyl-CoA dehydrogenase short chain | Conflicting interpretations of pathogenicity |
| rs121434581 | 17 | 7189048 | G | A | c.1147G>A (p.Val383Ile) | SLC2A4 | solute carrier family 2 member 4 | Uncertain significance |
| rs1801483 | 17 | 79767715 | G | A | c.118G>A (p.Gly40Ser) | GCGR | glucagon receptor | Benign |
| rs41309435 | 19 | 40741862 | C | A | c.1110G>T (p.Pro370 =) | AKT2 | AKT serine/threonine kinase 2 | Benign |
| rs776435289 | 19 | 40743996 | C | G | c.711G>C p.Leu237 =) | AKT2 | AKT serine/threonine kinase 2 | Likely benign |
| rs199761368 | 19 | 40744854 | G | A | c.666C>T (p.His222 =) | AKT2 | AKT serine/threonine kinase 2 | Benign |
| rs139125633 | 19 | 40761070 | G | A | c.282C>T (p.Asp94 =) | AKT2 | AKT serine/threonine kinase 2 | Likely benign |
| rs35588791 | 19 | 40762915 | G | A | c.93C>T (p.Ser31 =) | AKT2 | AKT serine/threonine kinase 2 | Benign |
| rs1799816 | 19 | 7125518 | C | T | c.3034G>A (p.Val1012Met) | INSR | insulin receptor | Conflicting interpretations of pathogenicity |
| rs142204928 | 20 | 43043159 | G | A | c.439G>A (p.Val147Ile) | HNF4A | hepatocyte nuclear factor 4 alpha | Conflicting interpretations of pathogenicity |
| rs147638455 | 20 | 43058267 | A | G | c.1321A>G (p.Ile441Val) | HNF4A | hepatocyte nuclear factor 4 alpha | Uncertain significance |
| rs2076026 | 20 | 43942676 | T | C | c.759T>C (p.Ala253 =) | RBPJL | recombination signal binding protein for immunoglobulin kappa J region like | Benign |
Positions are on the Assembly GRCh37. Clinical significance is based on ClinVar. Chr: Chromosome number, REF: Reference allele, ALT: Alternative allele, Change: Substitutions of nucleotide and amino acid.
| Allele Count | Genotype Count | |||||||||||
|---|---|---|---|---|---|---|---|---|---|---|---|---|
| rs-number | Observed | Expected | Fisher | Observed | Expected | Fisher | ||||||
| REF | ALT | REF | ALT | REF/REF | REF/ALT | ALT/ALT | REF/REF | REF/ALT | ALT/ALT | |||
| rs41265094 | 342 | 0 | 339 | 3 | 0.249 | 171 | 0 | 0 | 168 | 3 | 0 | 0.248 |
| rs1801276 | 342 | 0 | 337 | 5 | 0.062 | 171 | 0 | 0 | 166 | 5 | 0 | 0.061 |
| rs1044498 # | 245 | 97 | 275 | 67 | 0.009 | 92 | 61 | 18 | 115 | 45 | 11 | 0.037 |
| rs1799999 | 285 | 57 | 267 | 75 | 0.099 | 117 | 51 | 3 | 109 | 49 | 13 | 0.039 |
| rs13266634 *#§ | 298 | 44 | 244 | 98 | 0.000 | 130 | 38 | 3 | 88 | 68 | 15 | 0.000 |
| rs5219 *#§ | 70 | 272 | 123 | 219 | 0.000 | 12 | 46 | 113 | 23 | 76 | 72 | 0.000 |
| rs566325901 | 341 | 1 | 341 | 1 | 1.000 | 170 | 1 | 0 | 170 | 1 | 0 | 1.000 |
| rs121434581 | 337 | 5 | 341 | 1 | 0.217 | 167 | 3 | 1 | 170 | 1 | 0 | 0.371 |
| rs1801483 #§ | 225 | 15 | 238 | 2 | 0.002 | 106 | 13 | 1 | 118 | 2 | 0 | 0.003 |
| rs41309435 | 342 | 0 | 341 | 1 | 1.000 | 171 | 0 | 0 | 170 | 1 | 0 | 1.000 |
| rs776435289 | 342 | 0 | 342 | 0 | 1.000 | 171 | 0 | 0 | 171 | 0 | 0 | 1.000 |
| rs199761368 | 341 | 1 | 341 | 1 | 1.000 | 170 | 1 | 0 | 170 | 1 | 0 | 1.000 |
| rs139125633 | 342 | 0 | 342 | 0 | 1.000 | 171 | 0 | 0 | 171 | 0 | 0 | 1.000 |
| rs35588791 | 342 | 0 | 341 | 1 | 1.000 | 171 | 0 | 0 | 170 | 1 | 0 | 1.000 |
| rs1799816 | 335 | 7 | 339 | 3 | 0.340 | 164 | 7 | 0 | 168 | 3 | 0 | 0.337 |
| rs142204928 | 341 | 1 | 341 | 1 | 1.000 | 170 | 1 | 0 | 170 | 1 | 0 | 1.000 |
| rs147638455 #§ | 331 | 11 | 342 | 0 | 0.001 | 160 | 11 | 0 | 171 | 0 | 0 | 0.001 |
| rs2076026 # | 329 | 13 | 311 | 31 | 0.007 | 159 | 11 | 1 | 143 | 25 | 3 | 0.016 |
Interestingly, for rs13266634, the homozygous risk genotype increased whereas the heterozygous genotype decreased in the Arabian Peninsula (Fig 3). The remaining SNP was rs5219. The number of this risk allele decreased in the Arabian Peninsula (Fig 2).
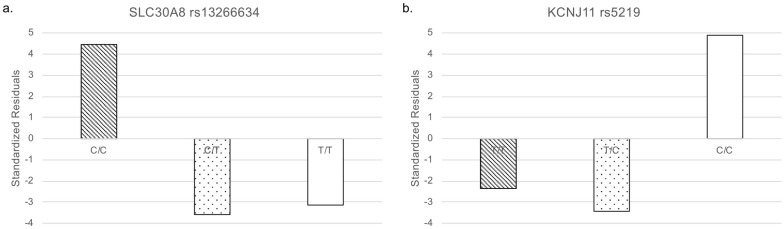
Standardized residuals of genotypes.
White: homozygote non-risk alleles, dotted: heterozygote, and diagonal stripes: homozygote of risk alleles. (a) SLC30A8 rs13266634. (b) KCNJ11 rs5219.
The numbers of alleles and numbers of genotypes were tested. In the rs-number column, * represents the clinically significant SNP, # represents statistically significant SNP according to Fisher’s exact test the allele count, and § represents statistically significant SNP by Fisher’s exact test using the genotype count. The Benjamini–Hochberg method was used with a q-value of 0.05 for the correction of multiple tests. Observed and expected numbers of alleles and genotypes are shown. REF: reference allele, ALT: alternative allele, REF/REF: homozygote of reference allele, REF/ALT: heterozygote, ALT/ALT: homozygote of alternative allele, Fisher: p-value of Fisher’s exact test.
SLC30A8 rs13266634
rs13266634 is located on chromosome 8 (8q24.11) in the SLC30A8 gene, which encodes solute carrier family 30 member 8. It is also known as Zinc Transporter 8 (ZnT8). Zinc plays an important role in insulin processing and storage. ZnT8 is specifically expressed in the pancreas and transports Zn2+ from the cytosol to the insulin-secreting granules. A nonsynonymous variant, rs13266634, is enriched in diabetic patients. This SNP changes a tryptophan residue into to an arginine residue (R325W). R325 carriers have an increased risk of developing T2D [20].
The frequency of the risk allele of rs13266634 is higher in the Arabian Peninsula than in other regions. The frequency of the homozygote of this risk allele has increased in the Arabian Peninsula compared with that in the other regions. However, the frequency of the heterozygote has decreased in the Arabian Peninsula compared with that in the other regions. Our results suggest that this SNP is fixed to the risk allele for T2D among individuals residing in the Arabian Peninsula.
KCNJ11 rs5219
rs5219 is located on chromosome 11 (11p15.1) in the KCNJ11 gene. The KCNJ11 and ABCC8 genes are next to each other and encode potassium voltage-gated channel subfamily J member 11 and ATP binding cassette subfamily C member 8. The KCNJ11 and ABCC8 proteins in the ATP-sensitive potassium (KATP) channel mediate insulin secretion. The rs5219 may alter the charge of the ATP binding region and decrease channel sensitivity [21]. The rs5219 polymorphism is a risk factor for developing T2D in Caucasians and in some Asian populations [21]. East Asian populations were more prone to this disease, as the risk allele (A) was more common in most East Asian patients than in the controls [21].
The frequency of the risk allele of rs5219 in the Arabian Peninsula is lower than that in other regions. Our data revealed that the risk for this SNP is low among individuals from the Arabian Peninsula.
Conclusion
In this study, we found that two clinically significant T2D-related SNPs were statistically significant in the Arabian Peninsula. These SNPs are located in genes that are associated with metal uptake. Imbalance levels of essential trace metals affect T2D [22], and our results infer that metals may be one of the factors for the development of T2D for individuals in the Arabian Peninsula. It is well-known that dates, a popular fruit in the Arabian Peninsula, contain plenty of minerals. Our results show that there were deviations in the allele frequencies among the Arabian Peninsula and other regions. The integrated dataset is useful to find such genetic deviations among populations. Our analyses contribute to and provide guidance for clinical research of type 2 diabetes in the Arabian Peninsula populations. Our approach could elucidate the genetic features of other populations and diseases with known SNPs and novel SNPs from future studies such as GWAS, which will be helpful for future studies and clinical applications.
Acknowledgements
We would like to thank Ms. Alea A. A. Almohammed-Hussain for the early stage of this research.
References
1
2
3
4
5
6
7
8
9
10
11
12
13
14
15
16
17
18
19
20
21
22