
Competing Interests: The authors have declared that no competing interests exist.
Younger age at menarche (AAM) is associated with higher body mass index (BMI) for young women. Considering that continuous trends in decreasing AAM and increasing BMI are found in many countries, we attempted to assess whether the observed negative association between AAM and young adult BMI is causal. We included 4,093 women from the Korean Genome and Epidemiology Study (KoGES) and Healthy twin Study (HTS) with relevant epidemiologic data and genome-wide marker information. To mitigate the remarkable differences in AAM across generations, we converted the AAM to a generation-standardized AAM (gsAAM). To test causality, we applied the Mendelian randomization (MR) approach, using a genetic risk score (GRS) based on 14 AAM-associated single nucleotide polymorphisms (SNPs). We constructed MR models adjusting for education level and validated the results using the inverse-variance weighted (IVW), weighted median (WM), MR-pleiotropy residual sum and outliers test (MR-PRESSO), and MR-Egger regression methods. We found a null association using observed AAM and BMI level (conventional regression; -0.05 [95% CIs -0.10–0.00] per 1-year higher AAM). This null association was replicated when gsAAM was applied instead of AAM. Using the two-stage least squares (2SLS) approach employing a univariate GRS, the association was also negated for both AAM and gsAAM, regardless of model specifications. All the MR diagnostics suggested statistically insignificant associations, but weakly negative trends, without evidence of confounding from pleiotropy. We did not observe a causal association between AAM and young adult BMI whether we considered the birth cohort effect or not. Our study alone does not exclude the possibility of existing a weak negative association, considering the modest power of our study design.
There is good evidence to consider menarche as important for understanding young adulthood obesity [1, 2]. Menarche is a landmark in the female reproductive timespan. It is often preceded by a weight growth spurt during adolescence. A decline in the age at menarche (AAM) has been globally observed for the past 50 years [3–5] coinciding with the obesity epidemic. Girls that experienced early menarche have been observed more prone to overweight/obesity [6]. Previous studies have shown that later spontaneous recovery of obesity established in early life is not common [1, 7]. It is worth noting that, even in the context of dramatic increase in childhood obesity since the 1990s [8], most of obese individuals reported their onset of obesity as age of 17‒18 [1]. Such evidence elicits that young adulthood (18–25 years old) obesity, rather than childhood obesity, substantially influences obesity in later life. It also aligns with the hypothesis that menarche as the marked event of female puberty which occurs at an average age of 12 years, may cause obesity in young adulthood for females.
Mendelian randomization (MR) is an established epidemiological method to infer a causal relationship between risk factors and health outcomes [9], by utilizing a genetic instrumental variable (IV) that is robustly associated with the risk factor. Owing to the random independent assortment of alleles during meiosis, genetic variants with biological effects on risk factors are free from possible confounding factors. Moreover because the transmitted germline genome cannot be affected by health outcomes, it should not be biased by reverse causality [9].
Given that the tendency toward a decrease in AAM is still in progress, identifying the causal relationship between AAM and young adult obesity is crucial for obesity control [10, 11]. This study aimed to assess the causal relationship between AAM and young adult body mass index (BMI). In evaluating the causal association between AAM and young adult obesity, birth cohort effects matter not only for the AAM, but for social determinants such as the length of education. Thus, using these covariates without considerations of birth cohort effects may result in biased estimations. For example, the average AAM decreased from 16.9 years for women born between 1920–1925 and to 13.8 years for those born between 1980–1985 [3]. The proportion of women with higher than upper-secondary education (corresponding to high school in most countries) increased from < 5% for women born in 1926, to 95% for those born in 1970 in South Korea [12]. Given the inverse association between education level and the risk of young adulthood obesity [13, 14], this transitional change in education level may confound the association between AAM and young adult BMI. To address the problem of complex confounding structures, we attempted to introduce a generation-standardized estimation for both AAM and the length of education, using a transgenerational approach. In this study, we estimated the unconfounded causal association of AAM with young adult BMI through the MR approach, using generation-standardized measures.
The Korean Genome and Epidemiology study (KoGES, http://www.nih.go.kr/NIH/eng/main.jsp) is a community-based prospective cohort study started in 2001, and comprised of 3 sub-cohorts (rural, urban, Ansan-Ansung (KARE)) differing in residential areas of the participants [15]. The Healthy Twin Study (HTS) is a nationwide twin-family cohort study which started in 2005 [16]. Both studies recruited participants of Korean ancestry based on a shared protocol to allow pooled analysis. Detailed study protocols and information have been previously described. From both studies, we only included female participants with epidemiological and genotype information available.
We defined AAM as age in years at the onset of menstruation. Year of birth, age at menarche, and the highest educational attainment, were obtained from self-reported questionnaires. The highest level of educational attainment was categorized into 5 levels: “under elementary school”, “elementary school”, “middle school”, “high school”, and “university/college or higher”. Height measured at enrollment and self-reported body weight at 18–20 years were used to calculate the young adulthood BMI (kg/m2). We restricted our analysis to a subset of participants with information on young adulthood BMI. The differences in study variables between the overall population (N = 10,000) and the subset with young adulthood BMI available (N = 4,903) were minimal (S1 Table). The protocol of this study is approved by the Institutional Review Board of Gangnam CHA Hospital (IRB NO: GCI-17-37).
We constructed birth cohorts to reflect changes in the distribution of AAM, which has a similar AAM distribution within the year of birth. For example, we started from the birth year of 1927, where the AAM under 14 years was 5.08%, and expanded the birth cohort to include the next recent birth years to as far as the cumulative proportion of AAM under 14 years of the birth cohorts was maintained between 5 and 6%. The end point of the birth cohort was selected when EM at the K-birth year showed more than a 2% difference from that of the (K+1) birth year. These steps were repeated until the last birth year resulted in four birth cohorts (1927–1945, 1946–1969, 1970–1978, and 1979–2003) (S2 Table).
To control for the effect of different birth cohorts, we developed a generation-standardized measure of AAM (gsAAM) and education level. We calculated the z-score of AAM taking individual AAM minus average AAM of the birth year, divided by the standard deviation, where both the averages and standard deviations of AAM were derived from a large population data from the Korea National Health and Nutrition Examination Survey (KNHANES, https://knhanes.cdc.go.kr/knhanes), 2001–2017.
We created an indicator for the relative level of education (“highly educated”) as a proxy for socioeconomic status, to allow us to consider the generation gap in educational attainment (S3 Table). The relative definition of those highly educated within each cohort was varied across birth cohorts: elementary school or higher for 1927–1945, high school or higher for 1946–1969, university/college or higher for both 1970–1978 and 1979–2003 (S1 Fig).
The KoGES and HTS participants were genotyped using Illumina Omni1 (KoGES, rural), Affymatrix 6.0 (KoGES, urban; HTS) and 5.0 (KoGES, KARE) genotyping arrays. The single nucleotide polymorphisms (SNPs) were filtered by following genotype quality control (QC) criteria: (1) genotyping call rate >0.95 (2) minor allele frequency (MAF) >0.01, (3) P value in Hardy–Weinberg equilibrium (HWE) testing >10e-6 and individual QC criteria: sample call rate >0.9. Those after QC were imputed using the Korean data from Korean Reference Genome (KRG) which initiated by Center of Genome Science (CGS) of Korea National Instituted of Health (KNIH) in 2012 [17] and East Asian (EAS) data from the 1,000 Genomes Project Phase 3 (NCBI build 37) as the reference. We used IMPUTE 2.0 software to impute variants that were not directly genotyped [18]. Only SNPs with INFO score larger than 0.6 were included.
Among 367 SNPs reported to be associated with AAM from a previous study [19], 297 were available in our genotype data, and 15 SNPs were replicated at a significance level of 0.05 with directional consistency of association. One SNP, rs7132908, located at FAIM2, was excluded because it showed a pleiotropic effect with adulthood BMI [20]. Finally, 14 SNPs were selected to build the GRS representing earlier menarche: rs157877 (RXRG), rs643428 (SSBP3), rs142058842 (NR4A2), rs4588499 (GABRG1), rs3113862 (SMARCAD1), rs1428120 (GALNT10), rs13233916 (TTC26), rs7115444 (C11orf67), rs4945266 (GAB2), rs4402316 (DLG2), rs7114175 (C11orf63), rs3764002 (WSCD2), rs10143972 (UNC79), rs12915845 (DET1) (S4 Table). Childhood BMI, a potential confounder of the effect of AAM on young adulthood BMI, did not show any association at statistical significance (P < 1.0 x 10⁻⁵) with the selected 14 SNPs according to the GWAS catalogue [21].
We tested whether each SNP included in the GRS and GRS as a whole satisfied the assumptions of the MR method [22]. The underlying assumptions of valid IVs are: 1) the IV has a significant association with the exposure; 2) the IV is not related to any other confounders; and 3) the IV is only related to the outcome through the exposure. F-statistics and R2 values were used to ensure that the genetic marker was strongly associated with the risk exposure. Generally, an F-statistic larger than 10 is quoted to reduce the weak instrument bias [23, 24]. The association between risk exposure and GRS quartiles was also examined for convenience of interpretation. To test the second IV assumption of independent association between the genetic IV and young adulthood BMI, the frequencies of potential confounders per risk allele-increase were examined.
For conventional epidemiological analyses, linear regressions were performed to examine the relationship between AAM and young adulthood BMI observationally. We constructed 4 different regression models with varied groupings of birth cohort and education as follows:
Model 1: BMIyoung adult = AAMyear + Year of birth + Educational level + ℇ
Model 2: BMIyoung adult = AAMyear + Birth cohort (defined by AAM distribution) + Educational level (generation-adjusted) + ℇ
Model 3: BMIyoung adult = gsAAM+ Educational level + ℇ
Model 4: BMIyoung adult = gsAAM + Educational level (generation-adjusted) + ℇ
Birth cohort variables were treated as dummy variables in the regression models. This analysis was performed using R (The R Foundation, version 3.3.1). We investigated the causal effect of AAM on young adulthood BMI using the two-stage least squares (2SLS) regression, under an additive model assumption through the MR approach [25]. GRS was categorized into quartiles in the first regression of 2SLS for convenience of interpretation. We applied the same four models as in the conventional analyses. The standard error of the 2SLS regressions was obtained by bootstrapping (1000 replications). All MR analyses were performed using STATA version 14 (StataCorp LLC, College Station, Texas).
Implementing the MR analysis without considering pleiotropy effects could lead to bias. To confirm that the IV shows a consistent association with the outcome without the condition of exposure (horizontal pleiotropy), the adjusted MR method using summary data estimation: weighted median(WM) and MR-Egger method using the R package ‘Mendelian Randomization’ [26] and MR-PRSSO using the R package ‘MR-PRSSO’ were employed [27]. The inverse variance weighted (IVW) method calculates the weighted mean using the inverse variance of each SNP to minimize the variance effect [28]. IVW theoretically provides asymptotically equal results from the 2SLS regression when each SNP is fully uncorrelated. The results from IVW are used as a reference compared to other adjusted MR methods. The WM method is a robust estimator that provides consistent estimates even if up to 50% of IVs are invalid [29]. The MR-Egger method is based on Egger’s regression, which is used for adjusting publication bias in meta-analyses [30]. The difference in the intercept term from the origin gives evidence of the average pleiotropic effect in IV used in MR. The coefficient from the MR-Egger regression was used to explore whether the causal effect remains after adjusting for the pleiotropic effect. Scatter plots of summary data estimation were used to graphically interpret the validity of the slope estimates and the intercept of the MR-Egger regression. Cochran’s Q statistics indicating heterogeneity of SNPs [31] were estimated.
To further investigate the influence of AAM on BMI-related traits, we performed additional analyses for non-alcoholic fatty liver disease (NAFLD) and Homeostatic Model Assessment for Insulin Resistance (HOMA-IR). Using the MR-Base (http://www.mrbase.org), a public database and analytic platform of multi-instrument MR [32], the causal association of AAM with NAFLD and HOMA-IR were investigated. Dataset for exposure AAM was selected from GWAS-catalogue [21, 33] and those for NAFLD and HOMA-IR were from prior genome-wide association studies [34–44]. Linkage disequilibrium (LD) clumping method was applied in the process of selecting SNPs to be included. As in our primary analysis, IVW, WM and MR-Egger method was used in two-sample MR analysis.
In the three Korean cohort studies (KHANES, KoGES, HTS), the proportion of those who reported AAM < 12 was 5–8% in the 1970s group and was 40% in the 1990s group. Mean AAM decreased from 16.6 in women born in 1929–1945 to 12.4 in those born in 1979–1994 (Table 1). We tested the association of educational attainment with young adulthood BMI and AAM (S5 Table and S3 Fig). Overall, AAM decreased with higher educational attainment except the youngest generations (born in 1979―2003). Young adult BMI was lower with higher education attainment groups. Young adulthood BMI was generally higher in the older generations (P for trend < 0.01) (S4 Fig).

| Birth Cohort | 1927–1945 (N = 690) | 1946–1969 (N = 2,879) | 1970–1978 (N = 367) | 1979–2003 (N = 157) | P for difference** | P for trend*** |
|---|---|---|---|---|---|---|
| Variables | Mean/N (SD/%) | Mean/N (SD/%) | Mean/N (SD/%) | Mean/N (SD/%) | ||
| Age at menarche, years | 16.52 (1.95) | 15.18 (1.86) | 13.29 (1.35) | 12.43 (1.48) | <0.01 | <0.01 |
| Generation-standardized age at menarche (z-score) | 0.07 (1.05) | -0.01 (1.03) | -0.21 (0.92) | -0.12 (0.98) | <0.01 | <0.01 |
| Young adulthood BMI, kg/m2 | 21.84 (3.25) | 20.49 (2.56) | 19.45 (3.21) | 20.61 (4.03) | <0.01 | <0.01 |
| University graduation (%) | 28 (4.01%) | 443 (15.39%) | 188 (51.23%) | 85 (54.14%) | <0.01 | <0.01 |
| Highly educated (%)* | 438 (63.48%) | 1665 (57.83%) | 188 (51.23%) | 85 (54.14%) | <0.01 | <0.01 |
SD, Standard deviation; BMI, Body Mass Index.
*Relatively higher education within the cohort, i.e. in 1929–1945, ≥elementary school graduation, in 1946–1969, ≥high school graduation, and in 1970–1994, ≥university graduation.
**Statistical difference test was done with analysis of variance (ANOVA) test for continuous variables and chi-square test for categorical variables.
***Statistical trend test was done with linear regression for continuous variables and Cochran-Armitage trend test for categorical variables
We tested GRS to ensure that a higher GRS represents a younger AAM and thus functions as an IV (Table 2). Both AAM in years and gsAAM changed by -0.08 and -0.04 as GRS increased by one unit (both P <0.01). The F-statistics of GRS on AAM was 57.52, indicating that this can be strong IV for younger AAM. The associations between GRS and potential confounders were close to null (S6 Table).
| Coefficients per 1 unit-increase [95% CI] | P | F-statistics | Coefficients per 1 quartile-increase [95% CI] | P | F-statistics | |
|---|---|---|---|---|---|---|
| Age at menarche, years | -0.08 [–0.10, -0.06] | <0.01 | 57.52 | -0.11 [–0.14, -0.07] | <0.01 | 34.48 |
| Generation-standardized age at menarche, z- score | -0.04 [-0.05, -0.03] | <0.01 | 54.13 | -0.05 [-0.07, -0.03] | <0.01 | 32.50 |
CI, confidence interval.
In conventional analyses, higher AAM in year was associated with lower young adulthood BMI (coefficient: -0.05, 95% confidence intervals [CI]: -0.10–0.00; P = 0.04; Table 3). This association was not consistently observed in other models, including those that applied the gsAAM, indicating that the results of conventional analysis could be confounded by how adjustments were selected. In the 2SLS analysis, the associations of both AAM and gsAAM with young adulthood BMI were not demonstrated. However, the results showed consistent trend of negative estimates, in all types of model specifications (Fig 1).

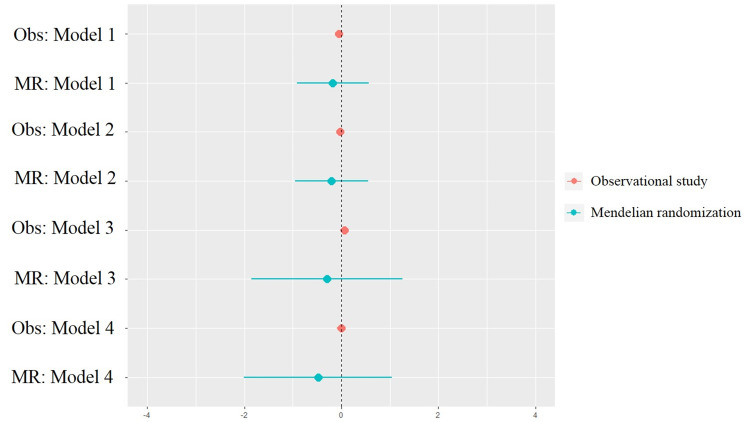
Forest plot of observational analysis and Mendelian randomization analysis.
Observational analysis, Obs; Mendelian randomization analysis, MR.
| Observational analysis | Conventional Mendelian Randomization (2SLS) | |||||
|---|---|---|---|---|---|---|
| Coefficients [95% CI] | P | R2 | Coefficients [95% CI] | P | R2 | |
| Model 1 | -0.05 [-0.10, -0.00] | 0.04 | 0.08 | -0.18 [-0.91,0.56] | 0.64 | 0.08 |
| Model 2 | -0.03 [-0.08, 0.02] | 0.28 | 0.08 | -0.20 [-0.95, 0.55] | 0.59 | 0.08 |
| Model 3 | 0.06 [-0.02, 0.15] | 0.15 | 0.02 | -0.30 [-1.85, 1.26] | 0.71 | 0.02 |
| Model 4 | -0.003 [-0.09, 0.09] | 0.93 | 0.03 | -0.48 [-2.01, 1.04] | 0.54 | 0.03 |
CI, confidence interval.
Column 1–3 is the result of Observational analysis of AAM and young adulthood BMI and column 4–6 is the result of 2SLS (conventional MR) analysis. Model 1: BMIyoung adult = AAMyear + Year of birth + Education level + ℇ; Model 2: BMIyoung adult = AAMyear + Birth cohort (defined by AAM distribution) + Highly educated + ℇ; Model 3: BMIyoung adult = gsAAM + Educational level + ℇ; Model 4: BMIyoung adult = gsAAM + Highly educated + ℇ.
Using the adjusted MR methods (WM, MR-Egger, and MR-PRSSO), we observed larger negative estimates notwithstanding without statistical significances than that from observational studies (Table 4). The intercept estimated from the MR-Egger regression model for AAM (intercept = -0.00, 95% CI: -0.18, 0.18) and gsAAM (intercept = 0.00, 95% CI: -0.18, 0.18) showed no difference from the origin, suggesting that the average pleiotropic effect of SNPs used did not influence the results of the MR analysis. The scatter plot of genetic association with risk factors and outcomes indicated no bias from pleiotropy (S5 Fig). As the Cochran’s Q statistics estimated with 14 SNPs used for GRS indicated heterogeneity between SNPs, we performed the same regression after excluding rs1428120, which showed heterogeneity with other SNPs (S7 Table). The adjusted MR result without rs1428120 was consistent with the result showing heterogeneity.
| AAM | gsAAM | |||||
|---|---|---|---|---|---|---|
| MR method | Coefficients [95% CI] | P-value | Cochran’s Q (P value) | Coefficients [95% CI] | P-value | Cochran’s Q (P value) |
| Conventional MR | ||||||
| IVW | -0.71 [-1.71,0.30] | 0.17 | 26.59 (0.01) | -1.27 [-3.04, 0.50] | 0.16 | 26.47 (0.01) |
| Adjusted MR | ||||||
| Weighted median (WM) | -0.48 [-1.55,0.60] | 0.38 | NA | -0.86 [-0.28,1.04] | 0.38 | NA |
| MR-Egger | -0.72 [-3.40,1.93] | 0.59 | 26.59 (0.01) | -1.30 [-6.01, 3.46] | 0.59 | 26.47 (0.01) |
| (MR-Egger intercept) | 0.00 [-0.18,0.18] | 0.99 | 0.00 [-0.18, 0.18] | 0.99 | ||
| MR-PRESSO | -0.71 [-1.70,0.29] | 0.18 | NA | -1.27 [-3.04, 0.50] | 0.18 | NA |
IVW, Inverse variance weighted; CI, confidence interval; AAM, age at menarche; gsAAM, generation-standardized age at menarche.
IVW was used as a reference to compare results with adjusted MR methods.
We observed a null association between AAM and NAFLD/HOMA-IR which is consistent with the MR result for adult BMI (S8 Table).
Our study suggests that younger AAM may not be causally associated with BMI in young adulthood. The weak but consistently negative association between the AAM and young adulthood BMI in various MR sensitivity analyses, however, also might suggest a negative association, given the relatively low study power. To reflect the evident secular changes in AAM and educational attainment, we redefined birth cohorts, classifying the participants so that the AAM distributions were similar across birth cohorts. The inverse relationship (earlier menarche associated with higher BMI in young adulthood) reported in observational studies may have been confounded by the secular change of AAM. This notion is supported by the result of 2SLS analysis. Interpretations of the MR analysis requires caution because all the MR models and their adjusted diagnostic models suggest weak but constantly negative associations between AAM and young adulthood BMI. Considering the limited power of the study, we do not conclude that a negative association exist between AAM and young adulthood BMI. Overall, our study suggests a null association, but ours does not exclude the possibility that AAM is one of the determinants of young adulthood obesity, but at least it is not likely that AAM be a major determinant even if so. While the relationships between early puberty and childhood and/or post-pubertal obesity have been investigated, these have not been thoroughly explicated to explain how birth cohort effects may influence the association. To the best of our knowledge, this study is the first to consider generational differences in AAM in exploring the causal association between AAM and young adulthood BMI.
The NAFLD and HOMA-IR are strongly associated with BMI [45, 46]. Also, several observational studies reported that earlier menarche is associated with a higher risk of NAFLD and insulin resistance, independent of young-adult BMI [47, 48]. We tried to explore the causal association of AAM and NAFLD/HOMA-IR in public database. The null association between AAM and NAFLD/HOMA-IR was observed which indicates that AAM does not affect the incident of NAFLD/high HOMA-IR even through obesity.
According to Gill et al. [49], earlier AAM was causally associated with higher adult BMI, even pleiotropic SNPs that were also associated with childhood BMI were excluded. Yet, in another MR study, the inverse association of AAM with BMI at age 18 years was negated when adjusted for childhood BMI [50]. There is another evidence that childhood BMI roles as a confounder of effects of AAM on adulthood BMI [51, 52]. In the 1950s cohort study, the inverse association of AAM with adulthood obesity was not explained by the confounding effect of early childhood BMI [53] and was not replicated in the Australian cohort [54]. The effect of childhood BMI on AAM is somewhat evident but it is still unclear that earlier AAM is one of the cause of young adulthood obesity [55, 56]. The inconsistency between studies may be attributed to the different population distributions in adulthood BMI and AAM.
Given that the trend of AAM in Korea over generations are more dramatically decreased compared to that in western countries and similar patterns are observed worldwide in generational prevalence of childhood obesity [57–59], generational trend of AAM in Korea is not thought to be only caused by increasing childhood obesity. The gap between the trend of AAM and childhood obesity make it necessary to consider the generation effect in the study of causal association between AAM and young adulthood BMI.
The impact of demographic changes over time at a population level has not been explored in previous studies [10, 60]. In the setting of rapid socioeconomic changes, such as in Korea, the historical association between young adulthood obesity and early menarche would not have been evident. We postulated that old Korean women who survived the Korean War had experienced a delayed onset of menarche due to the stressful circumstances, despite most having sufficient body weight to initiate the menstrual cycle [61]. In contrast, in the younger generations, social pressure to maintain a low or normal body weight may have contributed to an overall lower average young adulthood BMI, compared to older women [62, 63]. Individual socioeconomic factors may also confound the association between the timing of menarche. Moreover, SES factors have changed across generations, which further necessitates deciphering the generation effect.
There are a few limitations to this study. First, there may be possibility of recall biases. Those who were obese at the time of the survey might have overestimated their weight in childhood, assuming that they maintained a similar body shape in the past. However, a number of previous studies revealed that self-reported past body weights can provide reliable estimates independent of current weight status [20, 64]. Second, a potential pleiotropic effect may have existed between AAM and young adulthood BMI via residual associations from SNPs not included in the study. As genetic architecture of childhood adiposity and AAM is highly overlapped [19], using subset of AAM SNPs which is only associated with AAM not with childhood adiposity as IV does not assure that the confounding effects of childhood obesity is fully removed. Although we examined most of the established genes and the presence of pleiotropy of IV, there could be a possibility of remaining effect by other genes that were not included in the study. However, we believe this effect would be minimal given the high genetic homogeneity of the Korean population [65]. Third, although our MR results showed consistent negative trend, the association was null and with wide CIs. Both limitations in the size and the strength of the association have resulted in the modest study power, so that further studies are required to confirm the association. Lastly, childhood BMI was not available and could not be included in our analysis. Although we believe the potential confounding role of childhood adiposity was minimized with the use of IV, future studies may benefit from including the information of childhood adiposity.
In conclusion, our findings alone do not exclude the possibility that AAM is one of the determinants of young adulthood obesity, but at least it is not likely that AAM be a major determinant even if so.
We used bioresources from the National Biobank of Korea, the Centers for Disease Control and Prevention, Republic of Korea (Approval No. 2017–04).
1
2
3
4
5
6
7
8
9
10
11
12
13
14
15
16
17
18
19
20
21
22
23
24
25
26
27
28
29
30
31
32
33
34
35
36
37
38
39
40
41
42
43
44
45
46
47
48
49
50
51
52
53
54
55
56
57
58
59
60
61
62
63
64
65
 Causal relationship between the timing of menarche and young adult body mass index with consideration to a trend of consistently decreasing age at menarche
 Facebook
 Twitter
 Linkedin
 Whatsapp

