
Competing Interests: The authors have declared that no competing interests exist.
Integrated weed management (IWM) is currently the most appropriate and effective method of agricultural weed control. To determine the most effective strategy, it is necessary to compare the effects of different control options and their rotation. Avena fatua (common wild oat) is one of the most common and economically threatening grass weed species of cereal crops worldwide. To examine the effects of non-chemical weed management options (farmland use, delayed sowing, and summer irrigation) on control of A. fatua, we recorded coverage levels and field conditions in 41 sites during the spring growing season of winter wheat for about 10 years. A transition matrix model was then constructed to project coverage levels of A. fatua under each management option using ordinal logistic regression. The results showed that farmland use had a remarkable effect on coverage; notably, planting of paddy rice and vegetables, which respectively eliminated the effect of coverage in the previous year and facilitated rapid convergence of coverage to 0%. Thus, although 90% of fields under continuous wheat cultivation were found to be at risk of A. fatua colonization, the risk was reduced to almost 0% with rotation of effective farmland use. As summer irrigation was also effective, more than 50% of wheat fields with the option continuously converged to no risk for A. fatua colonization. When the different management cycles were repeated, the effects were observed within 3 years, with a steady state reached in less than 10 years. Overall, these results suggest that simplified monitoring data could help decision-making on IWM, thereby helping to improve the efficiency of agricultural production.
Integrated weed management (IWM), defined as the combined use of multiple control tactics such as cultural, physical, biological, and chemical methods, is currently the most appropriate and effective method of agricultural weed control [1–3]. Since herbicide reduction contributes to reduce risks of environmental pollution and herbicide resistance [4–6] as well as to improve market value of products [7], crop protecting strategies alternative to chemical approach such as crop rotation and optimization of sowing time are important. To aid decision-making, and increase the efficiency of agricultural production and potential economic benefits for risk management, it is necessary to understand the effects of different weed management strategies and their rotation [8].
Previous studies have addressed the effects of various strategies and/or combinations of strategies on weed control. In general, field experiments allow data collection on weed abundance and/or biomass under different treatments, providing a direct understanding of the effects on weed control [6,9,10]. However, the number of treatments tends to be limited because of the time and labor required to carry out measurements. In contrast, categorical monitoring (on an ordinal scale of low, medium, and high) has recently been used to build projection models (density-structured models [11]) that allow direct analyses of the effects of different weed management strategies [12]. Obtaining simplified density data via field observations is much easier than measuring actual abundance, thereby allowing more data to be obtained from a greater number of sites over a longer period time, with the additional benefit of simultaneous analyses. Therefore, projection models based on simplified monitoring data have significant potential for developing weed management strategies and creating simulations of their long-term effects; however, few studies of such models have been conducted to date [12].
Avena fatua L. (common wild oat) is one of the most common and economically threatening weed species of cereal crops [13–15], and also one of the most herbicide-resistant weed species in the world [16]. To avoid further herbicide resistance, IWM is necessary for sustainable management of A. fatua. Several strategies have already been examined [17] such as crop rotation [18–21], changing sowing times [22,23], using competitive crops or cultivars [24,25], and increasing seeding densities [26], increasing soil water content to reduce the A. fatua seed bank [27,28], and combination of them in management cycles [18–20,29]. However, there is a limit to the number of experimental treatments that can be examined simultaneously or repetitively. Moreover, although data on the effects of each scenario and the required number of repetitions are required to optimize IWM strategies, determining the effects of numerous options and repetitions is difficult and requires simultaneous comparisons of each option across multiple years.
A. fatua has been regarded as a noxious weed of winter wheat and barley fields in Japan, especially the main island of Honshu, since the 1990s [30]. According to a questionnaire survey, A. fatua is recognized as noxious in 28 prefectures, with increasing weed damage in eight prefectures [31], however, there is currently no registered foliar-applied graminicide available for A. fatua [23]. Winter wheat fields are cultivated in rotation under “wheat-paddy rice,” “wheat-soybean-fallow-paddy rice,” or “wheat-vegetable” systems. In fields where the rotation sequence includes paddy rice, A. fatua populations tend to decrease because buried seeds are unable to survive in submerged paddy soil [28]. This rotation system is therefore regarded as a major and effective cultural control method of A. fatua in Japan; however, A. fatua continues to cause serious damage in upland winter-cereal systems.
In this study, we simultaneously evaluated the effects of multiple IWM strategies on the control of A. fatua by using accumulated coarse monitoring data of A. fatua coverage in a large number of crop fields in Japan. This study aimed to determine the following: 1) changes in A. fatua coverage in wheat fields without IWM strategies, 2) changes in coverage with different management strategies, and 3) changes in coverage over time with repetition of each management strategy. To determine the long-term effects, a transition matrix model was also established to describe the annual shift in A. fatua coverage from year to year. The results suggest that simplified monitoring data could be used to support IWM decision making and to increase the efficiency of A. fatua control.
In this study, field observations were carried out in a total of 41 fields in Ibaraki Prefecture, Japan from 1997 to 2009 (total of 425 visual observations; Fig 1, Table 1 and S1 Table). In Ibaraki Prefecture, many of the buried seeds were reported to germinate within a year [32]. In this area, wheat is usually sown in November and harvested in June, and delayed sowing from November to December has been considered to help eliminate the emerged A. fatua seedlings before wheat seeding, reducing the population density during the cropping season [23]. We selected wheat or barley fields where A. fatua colonized and conducted continuous annual visual observations. Surveys were conducted in May when A. fatua is in the flowering stage and easily observable, and is taller than wheat and barley. Coverage was classified into four levels as follows: 0 = “absent” (zero A. fatua found, degree of coverage 0%.), 1 = “low” (coverage less than 20%.), 2 = “medium” (coverage 20%–50%), and 3 = “high” (coverage more than 50%.). We also observed field and crop conditions and recorded the following. 1) farmland use comprised six categories: “wheat,” “barley,” “other crop (e.g. potato, vegetables, and, green manure crops),” “paddy rice,” “fallow with spring management (mainly tillage),” and “fallow without spring management.” Spring management was determined by investigations of soil conditions, weed size, and weed composition (S1 Table). Fields showing traces of tillage within a month, a small weed size and few winter weeds were classified as “fallow with spring management.” When no evidence of the above was found, the field was classified as “fallow without spring management.” 2) Delay in wheat sowing (binary) was determined by lower than expected growth. 3) Evidence of irrigation the previous summer (binary) was determined by observations of irrigation ditches, soil moisture, and weed composition.


Locations of the 41 study sites in Ibaraki Prefecture, Japan.
Points were converted into 1-km2 grid data.

| Site ID | Lat (°N) | Lon (°E) | Years | Mean Tmp (Dec-Apr) | Address |
|---|---|---|---|---|---|
| 1 | 36.23 | 140.04 | 1998–2009 | 7.19±0.67 | Kuramochi, Akeno |
| 2 | 36.23 | 140.04 | 1998–2009 | 7.19±0.67 | Kuramochi, Akeno |
| 3 | 36.23 | 140.04 | 1998–2009 | 7.44±0.68 | Kuramochi, Akeno |
| 4 | 36.23 | 140.04 | 1998–2009 | 7.19±0.67 | Kuramochi, Akeno |
| 5 | 36.23 | 140.04 | 2000–2009 | 7.33±0.69 | Kuramochi, Akeno |
| 6 | 36.19 | 139.78 | 1998–2009 | 6.91±0.61 | Inamiya, Sowa |
| 7 | 36.19 | 139.77 | 2005–2008 | 6.74±0.69 | Inamiya, Sowa |
| 8 | 36.17 | 139.78 | 1997–2008 | 6.89±0.59 | Yagihashi, Sowa |
| 9 | 36.11 | 140.11 | 1999–2009 | 6.90±0.66 | Shibasaki, Tsukuba |
| 10 | 36.11 | 140.11 | 1999–2006 | 6.68±0.60 | Shibasaki, Tsukuba |
| 11 | 36.10 | 140.12 | 1998–2009 | 6.89±0.63 | Shibasaki, Tsukuba |
| 12 | 36.10 | 140.11 | 1999–2008 | 6.78±0.63 | Shibasaki, Tsukuba |
| 13 | 36.10 | 140.12 | 1999–2009 | 6.87±0.66 | Shibasaki, Tsukuba |
| 14 | 36.10 | 139.80 | 1998–2009 | 7.01±0.61 | Shimokohasi, Sakai |
| 15 | 36.10 | 139.80 | 1998–2009 | 7.01±0.61 | Shimokohasi, Sakai |
| 16 | 36.10 | 139.80 | 1998–2009 | 7.01±0.61 | Shimokohasi, Sakai |
| 17 | 36.10 | 140.12 | 1998–2006 | 6.79±0.58 | Konta, Tsukuba |
| 18 | 36.07 | 140.02 | 1999–2009 | 6.57±0.65 | Takasuka, Tsukuba |
| 19 | 36.06 | 139.99 | 1997–2009 | 6.66±0.60 | Nakatsuma, Mitsukaido |
| 20 | 36.06 | 139.99 | 1998–2009 | 6.65±0.63 | Nakatsuma, Mitsukaido |
| 21 | 36.06 | 140.10 | 1998–2009 | 6.78±0.63 | Teshirogi, Tsukuba |
| 22 | 36.06 | 140.14 | 1998–2006 | 6.65±0.57 | Umezono, Tsukuba |
| 23 | 36.06 | 140.01 | 1998–2009 | 6.62±0.63 | Nakakawasaki, Mitsukaido |
| 24 | 36.06 | 140.01 | 1998–2009 | 6.68±0.63 | Nakakawasaki, Mitsukaido |
| 25 | 36.06 | 140.09 | 1998–2002 | 6.78±0.50 | Teshirogi, Tsukuba |
| 26 | 36.05 | 140.01 | 1998–2005 | 6.64±0.52 | Kawasaki, Mitsukaido |
| 27 | 36.05 | 140.15 | 1998–2009 | 6.77±0.63 | Shimosasagi, Tsukuba |
| 28 | 36.05 | 140.01 | 1998–2004 | 6.67±0.56 | Higashi, Mitsukaido |
| 29 | 36.04 | 139.99 | 1999–2009 | 6.73±0.65 | Oyamato, Mitsukaido |
| 30 | 36.03 | 140.04 | 1999–2003 | 6.57±0.62 | Dai, Yawara |
| 31 | 36.03 | 140.03 | 1999–2008 | 6.60±0.62 | Fukuoka, Yawara |
| 32 | 36.03 | 140.03 | 1999–2008 | 6.60±0.62 | Fukuoka, Yawara |
| 33 | 36.02 | 140.03 | 1999–2008 | 6.65±0.62 | Fukuoka, Yawara |
| 34 | 36.00 | 139.91 | 1997–2009 | 6.88±0.59 | Yahagi, Iwai |
| 35 | 35.99 | 140.10 | 1998–2007 | 6.67±0.63 | Kukizaki, Tsukuba |
| 36 | 35.99 | 140.10 | 1999–2008 | 6.58±0.62 | Kukizaki, Tsukuba |
| 37 | 35.99 | 140.10 | 1998–2008 | 6.60±0.60 | Kukizaki, Tsukuba |
| 38 | 35.99 | 140.10 | 1998–2007 | 6.75±0.63 | Kamiiwasaki, Tsukuba |
| 39 | 35.97 | 140.10 | 1998–2009 | 6.82±0.62 | Shimoiwasaki, Tsukuba |
| 40 | 35.96 | 140.13 | 1999–2003 | 6.76±0.61 | Shironaka, Ushiku |
| 41 | 35.90 | 140.32 | 1998–2009 | 6.67±0.63 | Minamiota, Shintone |
We also examined temperature, which is reported to affect the emergence of A. fatua [33,34]. To determine the effect of differences in temperature among fields and years, temperature data were obtained at a resolution of 1 km2 from Agro-Meteorological Grid Square Data, NARO (https://amu.rd.naro.go.jp/) [35,36]. Average temperatures during the growth period of A. fatua (December–April) were calculated for each field and observation year.
We used transition matrix models that describe the changes in weed states from one time step to the next [12,37] to project the coverage level of A. fatua. The coverage level of A. fatua in a given year depends on that in the previous year via the seed bank. A transition matrix model is applicable in such situations where a discrete state changes from year to year. In this study, the transition probability is assumed to depend on the management practices adopted and temperature. xts denotes a vector of management factors and temperature in year t at site s, and the transition matrix is expressed as follows:
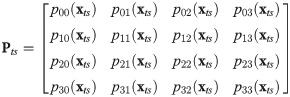
Here, pji denotes the transition probability from level i to level j, and the subscripts 0, 1, 2, and 3 indicate respective levels of coverage. The sum of each column is 1. For the explanatory variables, x, we considered farmland use (6-level categorical variable), summer irrigation (binary variable), delayed sowing (binary variable), and temperature (continuous variable). The state probability vector for the four coverage levels, qts, is given by the product of the transition matrix and the state probability vector for the coverage levels in the previous year, qts = Ptsqt-1,s. The equilibrium state probabilities as t → +∞ are given by the right eigenvector associated with the dominant eigenvalue (λ = 1) of Pts.
To estimate the transition probability matrix and effects of the different weed management strategies on the transition probabilities of A. fatua in crop fields, we fitted mixed ordinal logistic models [38] to the observed coverage levels. These models are formulated as a set of threshold regression models on transition probabilities:
p0i(xts) = f0|1(i, xts),
p1i(xts) = f1|2(i, xts)—f0|1(i, xts),
p2i(xts) = f2|3(i, xts)–f1|2(i, xts),
p3i(xts) = 1—f2|3(i, xts),
where fj|j+1(i, xts) is a function of the threshold probability between coverage levels j and j+1 depending on the previous year’s coverage level i and explanatory variables xts. The threshold function is given by a mixed logistic regression model:
fj|j+1(i, xts) = Logit(βj|j+1 –(αi + βxts + εs)).
Here, βj|j+1 denotes threshold coefficients of coverage levels j and j+1, which increases in the order β0|1 < β1|2 < β2|3, and αi denotes ordered factors determining the dependence on the previous year’s coverage level i, with baseline i = 0 (α0 = 0 < α1 < α2 < α3 or α3 < α2 < α1 < 0 = α0). xts and β are vectors of explanatory variables and the corresponding regression coefficients, respectively, and εs is a site-level random effect with Gaussian prior εs ~ Normal (0, σ2).
The observed coverage level, Yts = j, conditional on the state of the previous year, Yt-1,s = i, follows a multinomial distribution with probability vector p.i = (p0i(xts), p1i(xts), p2i(xts), p3i(xts)). Model fitting was performed using the marginal maximum likelihood method with the clmm2 function of the ordinal package [39] in R software version 3.5.1 [40]. The best model was selected using downward model selection with the Akaike information criterion (AIC) [41] and was used for the projection.
To compare the effects of each management strategy and its repetition, we simulated temporal changes in the state probabilities of A. fatua coverage levels under different management scenarios using the best model. The management scenarios were as follows: repeated wheat cultivation, rotation of wheat and five other farmland uses, wheat with summer irrigation, and rotation of wheat with and wheat without summer irrigation. The initial level of A. fatua coverage was set at 0 or 3. The temporal changes across 20 years were then simulated. In all simulations, the random effect was fixed at zero to exclude the effects of differences among sites and to allow the average effects of each site to be determined.
We also calculated equilibrium state oscillation under different cycle options. When two different farmland uses are rotated from year to year, the probabilities of coverage levels oscillate between two states at equilibrium [42]. Given the transition matrices corresponding to two farmland use, P1 and P2, the probabilities of equilibrium coverage levels are given by eigenvectors of the two matrix products (P2P1) and (P1P2), respectively.
All field works (visual observations) were conducted on public roads and no permission was required under law in Japan. All information of site locations is coarse enough to protect landowners' privacy.
The difference in AIC value between the full model and the models that excluded the effects of delayed sowing and/or temperature was less than 2 (Table 2); thus, the models used in the subsequent projection analyses excluded these two variables. Although their effects were smaller than those of the remaining variables, delayed sowing and temperature had a negative and positive effect on coverage of A. fatua, respectively.
| Coverage in the previous year | Summer irrigation | Delayed sowing | Farmland use | Temp. | Threshold | AIC | ||||||||
|---|---|---|---|---|---|---|---|---|---|---|---|---|---|---|
| Lv1 | Lv2 | Lv3 | Barley | Other crop | Paddy rice | Fallow (management) | Fallow | Lv0|Lv1 | Lv1|Lv2 | Lv2|Lv3 | ||||
| 4.23 | 8.43 | 12.44 | -1.39 | 0.22 | -6.77 | -18.79 | -5.34 | -1.60 | 0.31 | -1.01 | 2.34 | 4.37 | 633.02 | |
| 4.27 | 8.46 | 12.37 | -1.44 | -0.91 | 0.18 | -6.86 | -19.75 | -5.43 | -1.68 | 0.30 | -1.19 | 2.17 | 4.23 | 633.12 |
| 4.26 | 8.47 | 12.46 | -1.45 | -0.98 | 0.21 | -6.83 | -19.75 | -5.46 | -1.63 | -3.16 | 0.16 | 2.20 | 633.86 | |
| 4.22 | 8.44 | 12.57 | -1.39 | 0.26 | -6.73 | -18.79 | -5.36 | -1.54 | -3.08 | 0.22 | 2.23 | 634.08 | ||
| 4.38 | 8.79 | 13.05 | -0.85 | 0.26 | -6.79 | -19.78 | -5.37 | -1.67 | 0.32 | -0.88 | 2.44 | 4.49 | 637.75 | |
| 3.64 | 8.44 | 16.78 | -0.90 | -0.27 | 0.30 | 0.32 | 2.69 | 4.29 | 803.55 | |||||
| -3.23 | -0.39 | -0.36 | -6.40 | -19.26 | -4.28 | -0.72 | 0.36 | -0.42 | 2.05 | 3.45 | 914.20 | |||
Farmland use had a remarkable effect on the coverage level of A. fatua, and under repeated “wheat” cultivation (Fig 2), about half of the state of level 0 shifted to level 1. In most cases, the increase or decrease was gradual (e.g. from level 0 to 1 or level 3 to 2) and the probabilities of skipping a level (e.g. from level 0 to 2 or level 3 to 0) were less than 0.1. Similar results were also observed in the “barley” fields (Fig 2). In contrast, when “other crops” were selected, level 0 was maintained, and sites with level 1 or 2 tended to decrease to level 0 with probabilities of 0.99 and 0.94, respectively, whereas those at level 3 tended to shift to level 0 or 1. When “paddy rice” which had more effect than the other options (Table 2) was selected, a consistent shift to level 0 was observed for level 1 to 3. Meanwhile, the effect of “fallow with spring management” was stronger than that of “fallow without spring management,” and under “fallow with spring management,” level 0 tended to be maintained, with a decrease in other levels. When “fallow without spring management” was selected, levels tended to decrease, although an increase was observed in some cases.
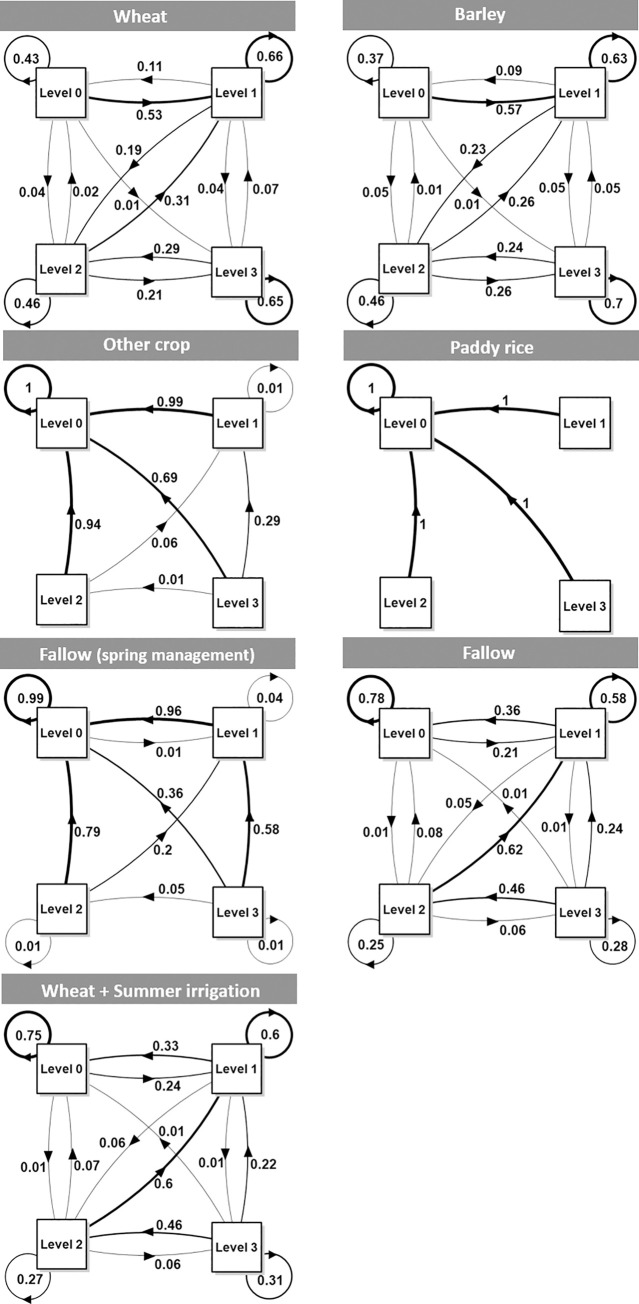
Transition probabilities of each level of Avena fatua coverage under six types of farmland use (wheat, barley, other crop, paddy rice, fallow with spring management, and fallow without spring management) and in wheat fields with summer irrigation.
Levels 0, 1, 2, and 3 indicate zero, low, medium, and high coverage of A. fatua, respectively.
All other management options were also projected to affect A. fatua coverage. In wheat fields where summer irrigation was conducted, levels tended to decrease, with a probabilities of maintaining levels 0 and 1 of 0.75 and 0.6, respectively, and of maintaining levels 2 and 3 of 0.27 and 0.31, respectively. The probability of a shift from level 1 to 0 (0.3) was higher than that of a shift from level 0 to 1 (0.2), and although rare, a shift from level 3 to 0 was also projected (0.01).
Coverage levels under all management options were projected to reach convergence in less than 10 years (Figs 3 and 4), with a notable change within the first 3 years. Under the “wheat” and “wheat-barley” strategies, the probability of A. fatua colonization (levels 1, 2, and 3) was greater than 0.9 (Fig 3 and Table 3). Meanwhile, farmland use also had a strong effect on A. fatua coverage; for example, the “paddy rice” cycle appeared to facilitate rapid convergence to level 0 in 1 year (Fig 3 and Table 3). Under the remaining cycle options, “wheat-other crop,” “wheat-paddy rice,” and “wheat-fallow with spring management,” the probabilities of level 0 or 1 coverage were almost 1 (Fig 3 and Table 3).
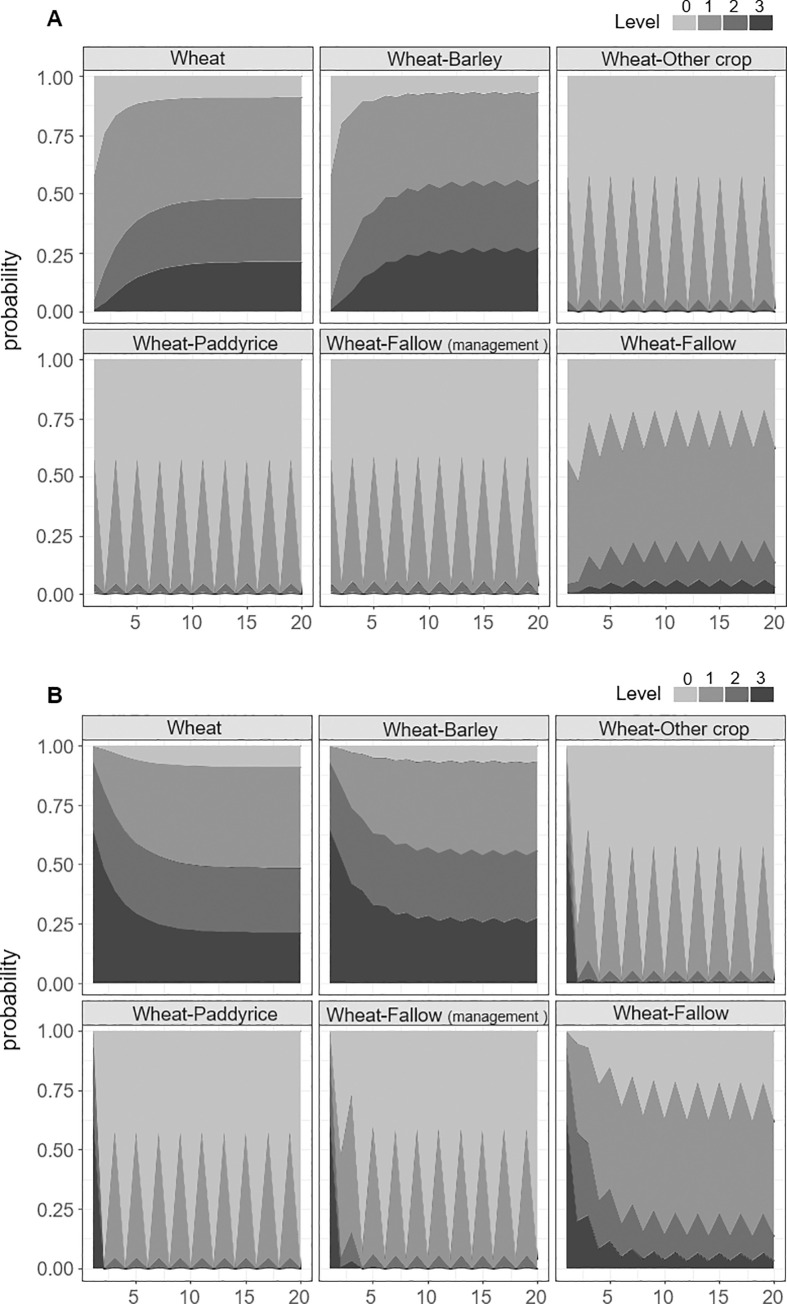
Projected state probabilities following repeated cycles of “wheat,” “wheat-barley,” “wheat-other crop,” “wheat-paddy rice,” “wheat-fallow with spring management,” and “wheat-fallow without spring management”.
A) Change from level 0 (A. fatua is absent). B) Change from level 3 (high A. fatua coverage).
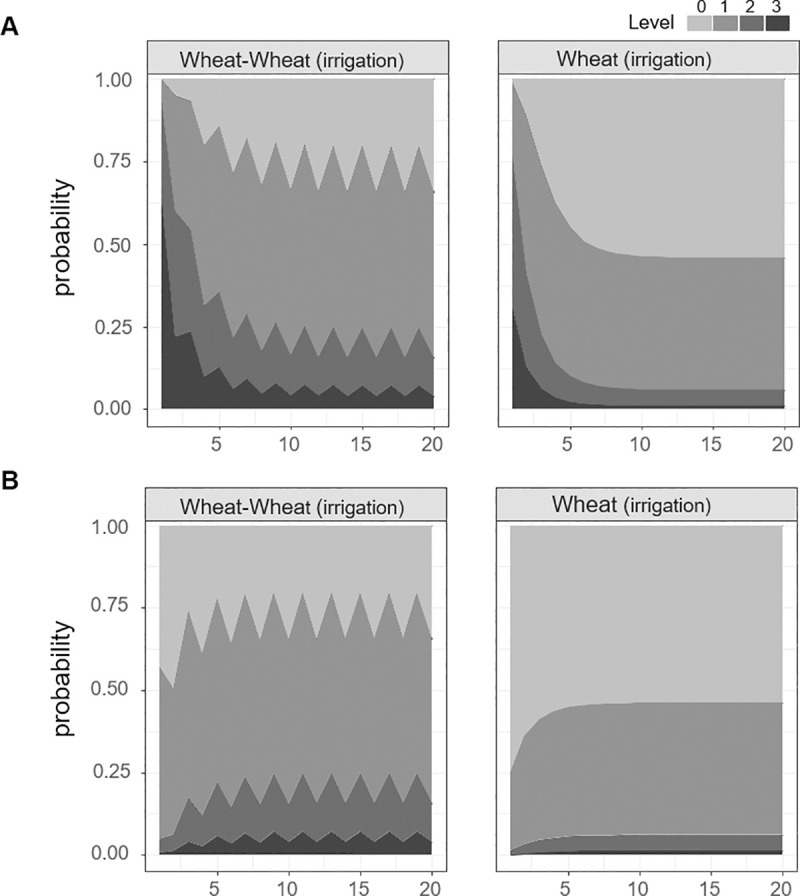
Projected state probabilities under repeated cycles of “wheat-wheat with summer irrigation” and “wheat with summer irrigation”.
A) Initial coverage was set at level 0 (A. fatua is absent) and B) level 3 (high A. fatua coverage).
| Rotation | Farmland use | Lv0 | Lv1 | Lv2 | Lv3 |
|---|---|---|---|---|---|
| Wheat | Wheat | 0.09 | 0.43 | 0.27 | 0.21 |
| Wheat—Barley | Wheat | 0.07 | 0.39 | 0.28 | 0.25 |
| Barley | 0.06 | 0.38 | 0.29 | 0.27 | |
| Wheat—Other crop | Wheat | 0.42 | 0.53 | 0.04 | 0.01 |
| Other crop | 0.99 | 0.01 | 0.00 | 0.00 | |
| Wheat–Paddy rice | Wheat | 0.43 | 0.53 | 0.04 | 0.01 |
| Paddy rice | 1.00 | 0.00 | 0.00 | 0.00 | |
| Wheat—Fallow (management) | Wheat | 0.41 | 0.53 | 0.05 | 0.01 |
| Fallow (management) | 0.96 | 0.04 | 0.00 | 0.00 | |
| Wheat—Fallow | Wheat | 0.22 | 0.55 | 0.17 | 0.06 |
| Fallow | 0.38 | 0.49 | 0.10 | 0.03 | |
| Wheat (irrigation) | Wheat (irrigation) | 0.54 | 0.40 | 0.05 | 0.01 |
| Wheat—Wheat (irrigation) | Wheat | 0.20 | 0.55 | 0.17 | 0.07 |
| Wheat (irrigation) | 0.35 | 0.50 | 0.12 | 0.04 |
The results of the transition matrix model obtained using accumulated coarse monitoring data demonstrated the contribution of each IWM strategy on A. fatua coverage and the effects of its repetition. The model projected that farmland use has a remarkable effect on coverage level of A. fatua, which tended to increase in “wheat” and “barley” fields, whereas fields planted with “paddy rice” and “other crops” drastically decreased the effect of coverage in the previous year. Barley is reported to be more competitive than wheat [25,43]; however, the results of this study suggest no differences in suppressing A. fatua. Selection of a cycle that incorporates other crops, paddy rice, or fallowing rather than wheat or barley is therefore recommended.
The “fallow” cycle option also had a strong effect on A. fatua coverage, although it increased the risk of increasing coverage compared with that of “paddy rice” and “other crops.” These findings suggest that the colonization risk of A. fatua is lower in cropped fields (other than those containing winter cereal) compared with fallow fields. Both the “fallow with spring management” and “fallow without spring management” options, which differed in terms of tillage, contributed to a decrease in A. fatua coverage; however, the effect was larger under “fallow with spring management.” This suggests that tillage during the booting to flowering stages is effective in breaking the life cycle of A. fatua and eliminating it. Mature weeds including A. fatua were sometimes able to survive spring tillage; thus, to prevent seed setting and dispersal, a management strategy that involves removing mature plants is important.
Fallowing could also help suppress A. fatua, although it risks increasing the invasion of other weed species. For example, in this study, weed species such as Capsella bursa-pastoris and Equisetum arvense were observed in place of A. fatua. C. bursa-pastoris is a common weed in vegetable fields in Japan [44], and E. arvense is known to cause damage to various types of agricultural fields [45]. Understanding the risk of invasion from other species and appropriate management is therefore important when considering fallowing as an IWM strategy.
It was previously reported that wet soil conditions contribute to the decay of buried seeds [27,28]. The results of this study suggest that “summer irrigation” could effectively suppress A. fatua abundance in wheat fields. In Honshu, rotation of paddy rice and wheat is a major cropping system, a decrease in A. fatua damage has been reported for fields using this system [30]. The results of our model were also in line with this.
Although summer irrigation of wheat fields is effective, paddy rice rotation rather than continuous wheat was able to more rapidly and more effectively eliminate A. fatua coverage. This is thought to reflect the effect of summer irrigation on the seed bank, whereas paddy rice reduces both the seed bank and breaks the life cycle of A. fatua via spring tillage and irrigation.
In this study, the effects of delayed sowing and temperature were not included in the model because they were found to be weaker than those of the remaining variables. Previous studies have suggested the effectiveness of removing A. fatua seedlings by delayed sowing [23], and the effects of warm temperatures on A. fatua emergence have also been pointed out [34]. In the present study, negative effects of delayed sowing and positive effects of temperature were detected. Thus, although both effects were relatively small compared with farmland use and summer irrigation, our results do not contradict the results of previous studies.
Crop rotation using other crops or fallowing is another effective method of weed control in wheat fields [20,21]. For example, planting barley instead of wheat is considered effective because it is more competitive [25], whereas winter fallow with tillage is thought to remove emerging A. fatua before seed maturation, helping to deplete the seed bank. Although the number of years required for crop rotation or fallowing have been unclear in spite of its importance, the results of our simulations provide information about it.
Simulations of repeated management revealed that farmland use in the form of rotation with “paddy rice” and “other crops” contributed to rapid A. fatua control in 1 year, even under the highest level of coverage (level 3). These findings suggest that changing farmland use only once can effectively eliminate A. fatua in fields where an outbreak has occurred. The remaining management options established a trend within 3 years and reached convergence in less than 10 years. These results suggest that our model can accurately estimate the effects of various management strategies and their cycles and can be used to aid decision-making on which strategies to select and how long to continue them.
The results of this study suggest that the transition matrix model obtained using accumulated coarse monitoring data is a powerful tool for projecting the abundance and effects of multiple IWM strategies and their repetition on the suppression of A. fatua. Because few studies have used such simplified density data to consider weed dynamics, these findings contribute to weed management decision-making support by showing the usefulness of such simplified monitoring data. The results also highlight the potential risk of emergence and/or increased A. fatua coverage in crop fields, providing information on different management strategies and the recommended duration of each cycle option. Even on farms with a severe outbreak of A. fatua, just one significant change in farmland use, such as a change from wheat to vegetable or paddy rice could drastically reduce coverage and improve farm conditions. Thus, although management of A. fatua in crop fields requires IWM, our findings will help to support decision-making processes and facilitate efficient agricultural production.
We thank the Weed Management Group, NARO for supporting this study.
1
2
3
4
5
6
7
8
9
10
11
12
13
14
15
16
17
18
19
20
21
22
23
24
25
26
27
28
29
30
31
32
33
34
35
36
37
38
39
40
41
42
43
44
45
 Estimations and projections of Avena fatua dynamics under multiple management scenarios in crop fields using simplified longitudinal monitoring
 Facebook
 Twitter
 Linkedin
 Whatsapp

