
Competing Interests: The authors have declared that no competing interests exist.
The tumor suppressor gene TP53 and its downstream genes P21 and MDM2 play crucial roles in combating DNA damage at the G1/S cell cycle checkpoint. Polymorphisms in these genes can lead to the development of various diseases. This study was conducted to examine a potential association between tobacco substance usage (TSU) and single-nucleotide polymorphism (SNP) at the exon regions of the P53, P21, and MDM2 genes by comparing populations of smokers and non-smokers from Saudi Arabia. P53 rs1042522 (C/G), P21 rs1801270 (A/C), and MDM2 rs769412 (A/G) were investigated by genotyping 568 blood specimens: 283 from male/female smokers and 285 from male/female non-smokers. The results obtained from the smokers and their control non-smokers were compared according to age, sex, duration of smoking, and type of TSU. Heterozygous CG, homozygous GG, and CG+GG genotypes, as well as the G allele of rs1042522 were significantly associated with TSU in Saudi smokers compared with non-smokers. The C allele frequency of rs1801270 was also associated with TSU in smokers (OR = 1.33, p = 0.049) in comparison with non-smokers, in younger smokers (≤29 years) (OR = 1.556, p = 0.03280) in comparison with non-smokers of the same age, in smokers who had smoked cigarettes for seven years or less (OR = 1.596, p = 0.00882), and in smokers who had consumed shisha (OR = 1.608, p = 0.04104) in comparison with the controls. However, the genotypic and allelic frequencies for rs769412 did not show significant associations with TSU in Saudis. The selected SNP of P53 was strongly associated with TSU and may be linked to TSU-induced diseases in the Saudi Arabian population.
According to the World Health Organisation, global statistics on trends in tobacco substance usage (TSU) indicate that between the years 2000 and 2025, 1.1 billion youth under the age of 15 have smoked, are smoking, or will smoke (https://punchng.com/1-billion-people-smoke-globally-who-says/) [1]. This large number increases the death toll from TSU among males and females in developed countries by 24% [2]. This number also adds to the 10 million people worldwide who, by the year 2030, will die of diseases related to TSU as well as to the 1 billion who will die of these same causes by the end of the 21st century [3]. Several studies have reported an association between TSU and the formation of tumors in the lungs [4, 5], breasts [6, 7], mouth [8, 9], pancreas [10, 11], colon [12, 13], and kidneys [14, 15]. Associations of TSU with other diseases, including periodontal diseases, cardiovascular diseases [16], and asthma [17], have also been reported. Tobacco is known to contain several hundred different toxic substances (https://www.lung.org/quit-smoking/smoking-facts/whats-in-a-cigarette) that can directly alter genes in cells in the small airways [18] and lungs [19], as well as indirectly cause mutations in genes located in the cells in the bloodstream [20]. Two recent studies have identified the effects of TSU on 599 [21] and 290 genes [19]. This work has shed light on which genes undergo dysregulation of their expression in smokers because of their TSU [19], including cell cycle-related genes in particular [22]. In another study conducted in Ishikawa, Japan, the endometrial adenocarcinoma cells of the participants were treated with components of tobacco [23]. An association was found between TSU and the downregulation of the P16 tumor suppressor protein encoded by the CDKN2A gene that slows down cell division [24]. In addition, a reduction in expression was found to occur in the pathways of the cyclin-dependent kinase inhibitors P21 and P27, with their expression increasing inside the levels of transmission of the cyclins D1 and E. Moreover, previous studies have demonstrated the significant association between TSU and mutations in P53, which cause squamous cell carcinoma in the lungs. TSU has been shown to affect the gene expression of P53 [25] by altering its negative regulator, the MDM2 gene [26], which in turn causes MDM2 upregulation in the lungs of cancer patients who are smokers [27]. Recently, single-nucleotide polymorphisms (SNPs) have also been linked to various diseases, including celiac disease [28], rheumatoid arthritis [29], bipolar disorder [30], and asthma [31, 32], as well as lung [33], gastric [34], ovarian [35], and breast cancers [36]. Other studies have also demonstrated that TSU causes SNPs that affect gene expression in various locations in the genome [37, 38]. One study of SNPs carried out on genes involved in systematic inflammation noted that TSU causes an increase in the levels of immunosuppressive cells in the bloodstream of smokers [39]. In addition, it was found that a consistent elevation of IFN-γ was primarily caused by changes occurring at an SNP at its rs2069705 (AG/GG) position due to TSU [40]. TSU has also been reported to contribute to the development of inflammatory bowel disease in smokers [41]. Moreover, the literature has mentioned that TSU appears to play a vital role in causing genetic variations in the cell cycle regulator genes MDM2 [42], TP53 [43], and P21 [44]. In turn, they cause mutations at P53, which is involved in the P21 and MDM2 pathways, thereby leading to the development of tumors [45, 46]. For example, regarding the P53 SNP rs1042522, at codon 72 (G>C Arg to Pro), greater apoptotic activity was identified with Arg72 than with Pro72. This causes the increased expression of MDM2, P21, and caspase 3 [47]. It is also likely that the MDM2 polymorphisms rs22797944, rs937283, and rs769412 are responsible for controlling such expression and for causing disruptions in the pathways of P53 [48]. In addition, in smokers who are also alcoholics, this might contribute to increase susceptibility to the development of carcinoma of the larynx [49]. Other disruptions in the P53 pathways might result in SNP polymorphisms at the downstream P21, similar to a case in which a P21 polymorphism involving C>A modification at rs1801270 causes the progression of uterine leiomyoma [50], but decreases the risk of preeclampsia [51]. Several reports have mentioned that TSU plays an important role in the occurrence of SNP mutations [38, 52]. These include key changes in the expression of the MDM2 [53], P21 [44], and P53 genes [52, 53], which increase the likelihood of certain diseases [39–41] and cancers to occur or progress [42–44]. Against this background, this study aimed to investigate the possible association between genetic variants of P53 rs1042522, P21 rs1801270, and MDM2 rs7694412 and TSU in Saudis to better understand and identify which specific genetic markers can facilitate the diagnosis of TSU-related diseases.
Approval for this study was provided by the Research Ethics Committee of the College of Applied Medical Sciences at King Saud University in Riyadh, Saudi Arabia (Reference No. CAMS 13/3536). All smoking and non-smoking participants verbally consented and signed an agreement form providing their informed consent before taking part in our study. All of the participants were handed a privacy statement that described how their personal data would be collected, stored, and protected. The personal data of all of the participants were collected by having them fill out a questionnaire on the following demographic factors: age, allergy and disease types, smoking history, smoking habits, types of tobacco substances used, and daily levels of consumption.
The Saudi population sampled was made up of a total of 568 males and females, among whom 283 were smokers and 285 were non-smokers (healthy controls). We collected a 3 ml blood samples from each participant using ethylenediaminetetraacetic acid (EDTA), vacutainer vials, and blood collection tubes. All samples were collected at the Blood Donation Center of King Saud Medical City in Riyadh, Saudi Arabia, in January and February 2019. Participants who self-reported that they were suffering from an inflammatory disease or chronic respiratory failure were excluded from this study.
Genomic DNA was extracted from 200 μl of EDTA anticoagulated peripheral blood. This extraction was performed in accordance with a standard set of procedures using a DNeasy® Blood & Tissue Kit (QIAGEN; 69504). First, 20 μl of Proteinase K solution was pipetted and deposited at the bottom of a new and clean 1.5 ml microcentrifuge tube. Second, 200 μl of blood sample was added, followed by 200 μl of BL buffer. These were mixed together by pulse vortexing for 15 s and incubated at 56°C for 10 min using an Eppendorf ThermoStat Plus. All of the tubes were briefly spun down using a mini centrifuge. Then, 200 μl volume of absolute ethanol was added to the mixture, before it was made to undergo one final 15 s spin by pulse vortexing. Subsequently, the entire batch was transferred to a QIAGEN mini-spin column fitted with a 2 ml collection tube. Upon centrifugation at 8000 rpm for 1 min, the samples were transferred into new collection tubes in which 500 μl of AW1 buffer solution had been added before another centrifugation at 8000 rpm for 1 min. Then, they were transferred to other collection tubes containing 500 μl of AW2 buffer solution, mixed by centrifugation at 8000 rpm for 1 min, and transferred into new and clean 1.5 mL microcentrifuge tubes that were each filled with 75 μl of an AE. The entire batch was incubated one final time for 1 min at room temperature, before being centrifuged at full speed (14,000 rpm) for 1 min.
The DNA concentration was quantified using a Nano-Drop 8000 spectrophotometer. Sample purity was calculated by determining the ratios of A260:A280nm and A260:A230nm. The DNA was considered pure when its ratio was around the 2.0 mark. Once purified, the collected DNA samples were stored at −20°C for later analysis.
Two selection criteria were used for the P53, P21, and MDM2 polymorphisms: (1) exon position and (2) their associations with different cancers or/and diseases in different ethnic groups, as mentioned previously. The descriptions of the selected polymorphism are presented in the S1 Table. Genomic DNA blood samples measuring 10 ng were prepared before undertaking any genotyping. Each DNA blood sample was genotyped in a reaction volume of 10 μl on a 96-well plate. Each well contained 8 μl of reaction mixture, 5 μl of a TaqMan® Genotyping Master Mix (Applied Biosystems; 4371355), 40× TaqMan® Genotyping of an SNP Assay (0.25 μl), DNase-free water (2.75 μl), and 2 μl of diluted DNA that reached a final volume of 10 μl. The 96-well plate was then sealed with adhesive film and briefly centrifuged to remove any air bubbles before its content was collected. Allelic discrimination for SNPs was performed by Sequence Detection Software using the QuantStudio™ 7 Flex Real-time PCR System. Then, real-time PCR amplification was performed with the following reaction conditions: pre-denaturation for 7 min at 95°C, 40 cycles of denaturation for 30 s at 95°C, annealing for 1 min at 60°C, extension for 30 s at 72°C, and then a final extension for 5 min at 72°C.
A 3D structural analysis was conducted to predict any potential structural modifications and any damaging effects that might have occurred in association with the SNPs at P53, P21, and MDM2. After obtaining the protein sequences from the NCBI, data analysis was performed using one of the most widely known protein modeling, prediction, and analysis programs; the Phyre2 protein-fold recognition server [54]. This was followed by imaging of the P53, P21, and MDM2 proteins using PyMOL’s software for their 3D structures. SNPs were then introduced into their sequences to test for any potential structural modifications that might occur.
As described in a previous paper [55], the two groups were examined using the chi-squared test to compare their allelic and genotypic frequencies. The statistical software Statistical Package for the Social Sciences version 16.0 was used to examine the statistical significance, setting a threshold of p < 0.05. A Hardy–Weinberg equilibrium test was also performed using Fisher’s two-tailed exact statistical significance test. Finally, the odd ratios (OR) at 95% confidence intervals were measured to test the strength of the connection.
The basic clinical data from the Saudi smokers and non-smokers who took part in this study are presented in Table 1. Overall, there were 568 participants: 283 male and female smokers, among whom 285 were male and female non-smokers. There were no significant demographic differences between the smokers and the non-smokers in terms of their age. The median ages of the participants in the two groups were almost identical (smokers 29.76±7.09 and non-smokers 29.13±8.83). Since the male-to-female ratio of the smokers was 91.5:8.5, we decided that it would be best to divide them into two groups based on their number of years of smoking. Then, we added non-smokers to act as controls to the smokers in each group. Subsequently, we tested all of our subjects to determine the effect of TSU in terms of the numbers of years smoking on altered SNP genotypes. Group 1 comprised those who had been smoking for 7 years or less (61.0%), while Group 2 comprised those who had been smoking for more than 7 years (39.0%). After calculating and obtaining their average TSU levels, we again divided them to find ascertain the association between daily TSU habits and gene mutations. Group 1 comprised smokers who consumed 12 cigarettes or less per day (51.4%), while Group 2 comprised smokers who smoked more than 12 cigarettes per day (48.6%). After obtaining data on their daily TSU habits, we again divided them into two groups, based on the types of tobacco that they consumed: cigarettes (75.5%) or shisha (24.5%). After testing, the results showed how the usage of various tobacco products influences alterations in various genes that could lead to the development of diseases in smokers.

| Variable | Smokers | Non-smokers |
|---|---|---|
| Number | 283 | 285 |
| Age (years), median ± SD | 29.76±7.09 | 29.13±8.83 |
| Age (years) | ||
| ≤ 29 years | 152 (53.7%) | 174 (61.3%) |
| ˃ 29 years | 131 (46.3%) | 110 (38.7%) |
| Gender | ||
| Males | 259 (91.5%) | 201 (70.5%) |
| Females | 24 (8.5%) | 84 (29.5%) |
| Years of smoking | ||
| ≤ 7 years | 172 (61.0%) | --- |
| ˃ 7 years | 110 (39.0%) | --- |
| Quantity of cigarette smoking per day | ||
| ≤ 12 times | 145 (51.4%) | --- |
| ˃ 12 times | 137 (48.6%) | --- |
| Type of smoking | ||
| Cigarette | 213 (75.5%) | --- |
| Shisha | 69 (24.5%) | --- |
Three SNPs were genotyped using a TaqMan genotyping assay: rs1042522 C˃G (P72R), in the TP53 gene, rs1801270 A˃C (R31S), in the P21 gene, and rs769412 A˃G (E354E) in the MDM2 gene. The genotype and allele frequencies for the selected polymorphisms for both smokers and non-smokers (controls) are described in Table 2. A statistically significant association with smoking was found for the three SNP genotypes at the TP53 gene’s rs1042522. In the smokers, the CC, CG, and GG genotypes were present at rates of 8%, 52%, and 40%, respectively. Along with the G allele, the heterozygous CG, homozygous GG, and the combined genotypes CG+GG demonstrated significant variations when compared to CC and the C reference alleles (OR = 3.80, p < 0.00001; OR = 5.80, p < 0.00001; OR = 4.47, p < 0.00001; and OR = 2.075, p < 0.00001, respectively; Table 2). In the controls, the CC, CG, and GG genotypes were present at rates of 27%, 49%, and 24%, respectively. However, no significant correlation was found for either of the genetic variants in the smokers and non-smokers for P21’s rs1801270 and MDM2’s rs769412, with the exception of the C allele at rs1801270. For the SNP rs1801270, the AA, AC, and CC genotypes were present at rates of 5%, 27%, and 68% in the smokers versus 7%, 33%, and 60%, respectively, in the controls. Curiously, an association was found between the C allele at the variant rs1801270 and TSU, relative to the A reference allele (OR = 1.33, p = 0.049). Regarding the genotypes, the MDM2 SNP rs769412 was distributed as follows: 84% for AA, 16% for AG, and 0% for GG in the smokers, but 85% for AA, 15% for AG, and 0% for GG in the controls.
| Gene | SNP | Alleles | Controls | Smokers | OR | 95% CI | X2 | P value | ||
|---|---|---|---|---|---|---|---|---|---|---|
| N | Percent | N | Percent | |||||||
| TP53 | rs1042522 | Total | 285 | 100% | 283 | 100% | ||||
| CC | 78 | 27% | 22 | 8% | Ref | |||||
| CG | 138 | 49% | 148 | 52% | 3.80 | 2.24–6.44 | 26.61 | <0.00001* | ||
| GG | 69 | 24% | 113 | 40% | 5.80 | 3.31–10.16 | 41.56 | <0.00001* | ||
| CG+GG | 207 | 73% | 261 | 92% | 4.47 | 2.69–7.42 | 37.58 | <0.00001* | ||
| C | 294 | 52% | 192 | 34% | Ref | |||||
| G | 276 | 48% | 374 | 66% | 2.075 | 163–2.63 | 36.17 | <0.00001* | ||
| P21 | rs1801270 | Total | 274 | 100% | 278 | 100% | ||||
| AA | 19 | 7% | 14 | 5% | Ref | |||||
| AC | 91 | 33% | 76 | 27% | 1.133 | 0.533–2.410 | 0.11 | 0.74481 | ||
| CC | 164 | 60% | 188 | 68% | 1.556 | 0.756–3.201 | 1.46 | 0.22696 | ||
| AC+CC | 255 | 93% | 264 | 95% | 1.405 | 0.690–2.862 | 0.88 | 0.34692 | ||
| A | 129 | 24% | 104 | 19% | Ref | |||||
| C | 419 | 76% | 452 | 81% | 1.33 | 1.00–1.78 | 3.87 | 0.049* | ||
| MDM2 | rs769412 | Total | 282 | 100% | 282 | 100% | ||||
| AA | 239 | 85% | 236 | 84% | Ref | |||||
| AG | 42 | 15% | 45 | 16% | 1.085 | 0.687–1.714 | 0.12 | 0.72645 | ||
| GG | 1 | 0% | 1 | 0% | 1.013 | 0.063–16.285 | 0.00 | 0.99289 | ||
| AG+GG | 43 | 15% | 46 | 16% | 1.083 | 0.689–1.704 | 0.12 | 0.72896 | ||
| A | 520 | 92% | 517 | 92% | Ref | |||||
| G | 44 | 8% | 47 | 8% | 1.074 | 0.700–1.650 | 0.11 | 0.74292 | ||
*P < 0.05, SNP: Single Nucleotide Polymorphism, N = Number, Ref = Reference allele, OR: Odd Ratio.
To determine whether there was a correlation between the age of the smokers and the occurrence of polymorphisms at TP53, P21, and MDM2, we created two age-related cohorts of smokers and their controls. Group 1 comprised participants who were ≤29 years, while Group 2 contained those ˃29 years. Group 1 included 152 smokers and 174 non-smokers, while Group 2 included 131 smokers and 110 non-smokers (Table 1). The results for the group of smokers ≤29 years of age indicated an association between the TP53 SNP at rs1042522 for all allelic and genotypic distributions (Table 3). In these younger smokers, the G allele, and the CG, GG, and CG+GG genotypes correlated significantly with TSU (OR = 4.095, p = 0.00007 for CG; OR = 4.783, p = 0.00003 for GG; OR = 4.338, p = 0.00001 for CG+GG; and OR = 1.774, p = 0.00035 for the G allele) (Table 3). In the group of older smokers (˃29 years), the results for the same SNP regarding the CG, GG, and CG+GG genotypes and the G allele indicated significant associations with TSU (OR = 3.616, p = 0.00077 for CG; OR = 7.794, p < 0.00003 for GG; OR = 4.880, p < 0.00007 for CG+GG; and OR = 2.590, p < 0.00003 for the G allele) (Table 3).
| Gene | SNP | Allele | Controls | ≤ 29 years | OR | 95% CI | X2 | P value | ||
|---|---|---|---|---|---|---|---|---|---|---|
| N | Percent | N | Percent | |||||||
| TP53 | rs1042522 | Total | 174 | 100% | 152 | 100% | ||||
| CC | 44 | 25% | 11 | 7% | Ref | |||||
| CG | 84 | 48% | 86 | 57% | 4.095 | 1.982–8.463 | 15.85 | 0.00007* | ||
| GG | 46 | 27% | 55 | 36% | 4.783 | 2.219–10.309 | 17.32 | 0.00003* | ||
| CG+GG | 130 | 75% | 141 | 93% | 4.338 | 2.149–8.757 | 18.85 | 0.00001* | ||
| C | 172 | 49% | 108 | 36% | Ref | |||||
| G | 176 | 51% | 196 | 64% | 1.774 | 1.294–2.431 | 12.79 | 0.00035* | ||
| P21 | rs1801270 | Total | 165 | 100% | 149 | 100% | ||||
| AA | 11 | 7% | 5 | 3% | Ref | |||||
| AC | 51 | 31% | 36 | 24% | 1.553 | 0.497–4.856 | 0.58 | 0.44682 | ||
| CC | 103 | 62% | 108 | 73% | 2.307 | 0.775–6.868 | 2.36 | 0.12415 | ||
| AC+CC | 154 | 93% | 144 | 97% | 2.057 | 0.698–6.065 | 1.77 | 0.18278 | ||
| A | 73 | 22% | 46 | 15% | Ref | |||||
| C | 257 | 78% | 252 | 85% | 1.556 | 1.035–2.340 | 4.56 | 0.03280* | ||
| MDM2 | rs769412 | Total | 173 | 100% | 151 | 100% | ||||
| AA | 147 | 85% | 131 | 87% | Ref | |||||
| AG | 25 | 14% | 20 | 13% | 0.898 | 0.476–1.691 | 0.11 | 0.73837 | ||
| GG | 1 | 1% | 0 | 0% | 0.374 | 0.015–9.258 | 0.89 | 0.34593 | ||
| AG+GG | 26 | 15% | 20 | 13% | 0.863 | 0.460–1.619 | 0.21 | 0.64629 | ||
| A | 319 | 92% | 282 | 93% | Ref | |||||
| G | 27 | 8% | 20 | 7% | 0.838 | 0.460–1.527 | 0.33 | 0.56313 | ||
| Gene | SNP | Allele | Controls | ˃ 29 years | OR | 95% CI | X2 | P value | ||
| N | Percent | N | Percent | |||||||
| TP53 | rs1042522 | Total | 110 | 100% | 131 | 100% | ||||
| CC | 34 | 31% | 11 | 8% | Ref | |||||
| CG | 53 | 48% | 62 | 48% | 3.616 | 1.670–7.828 | 11.32 | 0.00077* | ||
| GG | 23 | 21% | 58 | 44% | 7.794 | 3.385–17.946 | 25.97 | <0.00003* | ||
| CG+GG | 76 | 69% | 120 | 92% | 4.880 | 2.333–10.209 | 19.95 | <0.00007* | ||
| C | 121 | 55% | 84 | 32% | Ref | |||||
| G | 99 | 45% | 178 | 68% | 2.590 | 1.787–3.754 | 25.74 | <0.00003* | ||
| P21 | rs1801270 | Total | 108 | 100% | 129 | 100% | ||||
| AA | 8 | 7% | 9 | 7% | Ref | |||||
| AC | 40 | 37% | 40 | 31% | 0.889 | 0.312–2.536 | 0.05 | 0.82566 | ||
| CC | 60 | 56% | 80 | 62% | 1.185 | 0.432–3.252 | 0.11 | 0.74129 | ||
| AC+CC | 100 | 93% | 120 | 93% | 1.067 | 0.397–2.867 | 0.02 | 0.89818 | ||
| A | 56 | 26% | 58 | 22% | Ref | |||||
| C | 160 | 74% | 200 | 78% | 1.207 | 0.791–1.840 | 0.76 | 0.38208 | ||
| MDM2 | rs769412 | Total | 108 | 100% | 131 | 100% | ||||
| AA | 91 | 84% | 105 | 80% | Ref | |||||
| AG | 17 | 16% | 25 | 19% | 1.275 | 0.648–2.508 | 0.49 | 0.48196 | ||
| GG | 0 | 0% | 1 | 1% | 2.602 | 0.105–64.655 | 0.86 | 0.35294 | ||
| AG+GG | 17 | 16% | 26 | 20% | 1.325 | 0.676–2.597 | 0.68 | 0.41076 | ||
| A | 199 | 92% | 235 | 90% | Ref | |||||
| G | 17 | 8% | 27 | 10% | 1.345 | 0.712–2.539 | 0.84 | 0.35942 | ||
*P < 0.05, SNP: Single Nucleotide Polymorphism, N = Number, Ref = Reference allele, OR: Odd Ratio.
Among the younger smokers (≤29 years), the AA, AC, and CC genotypes for the P21 SNP rs1801270 were found at rates of 3%, 24%, and 73% in the smokers, versus 7%, 31%, and 62% in the controls, respectively. When the younger smokers were compared to their non-smoking controls, the heterozygous AC and homozygous CC frequencies demonstrated no significant association with TSU, with the exception of the C allele frequency, which was strongly associated with TSU compared with the A reference allele (OR = 1.556, p = 0.03280). In the older smokers (˃29 years), who were also compared with their controls, no significant differences were found. The genotypes AA, AC, and CC for the SNP rs1801270 were found at rates of 7%, 31%, and 62% in the older smokers versus 7%, 37%, and 56% in the older non-smokers. When the C allele frequency in the older smokers was compared to that of the A reference allele, the association of the former was not significant (Table 3). For the MDM2 SNP rs769412, the association between TSU and age was also insignificant in both the younger and the older smokers, as shown in Table 3. In the younger group, the genotypes for this SNP were 87% for AA, 13% for AG, and 0% for GG in the smokers versus 85% for AA, 14% for AG, and 1% for GG in the non-smokers. Allele frequencies were 93% for A and 7% for G in the smokers versus 92% for A and 8% for G in the non-smokers (Table 3). Meanwhile, in the older smokers, the genotype frequencies were 80% for AA, 19% for AG, and 1% for GG versus 84% for AA, 16% for AG, and 0% for GG in the non-smokers. The allele frequencies were 90% for A and 10% for G in the smokers versus 92% for A and 8% for G in the non-smokers (Table 3).
To test the existence of associations among TSU, sex, and the SNPs in P53, P21, and MDM2, we divided the participants into two groups of males and females, including both smokers and their non-smoking controls. Group 1 comprised 259 male smokers and 201 male non-smokers, while Group 2 comprised 24 female smokers and 84 female non-smokers. The results indicated that the polymorphism rs1042522 in the P53 gene was associated with both male and female smokers rather than with non-smokers. As presented in Table 4, the CG, GG, and CG+GG genotypes, along with the G allele, presented strong associations with TSU in the male smokers versus the male non-smoking controls (OR = 3.510, p < 0.00005; OR = 5.213, p < 0.00002; OR = 4.058, p < 0.00007; and OR = 1.982, p < 0.00003, respectively). Similar significant results were obtained for the females (Table 4), although the cohort of female smokers was markedly smaller than that of their controls. Specifically, the CG, GG, and CG+GG genotypes and the G allele were strongly associated with TSU in the female smokers versus the non-smokers (OR = 11.304, p = 0.02626; OR = 32.378, p = 0.00042; OR = 18.724, p = 0.00386; and OR = 4.438, p = 0.00009, respectively). However, our results failed to prove the existence of any significant relationship between the polymorphism rs1801270 located in the P21 gene and TSU in either sex. In males, the genotypes AA, AC, and CC for this polymorphism were present at rates of 5%, 27%, and 68% in the smokers versus 7%, 31%, and 62% in the non-smokers, respectively (Table 4). In females, the same SNP genotype rates were 0%, 39%, and 61% in the smokers, versus 7%, 38%, and 55% in their controls, respectively. Moreover, in both sexes, the results obtained for the MDM2 SNP rs769412 indicated an insignificant association between the genotypic frequencies and TSU. The genotype frequencies in male and female smokers were 84% and 83% for the AA reference genotype, 16% and 17% for the heterozygous AG, and 0% for both double mutants GG. By contrast, in both males and females in the cohorts of controls for this variant, the rates were 83% and 89% for the AA reference genotype, 17% and 10% for the heterozygous AG, and 0% and 1% for the double mutant GG.
| Gene | SNP | Allele | Controls | Male | OR | 95% CI | X2 | P value | ||
|---|---|---|---|---|---|---|---|---|---|---|
| N | Percent | N | Percent | |||||||
| TP53 | rs1042522 | Total | 201 | 100% | 259 | 100% | ||||
| CC | 55 | 27% | 22 | 8% | Ref | |||||
| CG | 99 | 49% | 139 | 54% | 3.510 | 2.010–6.130 | 20.72 | <0.00005* | ||
| GG | 47 | 24% | 98 | 38% | 5.213 | 2.848–9.541 | 30.82 | <0.00002* | ||
| CG+GG | 146 | 73% | 237 | 92% | 4.058 | 2.375–6.934 | 28.91 | <0.00007* | ||
| C | 209 | 52% | 183 | 35% | Ref | |||||
| G | 193 | 48% | 335 | 65% | 1.982 | 1.519–2.586 | 25.70 | <0.00003* | ||
| P21 | rs1801270 | Total | 194 | 100% | 255 | 100% | ||||
| AA | 13 | 7% | 14 | 5% | Ref | |||||
| AC | 61 | 31% | 67 | 27% | 1.020 | 0.444–2.341 | 0.00 | 0.96291 | ||
| CC | 120 | 62% | 174 | 68% | 1.346 | 0.611–2.966 | 0.55 | 0.45921 | ||
| AC+CC | 181 | 93% | 241 | 95% | 1.236 | 0.567–2.695 | 0.29 | 0.59292 | ||
| A | 87 | 22% | 95 | 19% | Ref | |||||
| C | 301 | 78% | 415 | 81% | 1.263 | 0.911–1.750 | 1.96 | 0.16107 | ||
| MDM2 | rs769412 | Total | 198 | 100% | 258 | 100% | ||||
| AA | 164 | 83% | 216 | 84% | Ref | |||||
| AG | 34 | 17% | 41 | 16% | 0.916 | 0.557–1.506 | 0.12 | 0.72838 | ||
| GG | 0 | 0% | 1 | 0% | 2.279 | 0.092–56.315 | 0.76 | 0.38403 | ||
| AG+GG | 34 | 17% | 42 | 16% | 0.938 | 0.571–1.540 | 0.06 | 0.79987 | ||
| A | 362 | 91% | 473 | 92% | Ref | |||||
| G | 34 | 9% | 43 | 8% | 0.968 | 0.605–1.549 | 0.02 | 0.89186 | ||
| Gene | SNP | Allele | Controls | Female | OR | 95% CI | X2 | P value | ||
| N | Percent | N | Percent | |||||||
| TP53 | rs1042522 | Total | 84 | 100% | 24 | 100% | ||||
| CC | 23 | 27% | 0 | 0% | Ref | |||||
| CG | 39 | 47% | 9 | 37% | 11.304 | 0.629–203.248 | 4.94 | 0.02626* | ||
| GG | 22 | 26% | 15 | 63% | 32.378 | 1.827–573.843 | 12.43 | 0.00042* | ||
| CG+GG | 61 | 73% | 24 | 100% | 18.724 | 1.094–320.471 | 8.35 | 0.00386* | ||
| C | 85 | 51% | 9 | 19% | Ref | |||||
| G | 83 | 49% | 39 | 81% | 4.438 | 2.023–9.733 | 15.40 | 0.00009* | ||
| P21 | rs1801270 | Total | 80 | 100% | 23 | 100% | ||||
| AA | 6 | 7% | 0 | 0% | Ref | |||||
| AC | 30 | 38% | 9 | 39% | 4.049 | 0.208–78.705 | 1.73 | 0.18831 | ||
| CC | 44 | 55% | 14 | 61% | 4.236 | 0.225–79.876 | 1.85 | 0.17334 | ||
| AC+CC | 74 | 93% | 23 | 100% | 4.101 | 0.223–75.545 | 1.83 | 0.17593 | ||
| A | 42 | 26% | 9 | 20% | Ref | |||||
| C | 118 | 74% | 37 | 80% | 1.463 | 0.652–3.286 | 0.86 | 0.35456 | ||
| MDM2 | rs769412 | Total | 84 | 100% | 24 | 100% | ||||
| AA | 75 | 89% | 20 | 83% | Ref | |||||
| AG | 8 | 10% | 4 | 17% | 1.875 | 0.512–6.864 | 0.92 | 0.33655 | ||
| GG | 1 | 1% | 0 | 0% | 1.228 | 0.048–31.272 | 0.27 | 0.60608 | ||
| AG+GG | 9 | 11% | 4 | 17% | 1.667 | 0.465–5.976 | 0.62 | 0.42933 | ||
| A | 158 | 94% | 44 | 92% | Ref | |||||
| G | 10 | 6% | 4 | 8% | 1.436 | 0.430–4.801 | 0.35 | 0.52496 | ||
*P < 0.05, SNP: Single Nucleotide Polymorphism, N = Number, Ref = Reference allele, OR: Odd Ratio.
According to the daily TSU levels, we divided the 282 smokers into two groups: moderate smokers who smoked ≤12 times per day (n = 145) and heavy smokers who smoked ˃12 times per day (n = 137). This way, we were able to discover how their daily TSU levels were associated with changes in the P53, P21, and MDM2 genes. The results of the tests that we conducted indicated the presence of a significant association between smoking moderately and heavily and the mutation of the P53 SNP rs1042522. In moderate smokers, CG, GG, and CG+GG genotypes and the G allele of the P53 SNP were significantly affected by TSU compared with the non‐smokers (OR = 3.068, p = 0.00035; OR = 4.441, p < 0.00005; OR = 3.526, p = 0.00002; and OR = 1.905, p = 0.00001, respectively; Table 5). In the heavy smokers, there were also significant effects of TSU compared with the non-smokers (CG: OR = 5.087, p = 0.00001; GG: OR = 8.054, p < 0.00002; CG+GG: OR = 6.076, p < 0.00002; and G: OR = 2.251, p < 0.00001; Table 5). By contrast, analysis of the P21 SNP rs1801270 indicated that it had no association with TSU in either the moderate or the heavy smokers, even in comparison with the controls. The genotype frequencies were distributed as follows: 5% for AA, 28% for AC, and 67% for CC in the moderate smokers; 6% for AA, 26% for AC, and 68% for CC in the heavy smokers; and 7% for AA, 33% for AC, and 60% for CC in the controls. The allelic distributions for the SNP were as follows: 18% for the A allele and 82% for the C allele in the moderate smokers; 19% for the A allele and 81% for the C allele in the heavy smokers; and 24% for the A allele and 67% for the C allele in the controls. Next, we compared the rates of the MDM2 SNP rs769412 in the moderate and heavy smokers relative to their controls. No association was found between the rates of the MDM2 SNP rs769412 and the TSU levels in either of the two categories of smokers. The genotype distributions were as follows: 86% for AA, 14% for AG, and 0% for GG in the moderate smokers; 81% for AA, 18% for AG, and 1% for GG in the heavy smokers (Table 5); and 85% for AA, 15% for AG, and 0% for GG in the controls. In terms of allelic variation, the frequencies were 93% for the A allele and 90% for the G allele in the moderate smokers; 7% for the A allele and 10% for the G allele in the heavy smokers; and 92% for the A allele and 8% for the G allele in the controls.
| Gene | SNP | Allele | Controls | ≤12 times/day | OR | 95% CI | X2 | P value | ||
|---|---|---|---|---|---|---|---|---|---|---|
| N | Percent | N | Percent | |||||||
| TP53 | rs1042522 | Total | 285 | 100% | 145 | 100% | ||||
| CC | 78 | 27% | 14 | 10% | Ref | |||||
| CG | 138 | 49% | 76 | 52% | 3.068 | 1.628–5.785 | 12.77 | 0.00035* | ||
| GG | 69 | 24% | 55 | 38% | 4.441 | 2.272–8.680 | 20.63 | <0.00005* | ||
| CG+GG | 207 | 73% | 131 | 90% | 3.526 | 1.917–6.486 | 17.93 | 0.00002* | ||
| C | 294 | 52% | 104 | 36% | Ref | |||||
| G | 276 | 48% | 186 | 64% | 1.905 | 1.424–2.548 | 19.10 | 0.00001* | ||
| P21 | rs1801270 | Total | 274 | 100% | 142 | 100% | ||||
| AA | 19 | 7% | 6 | 5% | Ref | |||||
| AC | 91 | 33% | 39 | 28% | 1.357 | 0.504–3.658 | 0.37 | 0.54499 | ||
| CC | 164 | 60% | 95 | 67% | 1.834 | 0.708–4.753 | 1.60 | 0.20597 | ||
| AC+CC | 255 | 93% | 134 | 95% | 1.664 | 0.649–4.266 | 1.15 | 0.28448 | ||
| A | 129 | 24% | 51 | 18% | Ref | |||||
| C | 419 | 76% | 229 | 82% | 1.382 | 0.963–1.985 | 3.09 | 0.07879 | ||
| MDM2 | rs769412 | Total | 282 | 100% | 143 | 100% | ||||
| AA | 239 | 85% | 123 | 86% | Ref | |||||
| AG | 42 | 15% | 20 | 14% | 0.925 | 0.521–1.645 | 0.07 | 0.79127 | ||
| GG | 1 | 0% | 0 | 0% | 0.646 | 0.026–15.985 | 0.51 | 0.47345 | ||
| AG+GG | 43 | 15% | 20 | 14% | 0.904 | 0.509–1.603 | 0.12 | 0.72933 | ||
| A | 520 | 92% | 266 | 93% | Ref | |||||
| G | 44 | 8% | 20 | 7% | 0.889 | 0.513–1.538 | 0.18 | 0.67299 | ||
| Gene | SNP | Allele | Controls | ˃12 times/day | OR | 95% CI | X2 | P value | ||
| N | Percent | N | Percent | |||||||
| TP53 | rs1042522 | Total | 285 | 100% | 137 | 100% | ||||
| CC | 78 | 27% | 8 | 6% | Ref | |||||
| CG | 138 | 49% | 72 | 52% | 5.087 | 2.329–11.113 | 19.31 | 0.00001* | ||
| GG | 69 | 24% | 57 | 42% | 8.054 | 3.591–18.065 | 31.05 | <0.00002* | ||
| CG+GG | 207 | 73% | 129 | 94% | 6.076 | 2.841–12.994 | 26.43 | <0.00002* | ||
| C | 294 | 52% | 88 | 32% | Ref | |||||
| G | 276 | 48% | 186 | 68% | 2.251 | 1.664–3.046 | 28.29 | <0.00001* | ||
| P21 | rs1801270 | Total | 274 | 100% | 137 | 100% | ||||
| AA | 19 | 7% | 8 | 6% | Ref | |||||
| AC | 91 | 33% | 36 | 26% | 0.940 | 0.378–2.338 | 0.02 | 0.89338 | ||
| CC | 164 | 60% | 93 | 68% | 1.347 | 0.567–3.197 | 0.46 | 0.49836 | ||
| AC+CC | 255 | 93% | 129 | 94% | 1.201 | 0.512–2.819 | 0.18 | 0.67276 | ||
| A | 129 | 24% | 52 | 19% | Ref | |||||
| C | 419 | 76% | 222 | 81% | 1.314 | 0.916–1.885 | 2.21 | 0.13676 | ||
| MDM2 | rs769412 | Total | 282 | 100% | 138 | 100% | ||||
| AA | 239 | 85% | 112 | 81% | Ref | |||||
| AG | 42 | 15% | 25 | 18% | 1.270 | 0.738–2.188 | 0.75 | 0.38779 | ||
| GG | 1 | 0% | 1 | 1% | 2.134 | 0.132–34.427 | 0.30 | 0.58447 | ||
| AG+GG | 43 | 15% | 26 | 19% | 1.290 | 0.755–2.206 | 0.87 | 0.35070 | ||
| A | 520 | 92% | 249 | 90% | Ref | |||||
| G | 44 | 8% | 27 | 10% | 1.281 | 0.775–2.118 | 0.94 | 0.33227 | ||
*P < 0.05, SNP: Single Nucleotide Polymorphism, N = Number, Ref = Reference allele, OR: Odd Ratio.
To further investigate any associations between TSU in terms of number of years smoking and changes occurring in the P53, P21, and MDM2 genes, we divided our smokers into two groups based on the number of years that they had smoked. Group 1 comprised 172 short-term smokers who had smoked for ≤7 years, while Group 2 comprised 110 long-term smokers who had smoked for ˃7 years. Table 6 describes of the statistical analysis and the differences in SNP genotypes between the short-term and long-term smokers, and their corresponding controls. There were significant associations in the frequencies of the genotypes CG, GG, and CG+GG and the G allele of the P53 SNP rs1042522 in both the short-term and long-term smokers versus their controls. In the short-term smokers, the OR ratios and p values were: i) OR = 2.959 and p = 0.00021; ii) OR = 4.389 and p < 0.00001; iii) OR = 3.436 and p < 0.00008; and iv) OR = 1.914 and p < 0.00003, respectively. In the long-term smokers they were: i) OR = 6.557 and p = 0.00002; ii) OR = 10.626 and p < 0.00004; iii) OR = 7.913 and p < 0.00006; and, iv) OR = 2.381 and p < 0.00001, respectively (Table 6). When both the short- and long-term smokers were compared with the controls, the frequencies of their genotypes at the P21 SNP rs1801270 demonstrated no significant association with TSU. The genotype distributions were as follows: 4% for AA, 25% for AC, and 71% for CC in the short-term smokers; 7% for AA, 31% for AC, and 62% for CC in the long-term smokers; and 7% for AA, 33% for AC, and 60% for CC in the controls. In addition, the frequency of the C allele presented a significant association with the short-term smokers in comparison to their controls (OR = 1.596, p = 0.00882), but failed to present any association in the long-term smokers (OR = 1.059, p = 0.76203). Furthermore, in both groups, the MDM2 SNP rs769412 presented no significant association with TSU over a number of years. The genotypes AA, AG, and GG were present at rates of 86%, 14%, and 0% in the short-term smokers; 80%, 19%, and 1% in the long-term smokers (Table 6); and 85%, 15%, and 0% in the controls, respectively. For the wild‐type A allele, it was present at a rate of 93% in the short-term smokers, 89% in the long-term smokers, and 92% in the non-smokers. For the mutant G allele, it was present at 7% in the short-term smokers, 11% in the long-term smokers, and 8% in the non-smokers (Table 6).
| Gene | SNP | Allele | Controls | ≤ 7 Years | OR | 95% CI | X2 | P value | ||
|---|---|---|---|---|---|---|---|---|---|---|
| N | Percent | N | Percent | |||||||
| TP53 | rs1042522 | Total | 285 | 100% | 172 | 100% | ||||
| CC | 78 | 27% | 17 | 10% | Ref | |||||
| CG | 138 | 49% | 89 | 52% | 2.959 | 1.643–5.330 | 13.78 | 0.00021* | ||
| GG | 69 | 24% | 66 | 38% | 4.389 | 2.352–8.189 | 23.22 | <0.00001* | ||
| CG+GG | 207 | 73% | 155 | 90% | 3.436 | 1.954–6.041 | 19.91 | <0.00008* | ||
| C | 294 | 52% | 123 | 36% | Ref | |||||
| G | 276 | 48% | 221 | 64% | 1.914 | 1.454–2.520 | 21.65 | <0.00003* | ||
| P21 | rs1801270 | Total | 274 | 100% | 167 | 100% | ||||
| AA | 19 | 7% | 6 | 4% | Ref | |||||
| AC | 91 | 33% | 42 | 25% | 1.462 | 0.544–3.925 | 0.57 | 0.44965 | ||
| CC | 164 | 60% | 119 | 71% | 2.298 | 0.891–5.928 | 3.10 | 0.07813 | ||
| AC+CC | 255 | 93% | 161 | 96% | 1.999 | 0.782–5.112 | 2.17 | 0.14105 | ||
| A | 129 | 24% | 54 | 16% | Ref | |||||
| C | 419 | 76% | 280 | 84% | 1.596 | 1.123–2.270 | 6.86 | 0.00882* | ||
| MDM2 | rs769412 | Total | 282 | 100% | 168 | 100% | ||||
| AA | 239 | 85% | 145 | 86% | Ref | |||||
| AG | 42 | 15% | 23 | 14% | 0.903 | 0.521–1.562 | 0.13 | 0.71432 | ||
| GG | 1 | 0% | 0 | 0% | 0.549 | 0.022–13.558 | 0.61 | 0.43640 | ||
| AG+GG | 43 | 15% | 23 | 14% | 0.882 | 0.510–1.523 | 0.20 | 0.65141 | ||
| A | 520 | 92% | 313 | 93% | Ref | |||||
| G | 44 | 8% | 23 | 7% | 0.868 | 0.515–1.466 | 0.28 | 0.59710 | ||
| Gene | SNP | Allele | Controls | ˃ 7 years | OR | 95% CI | X2 | P value | ||
| N | Percent | N | Percent | |||||||
| TP53 | rs1042522 | Total | 285 | 100% | 110 | 100% | ||||
| CC | 78 | 27% | 5 | 4% | Ref | |||||
| CG | 138 | 49% | 58 | 53% | 6.557 | 2.524–17.035 | 18.53 | 0.00002* | ||
| GG | 69 | 24% | 47 | 43% | 10.626 | 3.999–28.234 | 29.82 | <0.00004* | ||
| CG+GG | 207 | 73% | 105 | 96% | 7.913 | 3.109–20.140 | 24.91 | <0.00006* | ||
| C | 294 | 52% | 68 | 31% | Ref | |||||
| G | 276 | 48% | 152 | 69% | 2.381 | 1.712–3.311 | 27.32 | <0.00001* | ||
| P21 | rs1801270 | Total | 274 | 100% | 111 | 100% | ||||
| AA | 19 | 7% | 8 | 7% | Ref | |||||
| AC | 91 | 33% | 34 | 31% | 0.887 | 0.355–2.216 | 0.07 | 0.79793 | ||
| CC | 164 | 60% | 69 | 62% | 0.999 | 0.418–2.391 | 0.00 | 0.99863 | ||
| AC+CC | 255 | 93% | 103 | 93% | 0.959 | 0.407–2.261 | 0.01 | 0.92433 | ||
| A | 129 | 24% | 50 | 23% | Ref | |||||
| C | 419 | 76% | 172 | 77% | 1.059 | 0.730–1.536 | 0.09 | 0.76203 | ||
| MDM2 | rs769412 | Total | 282 | 100% | 113 | 100% | ||||
| AA | 239 | 85% | 90 | 80% | Ref | |||||
| AG | 42 | 15% | 22 | 19% | 1.391 | 0.787–2.460 | 1.30 | 0.25503 | ||
| GG | 1 | 0% | 1 | 1% | 2.656 | 0.164–42.907 | 0.51 | 0.47455 | ||
| AG+GG | 43 | 15% | 23 | 20% | 1.420 | 0.810–2.490 | 1.51 | 0.21897 | ||
| A | 520 | 92% | 202 | 89% | Ref | |||||
| G | 44 | 8% | 24 | 11% | 1.404 | 0.832–2.369 | 1.63 | 0.20187 | ||
*P < 0.05, SNP: Single Nucleotide Polymorphism, N = Number, Ref = Reference allele, OR: Odd Ratio.
To evaluate the risk associated with the type of TSU smoked, we regrouped the smokers into two categories. Group 1 was made up of 213 individuals who smoked cigarettes and Group 2 of 69 individuals who smoked shisha. For P53 SNP rs1042522, the genotype distributions and allele frequencies were significantly associated with TSU in both groups of smokers versus their controls. In the cigarette smokers, the heterozygous CG demonstrated an approximately five-fold increased association (OR = 4.783; CI = 2.526–9.055; p < 0.00003) for the type of substance smoked (tobacco) and the homozygous GG genotype manifested an eight-fold association (OR = 7.826; CI = 4.022–15.228; p < 0.00006) (Table 7). In addition, grouping the two genotypes CG+GG together yielded a 5.797-fold increase in association (OR = 5.797; CI = 3.123–10.760; p < 0.00001), while the G phenotype showed more than a two-fold association in comparison with the C phenotype (OR = 2.271; CI = 1.748–2.951; p < 0.00005). In the shisha smokers, for the same SNP, the CG genotype showed more than a two-fold increase in correlation with the type of substance smoked (OR = 2.324; CI = 1.066–5.067; p = 0.03050), while the GG genotype presented an approximately three-fold increase in association compared with the reference CC (OR = 2.889; CI = 1.252–6.665; p = 0.01054). For the combination of the two genotypes CG+GG, a 2.512-fold increase in association with shisha smoking was noted (OR = 2.512; CI = 1.190–5.304; p = 0.01314), in contrast to the G allele phenotype, which presented a slightly lower drop in its results (OR = 1.608; CI = 1.101–2.347; p = 0.01345). Moreover, the genotype frequency of the P21 SNP rs1801270 demonstrated no significant type of TSU association in either group of smokers when they were compared to their controls. The rates of AA, AC, and CC genotypes in the cigarette and shisha smokers were as follows: 6% and 3% for AA, 28% and 25% for AC and 66% and 72% for CC, respectively. In the non-smokers, the results were 7% for AA, 33% for AC, and 60% for CC. Although the frequency of the C allele did not demonstrate any significant association with the type of TSU in the group of smokers who smoked cigarettes (OR = 1.262, p = 0.14373), an association was found in the smokers of shisha versus their controls (OR = 1.608, p = 0.04104). Regarding the results of the MDM2 SNP rs769412, no significant association was found between the types of TSU in either group of smokers when compared with their controls. The genotype distribution for AA, AG, and GG in the cigarette smokers was found to be 84%, 16%, and 0% versus 82%, 18%, and 0% in the shisha smokers (Table 7), while it was 85%, 15%, and 0% in the controls, respectively. Finally, the frequency of the G allele presented no significant association in either group of smokers when compared with their controls, as shown in Table 7.
| Gene | SNP | Allele | Controls | Cigarettes | OR | 95% CI | X2 | P value | ||
|---|---|---|---|---|---|---|---|---|---|---|
| N | Percent | N | Percent | |||||||
| TP53 | rs1042522 | Total | 285 | 100% | 213 | 100% | ||||
| CC | 78 | 27% | 13 | 6% | Ref | |||||
| CG | 138 | 49% | 110 | 52% | 4.783 | 2.526–9.055 | 26.04 | <0.00003* | ||
| GG | 69 | 24% | 90 | 42% | 7.826 | 4.022–15.228 | 42.78 | <0.00006* | ||
| CG+GG | 207 | 73% | 200 | 94% | 5.797 | 3.123–10.760 | 36.91 | <0.00001* | ||
| C | 294 | 52% | 136 | 32% | Ref | |||||
| G | 276 | 48% | 290 | 68% | 2.271 | 1.748–2.951 | 38.39 | <0.00005* | ||
| P21 | rs1801270 | Total | 274 | 100% | 209 | 100% | ||||
| AA | 19 | 7% | 12 | 6% | Ref | |||||
| AC | 91 | 33% | 58 | 28% | 1.009 | 0.456–2.233 | 0.00 | 0.98205 | ||
| CC | 164 | 60% | 139 | 66% | 1.342 | 0.629–2.862 | 0.58 | 0.44520 | ||
| AC+CC | 255 | 93% | 197 | 94% | 1.223 | 0.580–2.580 | 0.28 | 0.59618 | ||
| A | 129 | 24% | 82 | 20% | Ref | |||||
| C | 419 | 76% | 336 | 80% | 1.262 | 0.924–1.723 | 2.14 | 0.14373 | ||
| MDM2 | rs769412 | Total | 282 | 100% | 213 | 100% | ||||
| AA | 239 | 85% | 179 | 84% | Ref | |||||
| AG | 42 | 15% | 33 | 16% | 1.049 | 0.639–1.722 | 0.04 | 0.84963 | ||
| GG | 1 | 0% | 1 | 0% | 1.335 | 0.083–21.491 | 0.04 | 0.83788 | ||
| AG+GG | 43 | 15% | 34 | 16% | 1.056 | 0.647–1.723 | 0.05 | 0.82815 | ||
| A | 520 | 92% | 391 | 92% | Ref | |||||
| G | 44 | 8% | 35 | 8% | 1.058 | 0.666–1.681 | 0.06 | 0.81163 | ||
| Gene | SNP | Allele | Controls | Shisha | OR | 95% CI | X2 | P value | ||
| N | Percent | N | Percent | |||||||
| TP53 | rs1042522 | Total | 285 | 100% | 69 | 100% | ||||
| CC | 78 | 27% | 9 | 13% | Ref | |||||
| CG | 138 | 49% | 37 | 54% | 2.324 | 1.066–5.067 | 4.68 | 0.03050* | ||
| GG | 69 | 24% | 23 | 33% | 2.889 | 1.252–6.665 | 6.54 | 0.01054* | ||
| CG+GG | 207 | 73% | 60 | 87% | 2.512 | 1.190–5.304 | 6.15 | 0.01314* | ||
| C | 294 | 52% | 55 | 40% | Ref | |||||
| G | 276 | 48% | 83 | 60% | 1.608 | 1.101–2.347 | 6.11 | 0.01345* | ||
| P21 | rs1801270 | Total | 274 | 100% | 68 | 100% | ||||
| AA | 19 | 7% | 2 | 3% | Ref | |||||
| AC | 91 | 33% | 17 | 25% | 1.775 | 0.378–8.331 | 0.54 | 0.46200 | ||
| CC | 164 | 60% | 49 | 72% | 2.838 | 0.639–12.614 | 2.04 | 0.15340 | ||
| AC+CC | 255 | 93% | 66 | 97% | 2.459 | 0.559–10.823 | 1.51 | 0.21956 | ||
| A | 129 | 24% | 21 | 15% | Ref | |||||
| C | 419 | 76% | 115 | 85% | 1.686 | 1.017–2.794 | 4.17 | 0.04104* | ||
| MDM2 | rs769412 | Total | 282 | 100% | 68 | 100% | ||||
| AA | 239 | 85% | 56 | 82% | Ref | |||||
| AG | 42 | 15% | 12 | 18% | 1.219 | 0.603–2.467 | 0.31 | 0.58059 | ||
| GG | 1 | 0% | 0 | 0% | 1.413 | 0.057–35.142 | 0.23 | 0.62848 | ||
| AG+GG | 43 | 15% | 12 | 18% | 1.191 | 0.590–2.406 | 0.24 | 0.62563 | ||
| A | 520 | 92% | 124 | 91% | Ref | |||||
| G | 44 | 8% | 12 | 9% | 1.144 | 0.587–2.230 | 0.16 | 0.69330 | ||
*P < 0.05, SNP: Single Nucleotide Polymorphism, N = Number, Ref = Reference allele, OR: Odd Ratio.
The SNPs of the P53, P21, and MDM2 genes that we selected were located in exonic regions. We thus examined them for their potential effects on the P53, P21, and MDM2 proteins by using the Phyre2 server and PyMOL software [54]. The overall structure of the domains of the P53 protein is presented in Fig 1A. Its main domain is the transactivation domain (TAD) in the N-terminal region. This is divided into two basic subdomains, namely, TAD1 and TAD2, with the latter being a proline-rich region (PRR). This is followed by its core region, the DNA-binding domain (DBD), and its linker region, which connects its core domain with its tetramerization domain (OD). Its last domain, the C-terminal domain, is located in the C-terminal region [56].

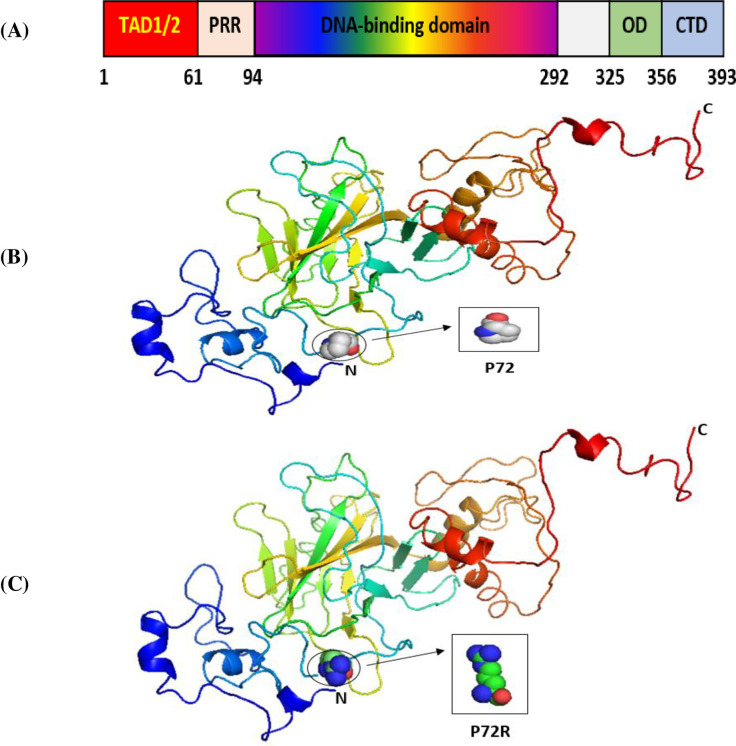
The 3D structures of normal and mutated P53 proteins.
Panel (A) shows the major domain structure of a P53 protein. Panel (B) shows the 3D structure of the wild-type P53 protein (P72). Panel (C) shows the 3D structure of a P53 protein with an SNP (P72R).
Our results indicated that the wild-type structure of the P53 protein includes a proline amino acid, which is located at position 72 in the PRR. It displays approximately 61 to 94 residues of the P53 protein (Fig 1B). This is contrary to what we discovered that occurs for the SNP P72R at rs1042522, whereby structure and functioning are affected by the P53 protein, especially at the PRR level, and where proline is substituted by an arginine that is normally located at number 72 on P53 (Fig 1C). In other words, this polymorphism becomes damaging by association with TSU. For the P21 protein, the main domain is presented in Fig 2A. Within it are two subdomains, namely, Cyc1 and Cyc2, located in the N- and C-terminal regions, respectively. P21 contains other domains, such as CDK, which is also located in the C-terminal region, and PCNA, which can be found in the NLS region [57].
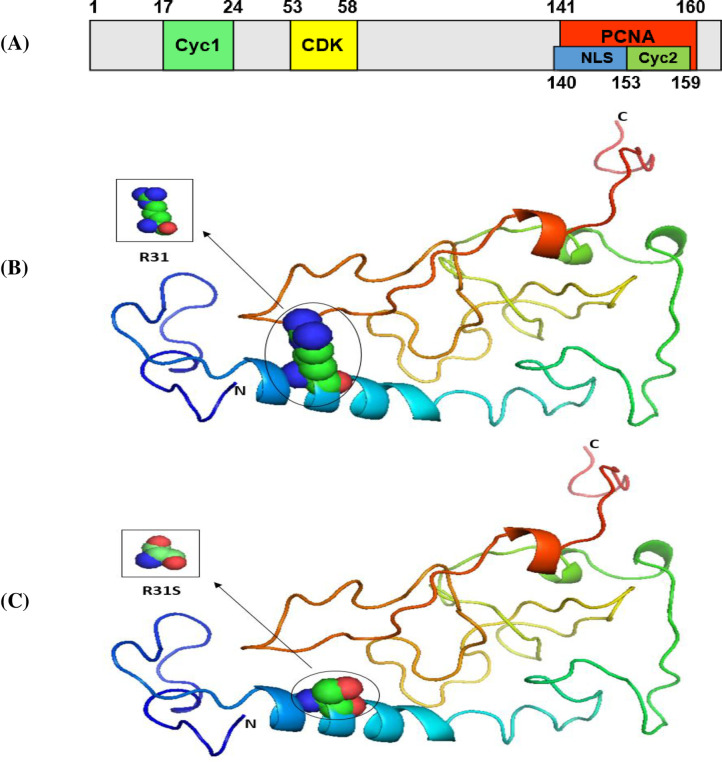
The 3D structures of normal and mutated P21 proteins.
Panel (A) shows the major domain structure of a P21 protein. Panel (B) shows the 3D structure of a normal P21 protein (R31). Panel (C) shows the 3D structure of a P21 protein with an SNP (R31S).
Our results indicated that the wild-type structure of P21 usually has an arginine amino acid located at position 31 (Fig 2B), but R31S at rs1801270 replaces its residue with a serine amino acid (Fig 2C). In other words, R31S, a coding-region non-synonymous SNP, transforms P21’s amino acid sequence without affecting its functional domains. Therefore, we found no association between it and TSU in the sample Saudi population included in this study. Based on the results obtained using Phyre2 and PyMOL, the structure of the MDM2 protein does not change with the E354E SNP rs769412, given its synonymous status. This is because a coding SNP cannot change the sequence of MDM2. Similar amino acid (glutamic acid) levels to those found at MDM2's number 354 were found to be present at its location (Fig 3). As such, the SNP E354E is not associated with TSU in Saudi smokers.
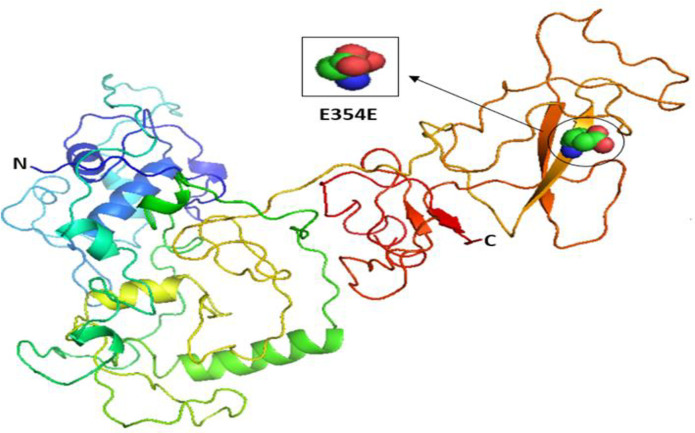
The 3D structures of normal and mutated MDM2 proteins.
Comparative studies on the genotyping results for the selected SNPs in non-smokers were conducted on samples collected from the Saudi population in Riyadh (CRS) and other previously studied populations based on literature data available from the International HapMap project (http://hapmap.ncbi.nlm.nih.gov/). The results for the selected SNPs are presented in Tables 8–10. The allelic and genotypic frequencies for the P53 SNP rs1042522 differed greatly in the European (CEU; p < 0.00001) and Nigerian (YRI; p = 0.00682) populations compared with those in Saudi Arabia (Table 8). In addition, the frequencies of the various alleles of the P21 SNP rs1801270 differed greatly among the following populations: i) Utah residents with Northern and Western European ancestry (CEU) whose samples were collected in Paris, France at The Foundation Jean Dausset-CEPH (formerly known as the Center of Study of Human Polymorphisms); ii) Han Chinese residents from Beijing, China (HCB); iii) Chinese residents from Metropolitan Denver, Colorado, USA (CHD); iv) Japanese residents from Tokyo, Japan (JPT); v) Luhya residents from Webuye, Kenya (LWK); and vi) Italian residents from Tuscany, Italy (TSI). The frequencies in all of these populations differed greatly from those of the Saudis from Riyadh (p < 0.005) (Table 9). For the MDM2 SNP rs769412, there were also significant differences in the CRS population for the rs769412 genotype compared with the populations of JPT (p = 0.001857) and LWK (p = 0.001266) (Table 10).
| SNP ID | Populations | Samples (N) | Genotype frequency N (%) | X2 | P value | |
|---|---|---|---|---|---|---|
| C | G | |||||
| rs1042522 | CEU | 120 | 28 (0.23) | 92 (0.77) | 27.54 | <0.00001 |
| HCB | 90 | 43 (0.48) | 47 (0.52) | 0.354 | 0.55145 | |
| JPT | 88 | 39 (0.44) | 49 (0.56) | 3.650 | 0.05604 | |
| YRI | 118 | 78 (0.66) | 40 (0.34) | 7.318 | 0.00682 | |
| CRS | 285 | 147 (0.52) | 138 (0.48) | Refs | ||
CEU: Utah residents with Northern and Western European ancestry from the CEPH collection. HCB: Han Chinese in Beijing, China. JPT: Japanese in Tokyo, Japan. YRI: Yoruba in Ibadan, Nigeria. CRS: Saudi population residing in the Riyadh region of central Saudi Arabia.
| SNP ID | Populations | Samples (N) | Genotype frequency N (%) | X2 | P value | |
|---|---|---|---|---|---|---|
| A | C | |||||
| rs1801270 | CEU | 224 | 9 (0.04) | 215 (0.96) | 37.17 | <0.00001 |
| HCB | 86 | 40 (0.47) | 46 (0.53) | 16.62 | <0.00001 | |
| JPT | 170 | 66 (0.39) | 104 (0.61) | 12.26 | 0.000462 | |
| YRI | 224 | 69 (0.31) | 155 (0.69) | 2.697 | 0.100554 | |
| ASW | 98 | 26 (0.27) | 72 (0.73) | 0.179 | 0.672645 | |
| CHD | 168 | 86 (0.51) | 82 (0.49) | 35.86 | <0.00001 | |
| GIH | 176 | 32 (0.18) | 144 (0.82) | 1.811 | 0.178423 | |
| LWK | 180 | 58 (0.32) | 122 (0.68) | 4.218 | 0.039999 | |
| MEX | 98 | 25 (0.26) | 73 (0.74) | 0.139 | 0.709696 | |
| MKK | 284 | 74 (0.26) | 210 (0.74) | 0.024 | 0.876376 | |
| TSI | 176 | 18 (0.10) | 158 (0.90) | 15.03 | 0.000106 | |
| CRS | 274 | 66 (0.24) | 208 (0.76) | Refs | ||
CEU: Utah residents with Northern and Western European ancestry from the CEPH collection. HCB: Han Chinese in Beijing, China. JPT: Japanese in Tokyo, Japan. YRI: Yoruba in Ibadan, Nigeria. ASW: African ancestry in Southwest USA. CHD: Chinese in Metropolitan Denver, Colorado. GIH: Gujarati Indians in Houston, Texas. LWK: Luhya in Webuye, Kenya. MEX: Mexican ancestry in Los Angeles, California. MKK: Maasai in Kinyawa, Kenya. TSI: Toscans in Italy. CRS: Saudi population residing in the Riyadh region of central Saudi Arabia.
| SNP ID | Populations | Samples (N) | Genotype frequency N (%) | X2 | P value | |
|---|---|---|---|---|---|---|
| A | G | |||||
| rs769412 | CEU | 226 | 210 (0.93) | 16 (0.07) | 0.708 | 0.400258 |
| HCB | 86 | 83 (0.97) | 3 (0.03) | 2.075 | 0.149684 | |
| JPT | 172 | 170 (0.99) | 2 (0.01) | 9.685 | 0.001857 | |
| YRI | 226 | 201 (0.89) | 25 (0.11) | 1.465 | 0.226213 | |
| ASW | 98 | 84 (0.86) | 13 (0.13) | 2.477 | 0.115505 | |
| CHD | 170 | 163 (0.96) | 7 (0.04) | 2.568 | 0.109046 | |
| GIH | 174 | 160 (0.92) | 14 (0.08) | 0.035 | 0.851414 | |
| LWK | 180 | 148 (0.82) | 32 (0.18) | 10.391 | 0.001266 | |
| MEX | 100 | 92 (0.92) | 8 (0.08) | 0.000 | 1.000000 | |
| MKK | 286 | 252 (0.88) | 34 (0.12) | 2.526 | 0.111949 | |
| TSI | 176 | 164 (0.93) | 12 (0.07) | 0.187 | 0.665383 | |
| CRS | 282 | 259 (0.92) | 23 (0.08) | Refs | ||
CEU: Utah residents with Northern and Western European ancestry from the CEPH collection. HCB: Han Chinese in Beijing, China. JPT: Japanese in Tokyo, Japan. YRI: Yoruba in Ibadan, Nigeria. ASW: African ancestry in Southwest USA. CHD: Chinese in Metropolitan Denver, Colorado. GIH: Gujarati Indians in Houston, Texas. LWK: Luhya in Webuye, Kenya. MEX: Mexican ancestry in Los Angeles, California. MKK: Maasai in Kinyawa, Kenya. TSI: Toscans in Italy. CRS: Saudi population residing in the Riyadh region of central Saudi Arabia.
In humans, cells have several protective pathways that can inhibit damaged DNA from duplicating itself and prevent DNA damage from occurring within self-replication pathways [58]. Genes encoding components of the P53 protein pathway are among the most widely recognized protective factors acting as tumor suppressors [56]. Nicknamed the “guardian of the genome,” the function of the TP53 pathway is essentially a protective one. Previous findings support our hypothesis that there is an association between TSU and SNP in TP53, in the context of the development of TSU‐related diseases. Although SNPs can contribute to the effectiveness of DNA repair by altering protein functions [57, 59], genetic variations caused by TSU bring about the development of several different cancer types in humans. Since a prior literature review has failed to identify any effects of TSU in generating genetic variations in components of the pathway of the TP53 gene, in the present research, we investigated the potential relationship between TSU and genetic components, especially the exonic genetic polymorphism rs1042522 in the P53 gene, the rs1801270 in the P21 gene, and the rs769412 in the MDM2 gene, which may lead to the progression of numerous diseases in humans. To investigate and identify the genetic markers that could help in determining how to decrease the risk of TSU-related diseases, we studied a sample of smokers and non-smokers from the Saudi population. A general significant association was observed in the effects of TSU on the gene polymorphisms of P53 (rs1042522) and P21 (rs1801270) in the sample of smokers in the present study. However, neither genetic nor allelic alterations were found to have occurred at SNP rs769412and MDM2, although they were found to have occurred on the P53 variant, in the Saudi smokers and non-smoking controls. The P53 polymorphism rs1042522, located in exon 4 at codon 72, involves the missense substitution C>G, which causes an amino acid transversion of proline (Pro) to arginine (Arg). In other words, amino acid transversions alter the function of P53’s protein [60]. Given the fundamental role of the P53 polymorphism rs1042522 in tumorigenesis, many researchers are attempting to explain the mechanism by which it affects the risk of developing certain cancer types. Notably, the results of the present study demonstrate that the genotype and allele frequencies of P53 rs1042522 for all clinical parameters that we tested, including age, sex, number of years smoking, daily consumption levels, and substance type, are higher in smokers than in non-smokers, thus contributing to their greater risk of developing TSU-related diseases. Similar results were found for the P53 SNP rs1042522 in other populations suffering from various malignancies [52, 61–64]. For example, previous studies found associations between rs1042522 and an increased susceptibility to developing thyroid cancer in the Indian population [61] and of developing lung adenocarcinoma in the Chinese female population [52]. The genetic variant of P21, Ser31Arg rs1801270, located at the polymorphic site codon 31, also induces changes in amino acids by mutating serine (Ser) into arginine (Arg). As an SNP located in an exonic region, it might also alter the function of P21 [65]. Several other studies have mentioned an association between the polymorphism rs1801270 and the risk of developing any of several types of malignancies, including gastric, breast, and cervical cancers. Although rs1801270 exerts several effects on a great number of cancer types [66], the results of studies on this subject remain inconclusive [67–69]. One such previous study conducted on a population of Chinese women found an association between the A allele of P21 rs1801270 and decreased cervical cancer susceptibility [68]. However, Taghavi et al. stated that in northeastern Iran, rs1801270 is not a genetic biomarker for esophageal carcinoma [44]. The results of the present study indicate that the P21 rs1801270 C allele increases the risk of developing TSU-related diseases. Surprisingly, the increase in risk was higher in younger tobacco smokers and shisha users who had been consuming tobacco products for less than seven years than the rest of the cohort. Although our test results for the polymorphism of the C allele for rs1801270 resemble those in previous reports [70–72], they also differ [73, 74] in terms of our discovery of its deleterious effects on smokers. This discrepancy might have been caused by the different demographics and populations sampled, including the ethnic groups studied, the sample sizes, and the genetic makeup (genotype). In addition, there could have been impacts of other demographic factors influencing health by causing morbidity and mortality disparities overall, such as ethnicity, social identity, economic status, environment, and culture [75] Our study found that age significantly (p < 0.05) influences the association between TSU and the C allele for P21 rs1801270. In addition, for the MDM2 gene encoding a negative regulator of P53 [76] involved in tumor growth and metastasis [77], the SNP rs769412 generates an A>G base change at codon 354. However, despite the fact that it causes binding on the Sp1 site, as a variant, it plays no part in causing amino acid substitution at rs769412. For example, in the African-American population, it showed no associations with lung cancer in smokers [78]. Moreover, in a study by Rajaraman et al. (2007), the MDM2 polymorphism rs769412 was instead found to have a protective effect against glioma [79]. Our study investigated this MDM2 variant in smokers versus non-smokers in the Saudi Arabian population for the first time. Notably, we found that it had no significant association with smoking in either of our cohorts. Therefore, our findings are similar to those of most previous studies in this area involving various populations [48, 76, 78, 80], except for the research conducted by Rajaraman et al. (2007) [79]. The results that we obtained are a useful addition to currently existing findings on the effects of TSU on an MDM2 SNP that causes the development of various malignant diseases in smokers. However, we recommend further confirmatory studies on the MDM2 SNP rs769412. It should also be noted that the number of females who participated in our study was insufficient to determine with any great statistical precision any findings regarding the polymorphisms of P21 and MDM2 in this sex. Therefore, to confirm our findings, we strongly suggest the performance of more studies on the female Saudi population through functional analysis and sampling of larger cohorts. The findings can then be compared in terms of the various demographic factors with those of other populations. There is also a need to investigate in greater detail the relationship between TSU and mutations in P53, P21, and MDM2 that lead to the development of malignant diseases. Finally, since several previous studies, including our own, have documented the harmful effects of smoking on the health of younger people and their greater risk of developing breast cancer [81, 82], we strongly recommend anti-smoking campaigns to specifically focus particularly on adolescents and young adults and help them choose a healthy lifestyle by avoiding or quitting smoking.
Our results demonstrate the higher effector role of the P53 SNP rs1042522 polymorphism in all clinical parameters that increase smokers’ potential risk of developing TSU‐related diseases. We believe that more studies involving the Saudi population are warranted to discover novel diagnostic biomarkers that would assist in the early detection and diagnosis of TSU-related diseases.
The authors thank the Deanship of Scientific Research and RSSU at King Saud University for their technical support.
| TSU | tobacco substance usage |
| SNPs | single nucleotide polymorphisms |
| EDTA | ethylenediaminetetraacetic acid |
| CI | confidence interval |
| OR | odds ratio |
| HWE | Hardy-Weinberg equilibrium (HWE) |
| Pro | Proline |
| Arg | Arginine |
| Ser | Serine |
| Glu | Glutamic Acid. |
1
2
3
4
5
6
7
8
9
10
11
12
13
14
15
16
17
18
19
20
21
22
23
24
25
27
28
29
30
31
32
33
34
35
36
37
38
39
40
41
42
43
44
45
46
47
48
49
50
51
52
53
54
55
56
57
58
59
60
61
62
63
64
65
66
67
68
69
70
71
72
73
74
75
76
77
78
79
80
81
82
 Association between tobacco substance usage and a missense mutation in the tumor suppressor gene P53 in the Saudi Arabian population
 Facebook
 Twitter
 Linkedin
 Whatsapp

