
Competing Interests: The authors have declared that no competing interests exist.
Although aquatic macroinvertebrates and freshwater fishes are important indicators for freshwater quality assessments, the morphological identification to species-level is often impossible and thus especially in many invertebrate taxa not mandatory during Water Framework Directive monitoring, a pragmatism that potentially leads to information loss. Here, we focus on the freshwater fauna of the River Sieg (Germany) to test congruence and additional value in taxa detection and taxonomic resolution of DNA barcoding vs. morphology-based identification in monitoring routines. Prior generated morphological identifications of juvenile fishes and aquatic macroinvertebrates were directly compared to species assignments using the identification engine of the Barcode of Life Data System. In 18% of the invertebrates morphology allowed only assignments to higher systematic entities, but DNA barcoding lead to species-level assignment. Dissimilarities between the two approaches occurred in 7% of the invertebrates and in 1% of the fishes. The 18 fish species were assigned to 20 molecular barcode index numbers, the 104 aquatic invertebrate taxa to 113 molecular entities. Although the cost-benefit analysis of both methods showed that DNA barcoding is still more expensive (5.30–8.60€ per sample) and time consuming (12.5h), the results emphasize the potential to increase taxonomic resolution and gain a more complete profile of biodiversity, especially in invertebrates. The provided reference DNA barcodes help building the foundation for metabarcoding approaches, which provide faster sample processing and more cost-efficient ecological status determination.
Species richness in freshwater ecosystems is increasingly endangered by the consequences of climate change, environmental pollution, overexploitation, river fragmentation or flow regulation, and invasive species [1–3]. Therefore, protection of aquatic habitats and their functions, combined with prevention of further deterioration and initiation of restoration, has become an important task in Europe and elsewhere.
The international Convention on Biological Diversity [4] defined a general framework for counteracting degradation through restoration and management of aquatic ecosystems, followed by national and regional conservation strategies and action plans. The resulting programs–implemented for example in the USA (the National Aquatic Resources Survey (NARS; previously known as EMAP)), in Canada (the Canadian Aquatic Biomonitoring Network (CABIN)), in South Africa (the National Aquatic Ecosystem Health Monitoring Program (NAEHMP)) or in Australia (the AUStralian RIVer Assessment System (AUSRIVAS))–have all in common that they aim to acquire detailed data that describe the ecological health and trends of freshwater bodies, ideally based on continuous monitoring of aquatic indicator taxa [5].
In the European Union the required aquatic quality assessment became legally binding through the Water Framework Directive [6], which aims to restore in all member states a ‘good ecological status’ of each surface waterbody at the latest by 2027. This directive changed the focus of water management from simple pollution control to measuring aquatic ecosystem integrity and health [7], by using five “biological quality elements” (BQEs): fishes, aquatic macroinvertebrates, phytoplankton, macroalgae, and macrophytes, supplemented by chemical and hydromorphological quality indicators (see annex II and V). The distance between the observed conditions to defined undisturbed reference water bodies (i.e. water bodies with unaltered type-specific water quality and morphology, inhabited by taxa expected in the absence of human pressure–Directive 2000/60/EC; see for NRW www.lanuv.nrw.de/fileadmin/lanuvpubl/0_lua/merk29web_kl.pdf, https://www.flussgebiete.nrw.de/fischgewaessertypen-5585) is then calculated as the Ecological Quality Ratio (EQR), and finally translated into the quality categories: high, good, moderate, poor, or bad. A categorization less than good always requires action and management to improve site conditions until a good ecological status is reached.
In the current WFD monitoring protocols, the identification of BQEs is based on morphological identification and counting [8], making the accuracy and level of taxonomic resolution achieved always dependent on the individual knowledge and experience of the respective investigator (often just a single person or a small team per BQE), while professional taxonomists are getting rare even among biologists [9,10]. Besides the overall potential for misidentifications [8,11–13], particularly the morphological classification of early fish life stages and immature aquatic invertebrates with insufficient diagnostic characters is challenging, time consuming, and therefore considered to be costly [14–17]. This results in severe problems in species determination, with cryptic species or lineages remaining undetected [17–19]. Hence, such “problematic” organisms are usually identified only to coarser taxonomic levels, i.e. to genus, family or order, or are even excluded [13,17]. Information based on higher-level taxonomy can be sufficient in standard bioassessments [20,21], but valuable information about species-specific ecological requirements and stressor tolerances may remain unnoticed [19,22]. This may in turn lead to potentially inaccurate water quality assessments and mismanagement of freshwater ecosystems [23,24].
From a scientific point of view, solutions like DNA-based techniques appear promising to overcome these shortcomings [e.g. 24–28]. Recent studies showed that in particular DNA barcoding using a short sequence (~ 658 bp) of the mitochondrial cytochrome oxidase subunit I (COI) [29,30] enables a fast and reliable taxon identification to species-level of whole or even parts of specimens across any life stage which already offers great promise in advancing freshwater bioassessment and monitoring routines [13,24,25].
As part of the German Barcode of Life initiative (www.bolgermany.de) we conducted an applied study using DNA barcoding and classical approaches on the faunal quality elements of the Sieg, a river with a catchment area of approx. 2900 km2. The Sieg enters the Rhine close to Bonn in western Germany and is classified according to the German stream typology [31,32] as a type 9.2 ‘large highland river’. Such rivers are typically characterized by highly diverse habitat structures and aquatic animal communities [32,33], revealing a suitable model system for exploring the potential of DNA barcoding in monitoring routines. Hence, we exemplary use river type-specific fish and macroinvertebrate assemblages of the Sieg to evaluate the performance of both methods: We directly compare identification congruence and taxonomic resolution, and provide an authentic estimation for cost and time effort. We also deliver additional reference DNA barcodes for German freshwater fishes and macroinvertebrates, evaluated through BOLD’s Barcode Index Number (BIN) assignment.
Ethic statement: All applicable international, national, and/or institutional guidelines for the care and use of animals were followed. Permissions were obtained beforehand from the responsible German authorities: Amt für Natur- und Landschaftsschutz, Bauvorhaben, Landschaftsplanung, Artenschutz (exemption from the prohibitions of the Bundesnaturschutzgesetzes in line with § 45 Abs. 7 Nr. 3, § 44 Abs. 1 Nr.1 and § 67 Abs.1 - in combination with the Landschaftspläne 6, 7, 9, 10 und 15 sowie der ordnungsbehördlichen Verordnung über das Naturschutzgebiet und Landschaftsschutzgebiet, Siegaue), Bezirksregierung Köln (sampling permission: § 4 Abs. 3 LFischVO; Az. 51.3–1.7.9-187/12) and Rechts- und Ordungsamt–untere Fischereibehörde (permission for electro-fishing following § 10 Abs. 1 Ziffer 1 SGV.NRW 793).
Sampling campaigns were conducted in the years 2012 to 2014, focussing on aquatic macroinvertebrate species and the different developmental stages of fishes. Sampling was performed at the River Sieg in North Rhine-Westphalia (NRW) by two WFD monitoring and quality assessment experts for the respective BQEs, following standardized field protocols used in German WFD stream monitoring routines (aquatic invertebrates: [34,35]; fishes: [36]).
Macroinvertebrates were collected and then morphologically identified by the limnologist Dr. Guido Haas (www.hbio-hessen.de), who regularly implements the required WFD monitoring and quality assessment for the BQE ‘aquatic macroinvertebrates’ by order of the NRW state government. The specimens were sampled at six main sample locations (grey, Fig 1) using the standardized multihabitat sampling technique described by Meier et al. ([34,35]–a modified version of AQEM/Star method). Following this approach different microhabitats present are sampled proportional to their coverage at each sample site. Each substrate type (Mega-, Makro-, Meso-, Mikrolithal, Akal, Psammal-/pelal, Argyllal, Xylal, Technolithal 1, CPOM, submerse Makrophyten, Algen, lebende Teile terr. Pflz.) with at least 5% cover is sampled by kick-net sampling and manual searching using a hand net with a 0.25x0.25 m frame (mesh-size 0.5 mm; depth of 70 cm), resulting in 20 ‘sampling units’ and a total river bottom sampling area of 1.25m2 per monitoring site; rare microhabitats (cover <5%) were considered by including them in one additional (no. 21) sampling unit. Invertebrate samples were processed by ‘live-sorting’ in the field (see [34,35]) and the required number of representatives from each taxon (excluding colony-forming taxa) taken for detailed identification in the laboratory and subsequent DNA barcoding routines; all remaining individuals were returned alive (see [34,35]). Additional morphologically identified macroinvertebrate samples from two small tributaries to the river Sieg were included to increase taxa diversity for the comparative analysis: one part from the Wahlbach (Table 1), and one from the Krabach, provided by the INRES (Institut für Nutzpflanzenwissenschaften und Ressourcenschutz) institute. Invertebrate taxa numbers were counted in accordance to the field protocol, i.e., Ecdyonurus sp. (5053 taxa ID number—see [37]: national operational German taxa list) and Ecdyonurus insignis (5046 taxa ID number) were counted as 2 taxa. The aquatic invertebrate samples are disposed in the GBOL collection of the Zoologisches Forschungsmuseum Alexander Koenig (ZFMK) in Bonn.

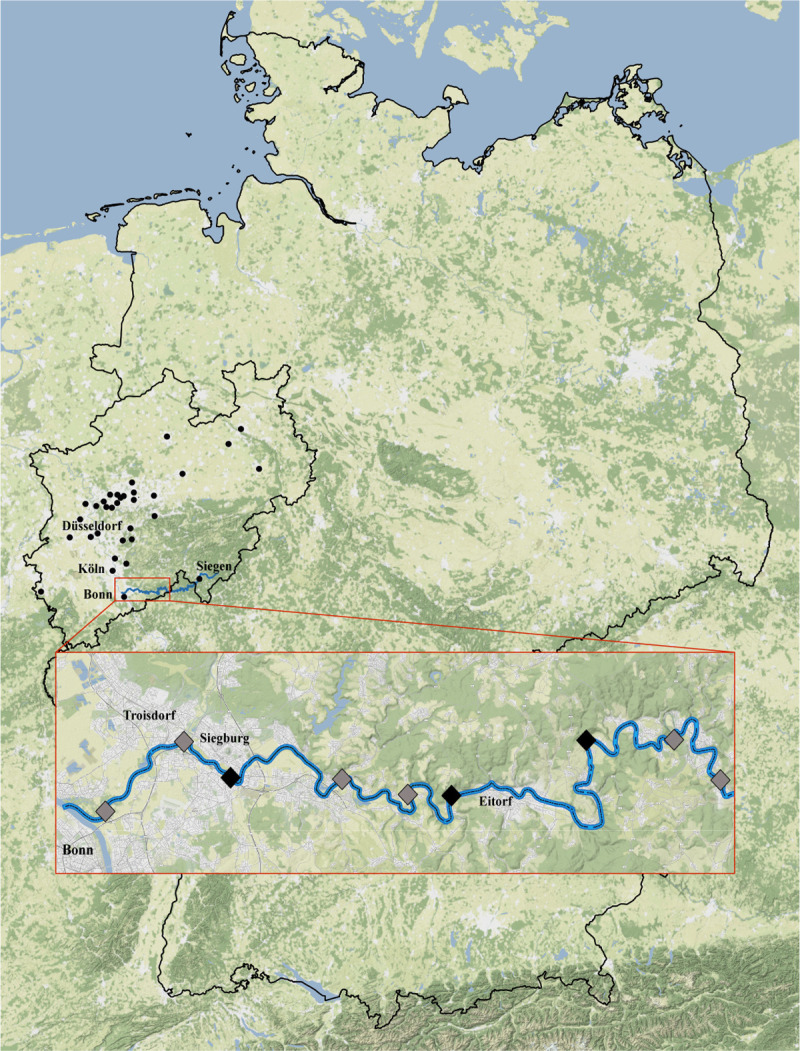
Nine main sample locations of fishes at the River Sieg, Germany.
From left to right: Bergheim, Aggermündung, Pleisbachmündung, Brölmündung, Bülgenauel, Happach, Röcklingen, Schladern, Irsenbachmündung. The six points (Bergheim, Aggermündung, Brölmündung, Bülgenauel, Schladern, Irsenbachmündung) where additionally macroinvertebrates were sampled are marked in grey (Map tiles by Stamen Design).

| FiGT | organisms | ||||
|---|---|---|---|---|---|
| sample point | latitude | longitude | Fish water type | sampled | |
| 1 | Sieg–Bergheim | 50.7657 | 7.1074 | 11 | fishes / invertebrates |
| 2 | Sieg–Aggermündung | 50.8004 | 7.1739 | 11 | fishes / invertebrates |
| 3 | Sieg–Pleisbachmündung | 50.7826 | 7.2133 | 11 | fishes |
| 4 | Sieg–Brölmündung | 50.7818 | 7.3076 | 10 | fishes / invertebrates |
| 5 | Sieg–Bülgenauel | 50.7741 | 7.3631 | 10 | fishes / invertebrates |
| 6 | Sieg–Happach | 50.7736 | 7.4000 | 10 | fishes |
| 7 | Sieg–Röcklingen | 50.8011 | 7.5140 | 9 | fishes |
| 8 | Sieg–Schladern | 50.8011 | 7.5882 | 9 | fishes / invertebrates |
| 9 | Sieg–Irsenbachmündung | 50.7813 | 7.6274 | 9 | fishes / invertebrates |
| 10 | Agger–Troisdorf B8 | 50.8126 | 7.1876 | 10 | fishes |
| 11 | Agger–Wahlscheid | 50.8915 | 7.2468 | 9 | fishes |
| 12 | Sieg–Altarm Wolsdorf | 50.7906 | 7.2301 | - | fishes |
| 13 | Sieg–Krabachmündung | 50.7621 | 7.3993 | 10 | fishes |
| 14 | Derenbach—nah Mündung | 50.7969 | 7.3422 | 1 | fishes |
| 15 | Derenbach | 50.8060 | 7.3679 | 1 | fishes |
| 16 | Derenbach | 50.8094 | 7.3982 | 1 | fishes |
| 17 | Bröl–unten | 50.7848 | 7.3102 | 9 | fishes |
| 18 | Bröl–oben | 50.7881 | 7.3322 | 9 | fishes |
| 19 | Krabach–nah Mündung | 50.7619 | 7.3996 | 2 | fishes / invertebrates |
| 20 | Krabach | 50.7643 | 7.4109 | 2 | fishes / invertebrates |
| 21 | Krabach | 50.7567 | 7.4122 | 2 | fishes / invertebrates |
| 22 | Krabach–WRRL-PS P314 | 50.7336 | 7.4254 | 1 | fishes |
| 23 | Eipbach–oberhalb HRB | 50.7233 | 7.4516 | - | fishes |
| 24 | Eipbach–unterhalb HRB | 50.7300 | 7.4502 | 1 | fishes |
| 25 | Wohmbach | 50.7236 | 7.4536 | - | fishes |
| 26 | Wohmbach | 50.7286 | 7.4800 | - | fishes |
| 27 | Wahlbach | 50.7906 | 7.3292 | - | invertebrates |
| 28 | Wahlbach | 50.7930 | 7.3227 | - | invertebrates |
| 29 | Wahlbach | 50.7957 | 7.3229 | - | invertebrates |
| 30 | Wahlbach | 50.7968 | 7.3227 | - | invertebrates |
| 31 | Wahlbach | 50.7972 | 7.3212 | - | invertebrates |
| 32 | Wahlbach | 50.7980 | 7.3175 | - | invertebrates |
The nine main sample locations are marked by bold type.
Juvenile fishes were sampled and then morphologically identified by the applied fisheries biologist Dipl. Biol. Ivar Steinman (www.fischereibiologe.de), who regularly implements the required WFD monitoring and quality assessment for the BQE ‘fishes’ by order of the NRW state government. Sampling was conducted by using electro-fishing (direct current (500 V; 5 A) to minimize possible stress to the fishes), by boat as single passes or by wading using a point-abundance approach. Each stream section sampled comprises a distance > 100m (sampling area by wading: 40 times the stream width; from boat: 100 times–following [36]), considering all microhabitat types present per reach.
Nine main sampling locations (Fig 1) were investigated, supplemented by 23 additional sites, covering together the variety of aquatic habitats in the River Sieg and its tributaries (Table 1). This strategy covered the different fish water types of the state NRW (https://www.flussgebiete.nrw.de/fischgewaessertypen-5585) in the range of FiGt_01 (upper trout type, low mountain range) to FiGt_11 (lower barbel type, low mountain range), supplemented by small tributaries without type classification (Table 1). Due to low individual numbers and species coverage at the nine main sampling points, additionally seine netting was used as alternative method to estimate species composition and abundances in detail; subsamples were randomly taken to determine the time effort needed for identification of juveniles and larvae. Fishes were humanely sedated and euthanized in chlorobutanol (1,1,1-trichloro-2-methyl-2-propanol) conforming to the Directive 2010/63/EU (all the permissions requested under the German law had been granted).
All specimens–juvenile fishes and aquatic invertebrates–collected in this study were then preserved immediately in 95% instead of 70% ethanol used in WFD standard protocols, and are permanently deposited in the ichthyology collection of the Zoologisches Forschungsmuseum Alexander Koenig (ZFMK) in Bonn. The individuals of both organism groups are associated with the German Barcode of Life project. Detailed specimen data (taxonomy, collection sites, and voucher catalogue numbers) and sequences are available on BOLD (Barcode of Life Data System) under doi.org/10.5883/DS-GBOLFISH and doi.org/10.5883/DS-GBOLMZB or www.bolgermany.de.
For assessing general success in taxa detection and taxonomic resolution of both identification approaches in detail the general steps of the standard monitoring routines for WFD in NRW, Germany were followed. In the first step after sample collection and counting, fish and invertebrate specimens were sorted, separated and then morphologically identified by the respective WFD experts (Dipl. Biol. Ivar Steinman / Dr. Guido Haas)—using if necessary, a microscope—to the required or possible taxonomic level. In fishes this is species-level [36] and in macroinvertebrates at least the level required by the national operational German taxa list, containing additionally information about which determination keys should be used per taxa [37]. For fishes, beside the taxonomic community composition and species abundances, the age structure was determined.
In the second step, DNA barcoding routines with bidirectional Sanger-sequencing of the same fish and macroinvertebrate individuals morphologically processed in detail by WFD experts were performed. To this end, a single leg, a tissue sample or a fin clip were taken from each individual, sorted into 96-well plates, and prepared for DNA sequencing. This followed standard DNA barcoding routines at ZFMK, with DNA extraction, PCR amplification and sequencing (described in detail e.g. by [38] for fishes, and [39] for aquatic invertebrates).
During each step of sample processing to the endpoint where further analyses can be made, associated costs and time were estimated, including final error checking, and second round sequencing (if necessary).
Based on the aquatic macroinvertebrate taxa lists (including all individuals processed by ‘live-sorting’ on site) the water quality classification follows the standards of PERLODES, the German river classification system within the ASTERICS (AQEM/STAR Ecological River Classification System) software version 4.0.4 (www.fliessgewaesserbewertung.de). Beside the standardised WFD quality assessment, in this study the River Sieg was additionally classified by the individual expert knowledge. The German fish-based evaluation system, FiBS (www.flussgebiete.nrw.de) version 8.0.6 was used to assess the ecological status of the sampling sites by comparing the generated fish taxa lists to the stream-specific fish faunistic references.
Obtained DNA barcodes were first compared to the available sequences on the BOLD reference database (BOLD ID engine). Barcodes that showed a match of ≥99% to the closest library sequence were assigned a species-level identification, ≥95% similarity confirms genus-level, ≥90% family-level, ≥85% order-level; the resulting molecular-based taxonomic assignments were subsequently compared to the prior generated morphology-based identifications. Discrepancies (caused by potential misidentifications or errors in the BOLD database) were marked and used to morphologically re-inspect the affected specimens and, if necessary, to revise the taxonomic identification; the COI-based dataset revision was made in consultation with the respective WFD expert (Dr. Guido Haas / Dipl. Biol. Ivar Steinman) to ensure proper species-level assignments. Finally, the cleaned barcode sets were uploaded to BOLD and automatically assigned to new or existing ‘Barcode Index Numbers (BINs)’ through the Refined Single Linkage (RESL) algorithm [40]. The ‘BIN Discordance Report’ (BOLD v3) exposes potential taxonomic conflicts within a BIN; BINs were classified as concordant, if they contain specimens with only one taxon name of the same rank.
Identification congruences and discrepancies were visualized in neighbour-joining (NJ) trees [41], including the individual BIN assignment. Using the MUSCLE alignment [42] and Kimura 2 parameter distance model, the trees were calculated with BOLD. Exemplary for the macroinvertebrates of the six main sample points, an UpSet Plot [43] was used to show differences in the combinations of intersections in species presence or absence at the six sample points when using both identification methods.
At the six main sampling points of the River Sieg a total of 9988 individuals from 101 different taxa (including family & genus, species) were directly identified in situ by a single experienced consultant. Concordant with the official WFD protocol [34], individuals of six taxa (Ceratopogoninae/ Palpomyiinae Gen. sp. (14768 taxa ID number), Chironomidae Gen. sp. (4642 taxa ID number), Tanypodinae Gen. sp. (6972 taxa ID number), Spongillidae Gen. sp. (8846 taxa ID number), Naididae Gen. sp. (6068 taxa ID number), and Tubificidae Gen. sp. (7117 taxa ID number)) were just identified and quantified in field and thus not target of the barcode analysis. Based on the taxa list generated, the expert and the German assessment system PERLODES (software ASTERICS) classified four of the sample points (Bergheim, Brölmündung, Irsenbach, Schladern) as “good“, and one (Aggermündung) as “moderate“. In one case the expert opinion differs from PERLODES, assessing the water quality of Bülgenauel as “moderate“, instead of “good“. After live-sorting in the field, for the comparative analysis of identification congruence and taxonomic resolution 720 macroinvertebrates (out of 95 taxa–see above) were separated, preserved in >95% ethanol and morphologically identified to the required or possible taxonomic level. This identification took the taxonomy expert about 36 hours (3min per individual) with costs of 2.86€ per specimen on average (Table 2).
| variable | DNA-based | morphology-based | ||||
|---|---|---|---|---|---|---|
| identification (aquatic invertebrates/fishes) | Identification | |||||
| DNA extraction* | PCR | Sanger-sequencing **** | data analysis ***** | aquatic invertebrates | fishes | |
| aHotStar Taq**, bstandard Taq*** | cbi-directional, dfw. or rv. only | |||||
| no. specimens simultaneously | 96 | 96 | 96 | 96 | 1 | 1 |
| time | 5 h | 3.5 h | 2 h (waiting 2–10 days) | 2 h | 3 min | 9 sec |
| costs | 96*2.50 € | a ca. 96*1.10 € | cca. 96*5.00 € | 2.86€ | 0.15€ | |
| b ca. 96*0.30 € | dca. 96*2.50 € | |||||
*DNA Extraction—Macherey & Nagel NucleoSpin®
**QIAGEN Multiplex PCR Kit /
***PCR Core Kit
****Sanger-sequencing—Macrogen (South Korea)
*****Data analysis: DNA sequencing—Geneious
Although with DNA barcoding 96 samples were processed simultaneously on one plate it is more costly (5.30–8.60€ vs. 0.15–2.86€ per sample) and time consuming (12.5h without waiting time vs. 0.15-3min).
Subsequently, 638 morphologically identified specimens (for the frequent species Esolus parallelepipedus subsamples were taken), covering each of the 95 macroinvertebrate taxa of the six main sampling points, were analysed together with further 221 morphologically identified specimens (from 73 taxa; with 30 different from the six main sample points) from the tributaries Wahlbach and Krabach by DNA barcoding. Thus 859 specimens from 125 taxa (including 91 species, 32 genera & 2 families) were included in the subsequent method comparison.
From the 859 (six sample points: 638 + tributaries: 221) morphologically identified specimens analysed with DNA barcoding, in total 639 DNA barcode sequences– 466 from the six main sample points and 173 of the two tributaries (out of 108 morphologically identified taxa including 84 spec., 23 gen., & 1 fam.)–were generated successfully. This resulted in a general workload of up to 12.5 hours for a 96-well plate (sending plates for the sequencing step to Macrogen results in further 2–10 days waiting for results), with costs of ca. 8.60€ per specimen (Table 2) when using the HotStar Taq-polymerase (QIAGEN Multiplex PCR kit) and bi-directional sequencing; costs lowered, down to 5.30€, when cheaper Taq-polymerase and forward or reverse only were used. The barcode recovery ranged from 100% in amphipods and isopods, to 90.9% in Plecoptera, to 85.4% in Trichoptera, 83.3% Diptera, 79.5% in Ephemeroptera, and 51.1% in Coleoptera, to only 3.8% in plathelminths.
The direct comparison of the previously generated morphological identification vs. the BOLD ID engine (Table 3) revealed in 74.96% of the 639 sequences a 1:1 match at species-level, whereas 7.04% showed dissimilarities in the identification to species-level; the respective 45 specimens of 22 morphology-based taxa were now genetically assigned to 25 COI-based taxa (Table 4A). Out of the 125 specimens identified to genus-level or higher by morphology only, 92% (115 specimens, 18% of the 639) could be assigned to a reference database entry (>99% ID) and thus to a species (Table 4B). In 10 individuals this was only possible to genus-level, presenting no change compared to the morphological identification (thus included in the 74.96% 1:1 match above).
| method comparison | |||||||||
|---|---|---|---|---|---|---|---|---|---|
| # individuals prior morphologically identified at | morphological identification vs. BOLD ID engine | ||||||||
| # specimens sampled | # specimens barcoded | # sequences generated | species-level | genus-level | family-level | 1:1 match | mismatch | assigned to species | |
| six main sample points River Sieg | 720 | 638 | 466 | 381 | 84 | 1 | 363 | 27 | 76 |
| two tributaries (Wahlbach/Krabach) | 221 | 221 | 173 | 133 | 39 | 1 | 116 | 18 | 39 |
| # total | 859 | 639 | 514 | 123 | 2 | 479 | 45 | 115 | |
From the 859 morphologically identified specimens processed by DNA barcoding, sequences were generated for 639. For these specimens the prior identification level is given as well as the results of method comparison.
| a) | b) | ||||
|---|---|---|---|---|---|
| prior expert identification | COI-based | # specimens | prior expert identification | COI-based | # specimens |
| *Athripsodes cf. bilineatus | Athripsodes albifrons | 4 | Baetis sp. | Baetis fuscatus | 1 |
| *Baetis cf. vardarensis | Baetis lutheri | 1 | Baetis sp. | Baetis vernus | 3 |
| *Centroptilum cf. luteolum | Baetis niger | 1 | Chaetopterygini Gen. sp. | Chaetopteryx villosa | 1 |
| *Caenis cf. luctuosa | Caenis macrura | 1 | Dicranota sp. | Dicranota bimaculata | 2 |
| *Micropterna cf. lateralis/sequax | Chaetopteryx major | 1 | Dicranota sp. | Dicranota gracilipes | 2 |
| *Ecdyonurus cf. insignis | Ecdyonurus dispar | 1 | Dicranota sp. | Dicranota pavida | 1 |
| *Ecdyonurus cf. torrentis | Ecdyonurus dispar | 1 | Ecdyonurus sp. | Ecdyonurus dispar | 3 |
| *Ecdyonurus cf. torrentis | Ecdyonurus insignis | 1 | Ecdyonurus sp. | Ecdyonurus insignis | 5 |
| *Ecdyonurus cf. insignis | ***Ecdyonurus subalpinus | 1 | Ecdyonurus sp. | ***Ecdyonurus subalpinus | 2 |
| *Elmis cf. aenea | Elmis maugeti | 2 | Elmis sp. | Elmis maugeti | 10 |
| *Elodes cf. minuta-Group | Elodes marginata | 1 | Esolus sp. | Esolus parallelepipedus | 4 |
| *Erpobdella cf. octoculata | Erpobdella nigricollis | 3 | *Esolus sp. | Oulimnius tuberculatus | 1 |
| *Gammarus cf. pulex | Gammarus fossarum | 2 | Gammarus sp. | Gammarus fossarum | 4 |
| *Habroleptoides cf. confusa | Habrophlebia lauta | 1 | Hydraena sp. | Hydraena gracilis | 5 |
| *Halesus digitatus/tesselatus | Halesus digitatus | 2 | Hydroptila sp. | Hydroptila simulans | 3 |
| *Hydropsyche pellucidula-Group | Hydropsyche incognita | 3 | Hydroptila sp. | Hydroptila sparsa | 3 |
| *Leuctra cf. geniculata | Leuctra fusca | 7 | Isoperla sp. | Isoperla goertzi | 12 |
| *Limnius cf. volckmari | Limnius opacus | 1 | Leuctra sp. | Leuctra fusca | 6 |
| *Limnius cf. perrisi | Limnius volckmari | 1 | Limnius sp. | Limnius opacus | 10 |
| *Plectrocnemia cf. conspersa | Polycentropus flavomaculatus | 1 | Limnius sp. | Limnius volckmari | 3 |
| **Plectrocnemia cf. conspersa | Potamophylax cingulatus | 1 | Nemoura sp. | Nemoura marginata | 1 |
| *Asellus cf. aquaticus | Proasellus coxalis | 2 | *Niphargus sp. | Gammarus pulex | 1 |
| *Centroptilum cf. luteolum | Procloeon bifidum | 1 | Pedicia sp. | Pedicia littoralis | 2 |
| Sericostoma schneideri | ***Sericostoma baeticum | 1 | *Prosimulium sp. | Simulium lineatum | 1 |
| *Simulium cf. equinum | Simulium lineatum | 4 | *Prosimulium sp. | Simulium reptans | 1 |
| **Protonemura sp. | Isoperla goertzi | 1 | |||
| Protonemura sp. | Protonemura auberti | 3 | |||
| Radix sp. | Radix balthica | 1 | |||
| Rhyacophila sp. | Rhyacophila nubila | 13 | |||
| Sericostoma sp. | Sericostoma baeticum | 6 | |||
| Simulium sp. | Simulium lineatum | 2 | |||
| Simulium sp. | Simulium reptans | 1 | |||
| Tanytarsini | Tanytarsus heusdensis | 1 |
* immature/early larval stage /
**incorrect tube label assignment/
*** barcode-based assignment needs further investigation
Taken together, the 639 DNA barcode sequences were finally assigned in total to 104 different taxa, including 100 species and 4 genera. 21 species were just detected by barcoding, 7 prior morphologically identified species could not be confirmed by the DNA-based identification approach.
The UpSet plots (showing dataset intersections) were used to visualise how the unique/ shared taxa numbers and their distribution patterns across the six main sample points change with the application of the two different identification approaches. With the classical morphology-based identification approach, out of 95 in situ identified taxa (including 1 family, 23 genera and 71 species) only two were just present at Bülgenauel, three at Bergheim, seven at Brölmündung, and ten at Aggermündung and Schladern (Fig 2 and Table 5), whereas four species were found at each sampling point (Fig 2 and Table 5; remaining taxa distribution patterns are presented in S1 Table). In contrast, DNA barcoding identified 80 taxa (including 77 species and 3 genera) with four species found to be present only at Bülgenauel, one at Irsenbach, four at Bergheim, eight at Aggermündung, seven at Brölmündung, and seven at Schladern (Fig 3 and Table 5); just one species (Serratella ignita) was found at each sample point (Fig 3 and Table 5; remaining taxa distribution patterns are presented in S1 Table). Highest diversity was found with 57 morphology-based and 40 COI-based taxa (41 BINs) at Schladern (Fig 3 and Table 5).
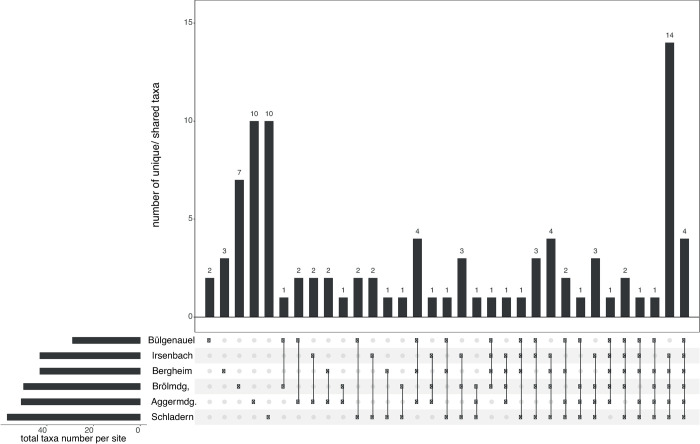
UpSet plot showing the distribution pattern of macroinvertebrate taxa identified by morphology.
UpSet plot showing the distribution of the 95 macroinvertebrate taxa (including 71 species and 24 with coarser taxonomy) determined by morphological identification across the six sample points (main stream)–e.g. 2 taxa were found only at Bülgenauel (left), whereas 4 taxa were present at each sample point (right).
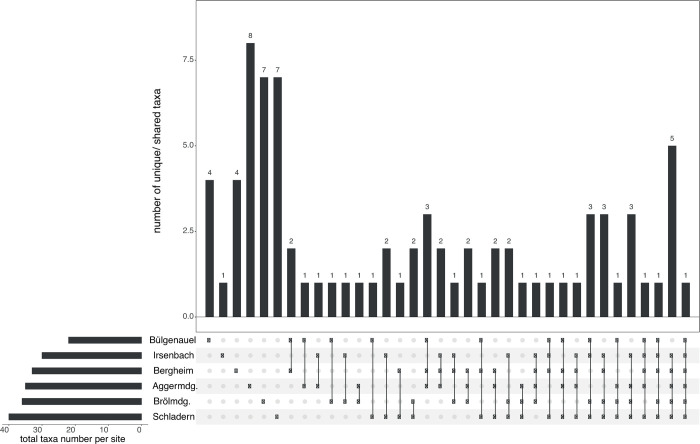
UpSet plot showing the distribution pattern of macroinvertebrate taxa identified by DNA barcoding.
UpSet plot showing the distribution of 80 taxa (including 77 species and 3 genera) across the six different sample points (main stream) of macroinvertebrates based on identification through DNA barcoding–e.g. 4 taxa were found only at Bülgenauel (left), whereas one taxon was present at each sample point (right).
| morphology-based | COI-based | |||
|---|---|---|---|---|
| sample point | taxa present at only one sample point | total taxa number found* | taxa present at only one sample point | total taxa number found |
| Bülgenauel | Anabolia nervosa, Nebrioporus depressus | 29 | Caenis luctuosa, Anabolia nervosa, Proasellus coxalis, Nebrioporus depressus | 22 |
| Irsenbachmündung | no one | 43 | Simulium equinum | 30 |
| Bergheim | Caenis rivulorum, Alainites (Baetis) muticus, Athripsodes sp. | 43 | Caenis rivulorum, Pisidium sp., Alainites (Baetis) muticus, Tanytarsus heusdensis | 33 |
| Aggermündung | Athripsodes albifrons, Baetis sp., Polycelis sp., Anomalopterygella chauviniana, Onychogomphus forcipatus, Oecetis notate, Simulium lineatum, Dina lineata, Calopteryx virgo, Goera pilosa | 51 | Athripsodes albifrons, Onychogomphus forcipatus, Baetis niger, Anomalopterygella chauviniana, Oecetis notate, Dina lineata, Calopteryx virgo, Goera pilosa | 36 |
| Brölmündung | Micrasema longulum, Heptagenia suphurea, Lasiocephala basalis, Halesus digitatus/tesselatus, Agraylea multipunctata, Chaetopteryx villosa, Potamopyrgus antipodarum | 50 | Micrasema longulum, Halesus digitatus, Heptagenia suphurea, Chaetopteryx villosa, Dugesia gonocephala, Potamopyrgus antipodarum, Hydropsyche pellucidula | 36 |
| Schladern | Elmis rioloides, Radix sp., Habrophlebia confusa, Ceraclea albimacula, Glossiphonia complanata, Plectrocnemia conspersa, Helobdella stagnalis, Orectochilus villosus, Antocha sp., Leuctra fusca-Group | 57 | Habrophlebia lauta, Ceraclea albimacula, Glossiphonia complanata, Helobdella stagnalis, Orectochilus villosus, Caenis macrura, Radix balthica | 40 |
| present at each sample point | Serratella ignita, Aphelocheirus aestivalis, Simulium sp., Oulimnius tuberculatus | Serratella ignita |
Note: *morphology- base total taxa numbers are higher because they contain beside misidentifications specimens which were assigned to different taxa or taxonomic levels although belonging to one species; par example, specimens which were listed by the expert in 3 different taxa: Elmis maugetii, Elmis aenea, and Elmis sp., all belong based on COI data to Elmis maugeti (BOLD sequence match of >99%).
Direct comparison of taxa found at only one and species present at each of the six main sample points based on classical morphology-based identification (including family & genus, species) vs. DNA barcoding. Further, the total number of taxa found at each sample point is given.
After taxonomical dataset revision, the 639 sequences were finally clustered by BOLD into 113 BINs, including five new to BOLD (as of date Nov 2, 2018) (Baetis vardarensis BOLD:ADM7406; Pisidium sp. BOLD:ADM7550; Sphaerium corneum BOLD:ADM7571; Serratella ignita BOLD:ADM8860; Dina lineata BOLD:ADO1748). Individuals of seven previously identified taxa split each into two BINs (Asellus aquaticus BOLD:AAA1970, BOLD:ACF1266; Atherix ibis BOLD:ACG1351, BOLD:ACO4109; Baetis rhodani BOLD:AAE4621, BOLD:AAM1760; Eiseniella tetraedra BOLD:AAB7509, BOLD:AAB7510; Gammarus pulex BOLD:ADD3272, BOLD:ADD3276; Limnius opacus BOLD:AAF4988, BOLD:ACZ1035; Niphargus sp. BOLD:ACQ7274, BOLD:ADM7126), whereas specimens of Serratella ignita cluster into three (BOLD:AAB3693, BOLD:AAZ7536, BOLD:ACB0418).
The BIN discordance report (Nov 21, 2018) revealed that 55.75% of the 113 BINs were found to be concordant, one was represented by a single individual, and 29 among all BINs were discordant (see NJ tree: S1 Fig). The NJ tree shows discrepancies/ conflicts in identification accuracy and taxonomic resolution between both identification methods, BIN numbers are included (S1 Fig).
Standard WFD electro-fishing in the years 2012 and 2013 revealed 2569 juvenile fishes (0+) that were subsequently identified by one expert. 20 fish species were detected based on morphological characters (Fig 4).
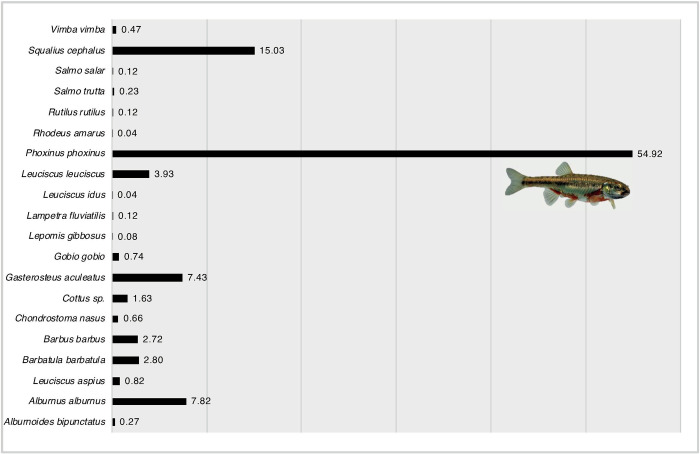
Composition of 20 species (2569 individuals) in juvenile fishes (+0, first year of age) in %.
A total of 715 DNA barcode sequences were successfully generated for the juvenile (0+) fish sample, whereas 134 specimens (including all juvenile S. salar and S. trutta) failed to produce a DNA barcode (84.2% success rate). Sample processing time and costs for barcoding routines remain the same as in aquatic invertebrates (Table 2). The direct comparison of both identification methods using the BOLD ID engine yielded a 1:1 match in 99.03% of the specimens. Only 0.97% (seven 0+ specimens) showed a discrepancy between the morphological identification and the COI data (see NJ tree: S2 Fig). The 715 sequences of 18 species were assigned to 20 BINs, shown in the NJ tree (S2 Fig). Individuals of B. barbatula were split into two (BOLD:AAA1238, n = 37; BOLD:AAA1239, n = 1), P. phoxinus into three (BOLD:AAC8036, n = 82; BOLD:AAY8765, n = 7; BOLD:ACE5740, n = 81) different BINs. According to the BIN discordance report (Nov 21, 2018), 25% were assigned to concordant BINs and 15 BINs were found to be discordant (see NJ tree: S2 Fig).
Probably due to a long winter in 2012/13 the reproductive success of the fish community in the River Sieg was severely restricted in that year. Therefore, the numbers and species coverage (only 40% of the 50 species listed in [33]) in the juvenile fish were significantly below expectations; fish larvae and eggs were missing entirely. The water quality of five sample points (Irsenbachmündung, Happach, Bülgenauel, Röcklingen, Schladern) was assessed by using FiBS as “poor”, whereas three locations (Pleisbachmündung, Aggermündung, Bergheim) were classified as “bad” and only one (Brölmündung) as “moderate”.
It took the expert 7 hr and 47 min to identify 36 randomly chosen seine net fishing subsamples of 3164 individuals in total, resulting in 6.78 individuals per minute with a rough cost of 0.15€ per sample (Table 2).
This application study aimed at evaluating potential advantages in taxa detection and taxonomic resolution when DNA barcoding supplements the identification process of stream monitoring routines. In most standard water bioassessments, many organisms are determined to higher levels such as genera or family only, in order to minimize processing time- and hence maximize cost efficiency [44,45]. As in some aquatic invertebrate taxa even closely related species can vary substantially in their ecological tolerance and respond different to environmental disturbances, the consequence of this traditional approach is a potential information loss, which may moreover result in inaccurate water quality evaluations [13,19,24].
The present results underline, consistent to e.g. Sweeney et al. [13], Stein et al. [24] and Elbrecht et al. [27] that sequence-based bioassessments can capture biodiversity with increased taxonomic resolution and precision, resulting in a more complete community structure description with the opportunity to document and quantify even small changes in freshwater ecosystems. Especially in aquatic invertebrates, the direct method comparison showed that DNA barcoding produces a more detailed taxa list with species which were not detected based on morphological traits while further formerly identified species could not be confirmed.
When comparing the overall taxa numbers of the taxonomic inventories in aquatic invertebrates, further discrepancies in accuracy between both identification approaches get obvious. With the use of coarser-scale taxonomy, the expert listed a higher taxa amount (101 vs. 80 at the six sample points of main stream) because beside misidentifications, morphological challenging specimens actually belonging to one species were assigned to different taxa or taxonomic levels (see note Table 5). Here, the incorporation of DNA barcodes provided more accurate and objective species-level data, clearly changing the detection of taxa occurrence and their abundance patterns per sample point (Figs 2 and 3 and Tables 5 and S1).
Through enhancing taxonomic resolution and including individuals of each size, sex, life stages and/ or even damaged samples in environmental quality analyses, DNA barcoding allowed to gain a more complete reflection of the ecological community present [13,28,46,47]. By putting the barcodes into context with the reference sequences data on BOLD through BIN assignment [40], genetic variation was found, which requires further detailed studies (e.g. in Barbatula, Limnius, Serratella); in the minnows of the River Sieg the three distict haplotypes can be assigned to P. phoxinus (BOLD:ACE5740), P. csikii (BOLD:AAC8036) and P. septimaniae (BOLD:AAY8765, based on Palandačić et al. [48,49]. In general, the assignment to multiple BINs indicates the presence of regional genetic variants or even cryptic, unrecognized species [19,50–52]. Both might theoretically harbor genetic diversity, which leads to variation in adaptation to local environmental conditions and thus (if of autochthonous origin) providing ecological information with importance for freshwater resource protection and conservation planning [18,19,53].
Species-level identifications generated by DNA-based methods highly depend on the coverage and quality of the reference database used [26,54–57]. For example, for the genera Sericostoma (Trichoptera), Niphargus (Amphipoda), Pisidium (Mollusca) and the tribe Tanytarsini (Diptera) the current barcode library contains not sufficient reference data to generate species-level identifications (see NJ tree: S1 Fig). Extension of reference data through single specimen DNA barcoding based on properly determined individuals stored in reference collections is required for filling these gaps. With the present study 5 new BIN entries for aquatic invertebrates could be added to the BOLD library, representing previously missing genetic entities.
Apart from the identification and closing of existing data gaps to create a more complete reference database, additional effort is needed to resolve taxonomic errors in BOLD, in order to enhance the identification success and robustness also for DNA-based biomonitoring [54,57]. We found specimens assigned by BOLD to species (E. subalpinus, S. baeticum) whose occurrence in the River Sieg and tributaries are rather excluded [58,59]. Additonally, 48% of all BINs to which barcodes of this study were assigned contain between 2 and 19 different names. Such taxonomic inconsistencies or errors present in the global library for freshwater organisms at family-, genus- or species-level may result from artefacts like inadequate prior taxonomic assignment, synonymies, or inadequate data management with the lack of taxonomical updates in the database [54,60]. Here, the comprehensive knowledge of well-trained taxonomists is needed to further increase the number of unequivocal species-level assignments using DNA barcodes [60]. The diagnostic utility of COI barcodes can also be restricted by haplotype sharing through natural processes like hybridization, introgression or incomplete lineage sorting in young species [29,30,61]. The combination of mitochondrial and nuclear markers may help to overcome such uncertainties [62–64].
Despite refining taxonomic resolution, our detailed time-cost analysis of both methods additionally showed, similar to Stein et al. [65], that single specimen DNA barcoding based on Sanger-sequencing is at this developmental stage still too expensive and time consuming. Despite the possibility to lower lab costs of conventional Sanger-based barcoding by using par example cheap Taq polymerase and PCR procedures it is not a practicable method for large scale bioassessments, dealing with thousands of individuals [65].
However, the generation of public voucher-based reference barcodes by single specimen barcoding is the foundation for currently emerging future applications like DNA metabarcoding with high-throughput sequencing [25,27,66]. These technical advanced barcoding methods help to save time and money during data acquisition by allowing to process multiple organism groups in parallel from environmental DNA (eDNA) or bulk samples [27,28,67]. Among the remaining challenges for integrating DNA metabarcoding in freshwater monitoring, proper solutions for the still problematic estimation of abundances are to be found, known to be mainly caused by primer bias and a positive correlation of taxon biomass to number of reads [68–70]. The potential of DNA-based bioassessments will be additionally improved by adapted or new established molecular metrices/ indices, not automatically relegating the species or genus-level identification of morphologically inconspicuous taxa [28,67].
Taken together, the present study underlines that DNA barcoding-based aquatic biomonitoring provides highly reliable data at species-level which improves the understanding of species community composition and hence the assessment results used to make environmental management decisions. The challenge is now, to bridge the gap between science and application routines, by enabling a dialogue between stakeholders involved in current WFD quality assessments and monitoring routines and researchers applying the more or less new DNA-based identification methods [26,60]. Here new projects, like DNAqua-Net [26,60] are mandatory, aiming to cross-disciplinary organize a standardization of specific field and laboratory protocols to ensure consistency and comparability in produced DNA assessment data [27,60].
This work was possible only with permissions and support from Thomas Heilbronner and Wilhelm Kreutzmann (Sieg Fischerei-Genossenschaft). We want to thank Ivar Steinman, Hans Joachim Ennenbach and Guido Haas for their fieldwork and morphological identification, Catherine Fehse from the INRES institute for providing additional samples and the Natur- und Angelfreunde Stein–Stadt Blankenberg 1940 e.V. for support and help during this study. Claudia Etzbauer, Jana Thormann, Laura von der Mark, Friedrich Wilhelm Miesen, Serkan Wesel and Simon Walter are acknowledged for help with logistics and wet-laboratory routines.
1
2
3
4
5
6
7
8
9
10
11
12
13
14
15
16
17
18
19
20
21
22
23
24
25
26
27
28
29
30
31
32
33
34
35
36
37
38
39
40
41
42
43
44
45
46
47
48
49
50
51
52
53
54
55
56
57
58
59
60
61
62
63
64
65
66
67
68
69
70
 Adding DNA barcoding to stream monitoring protocols – What’s the additional value and congruence between morphological and molecular identification approaches?
 Facebook
 Twitter
 Linkedin
 Whatsapp

