
Competing Interests: The authors have declared that no competing interests exist.
Microbial communities associated with freshwater aquatic habitats and resident species are both critical to and indicative of ecosystem status and organismal health. External surfaces of turtle shells readily accumulate microbial growth and could carry representation of habitat-wide microbial diversity, since they are in regular contact with multiple elements of freshwater environments. Yet, microbial diversity residing on freshwater turtle shells is poorly understood. We applied 16S and 18S metabarcoding to characterize microbiota associated with external shell surfaces of 20 red-eared slider (Trachemys scripta) turtles collected from varied habitats in central and western Oklahoma, and ranging to southeast Iowa. Shell-associated microbial communities were highly diverse, with samples dominated by Bacteroidia and alpha-/gamma-proteobacteria, and ciliophoran alveolates. Alpha diversity was lower on turtle shells compared to shallow-water-associated environmental samples, likely resulting from basking-drying behavior and seasonal scute shedding, while alpha diversity was higher on carapace than plastron surfaces. Beta diversity of turtle shells was similarly differentiated from environmental samples, although sampling site was consistently a significant factor. Deinococcus-Thermus bacteria and ciliophoran alveolates were recovered with significantly higher abundance on turtle shells versus environmental samples, while bacterial taxa known to include human-pathogenic species were variably more abundant between shell and environmental samples. Microbial communities from a single, shared-site collection of the ecologically similar river cooter (P. concinna) largely overlapped with those of T. scripta. These data add to a foundation for further characterization of turtle shell microbial communities across species and habitats, with implications for freshwater habitat assessment, microbial ecology and wildlife conservation efforts.
A number of cultural traditions hold that the world rests on the back of a giant turtle (i.e., the ‘world turtle’) [1]. This folkloric concept is also intriguing at the microbial scale, as the turtle shell provides a unique and living substrate for microbial colonization, ecology and evolution–potentially a world of microbial diversity. The turtle shell microbiome may simultaneously serve as an indicator of both turtle health and overall ecosystem status. Very generally, the external microbiomes of organisms are influenced by climatic effects, rather than “top-down” or species-specific effects [2]. This suggests that turtles could be susceptible to pathogenic microbial growth on external surfaces, including for novel reptile-associated [3] and known human pathogens [4] present in the environment. Freshwater turtles are also known to utilize a diversity of areas in shallow to medium-depth aquatic habitats, dependent on interactions between and within turtle species, abiotic factors, and disturbance [5–10]. The exceptional capacity of many freshwater turtles to withstand anoxic conditions also allows them to exploit shallow photic to deeper aphotic benthic habitats [11]. Since the turtle shell is in direct contact with a wide range of local environmental microbial communities, it may represent an important microbial accumulator and could thus serve as a proxy for monitoring and predicting habitat quality.
Currently, very little is known about microbial communities residing on turtle shells, although this is an area of recent active research. Epibiont colonization and community structure on turtle shells is most extreme in sea turtles. Microscopy-based analyses indicate sea turtle shells are capable of supporting diverse epibiotic communities including numerous diatom species and epizoic macrofauna (e.g., barnacles, crustaceans) [12–15]. Although the nature of these communities appears to be influenced by both sex and species, the overall character of sea turtle epibiont assemblages remains relatively poorly understood, including to what degree shell microbial communities are impacted by geographic location [14,15]. In comparison to sea turtles, epibiotic communities of freshwater turtles are even less understood, although algal and microbial coverage can be similarly extensive. There is some evidence that turtle shell algal assemblages are variably reflective of local microbial communities. Observations of green algal growth on freshwater turtles date at least to the late 1800s [16], and the selective nature of Basicladia green algal growth on different species of turtles has been reported since the early 1900s [17,18]. Seasonal variation in algal colonization has also been reported, likely due to the timing of the shedding of the keratinous outer layer of shell scutes [19]. More recently, some support for broad geographic influence in Luticola diatom species composition was reported on the shells of common snapping turtles (Chelydra serpentina), suggesting a pattern similar to that found in the green algal epibiont Basicladia [20].
Nearly all previous investigations into turtle shell microbial communities have been microscopy-based. Simultaneously, microscopy techniques place de facto limitations on the accuracy and taxonomic level of microbial community disambiguation. These reports have focused on relatively large (e.g., filamentous green algae [18,19]) or more easily identifiable (e.g. diatoms [15,20]) eukaryotic taxa. Yet, even with seemingly morphologically discrete taxa such as diatoms, morphology-based analyses may result in underassessment of microbial diversity compared to molecular approaches [21,22]. Currently available molecular metabarcoding techniques provide fuller and more nuanced insight into prokaryotic and eukaryotic microbial community structure and ecology. As one example, recent efforts applying high-throughput sequencing (HTS) metabarcoding techniques to marine turtle shells uncovered cryptic diatom diversity, and supported that microscopy-based diversity estimates of turtle shell-associated microbial communities are likely to be low compared to molecular-based estimates [21]. Similarly, a single report thus far utilized HTS metabarcoding to characterize prokaryotic microbial communities of a freshwater turtle species, the Australian Krefft’s river turtle (Emydura macquarii krefftii) [23]. Among other findings, this report documented a prevalence of Cyanobacteria, Deinococcus-Thermus and Chloroflexi taxa on the shell and other external surfaces, as well as differing microbiome composition between shell areas with and without algal coverage. Together, these reports indicate that our understanding of turtle shell microbial communities may greatly benefit from the expanded application of molecular techniques.
In the present report, we characterize the prokaryotic and eukaryotic microbial communities present on the shells of the common and widespread freshwater turtle species Trachemys scripta (Thunberg in Schoepff, 1792) (i.e., the common red-eared slider) based on HTS 16S and 18S rDNA metabarcoding. Our data set includes turtles sampled from varied habitats primarily in central and western Oklahoma in the United States, but ranging to southeast Iowa. Our analyses primarily focus on 1) the taxonomic structure of shell-associated microbial communities, 2) microbial diversity comparisons among and between carapace (upper) and plastron (lower) scute surfaces, and 3) comparison between turtle shell and corresponding local environmental microbial communities, including for several bacterial taxa known to contain human pathogenic species. We also compare shell-associated microbial communities of Trachemys scripta samples to a shared-site, single collection of the ecologically and morphologically similar river cooter (Pseudemys concinna Le Conte 1830) to evaluate the potential for cross-species differences in shell-associated microbial communities. Our analyses add to a small but growing body of data characterizing turtle shells as a unique substrate for microbial colonization and ecology.
Eight sites were selected and sampled from June–September 2019, representing several habitats primarily in central Oklahoma, but ranging to SW Oklahoma and SE Iowa. Sites included large and small ponds, river sloughs and creeks, and a reservoir (Table 1). Two sites were sampled twice, at two different time points. At each site, resident turtles were live-trapped using wire-mesh/PVC basking traps (http://www.turtle-trap.com/) baited with canned sardines, with traps left overnight and for periods of no longer than 24 hours. Microbial community samples of ca. 50–125 mm3 were collected from 8 scutes per captured turtle (Fig 1) using a dental calculus scraper sterilized with 70% ethanol prior to collecting each sample. For the two sampled turtles at the “Altus large pond site” (ALP), four samples were collected from carapace scutes only, since detectable/extractable microbial growth was not present on plastron surfaces (this appeared to be due to recent shedding of plastron scute outer layers). While some collection methods employ a pure-water rinse of sampled surfaces prior to microbial collection [for example 24,25], we excluded this step so that sampled microbial communities reflected immediately present microbes and were not affected by loss of loosely associated resident cells or species. This may have resulted in sampling of some water-column associated microbes. However, we believe the impact of on our results this was likely negligible for two reasons: 1) sampled microbial communities were typically relatively dense, and so would be assumed to exclude most transient microbes, and 2) scrape samples taken from wet but ‘clean’ scutes (visibly lacking microbial growth), which would have included microbes from local water, did not contain measurable levels of DNA upon extraction. All trapped and sampled turtles were notched using unique pairs of lateral scutes, and were released unharmed on site after minimal handling. Microbial scrape samples were also collected from 2–3 shallowly submerged (ca. 5–15 cm) environmental substrates (primarily wood and rock/concrete) at each site. At each site, environmental and turtle scute scrape samples were collected on the same date, with the exception that environmental samples associated with the first turtle collection date of the “North Canadian River slough” site were collected ca. two weeks after turtle collection (10 July 2019 vs. 28 June 2019). Scrape samples were stored in ca. 0.5 ml 95% ethanol and maintained at -20° C for no longer than one month prior to DNA extraction. All turtle capture methods and field practices were approved prior to commencing field work by the University of Central Oklahoma Institutional Animal Care and Use Committee (UCO IACUC application #19005). Scrape samples were collected under a Scientific Collector’s Permit (ID #6233112) issued through the Oklahoma Department of Wildlife Conservation to Dr. Matthew Parks, with the exception of samples at the “Mississippi slough” site, which were collected with permission from Des Moines County Conservation and under the supervision of Mr. Jim Steer. Collections made on private properties were undertaken with verbal permission from property owners.

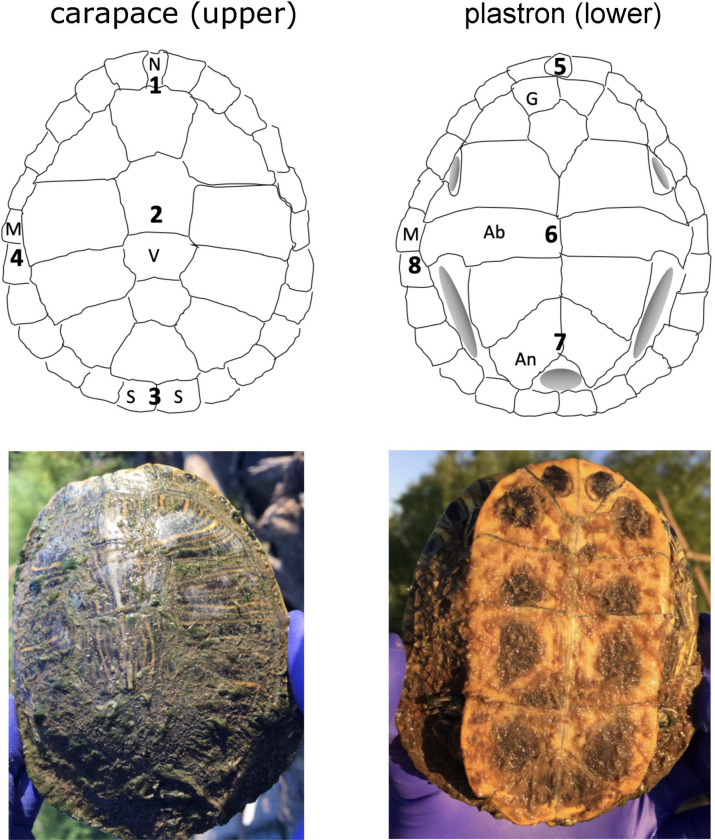
Scute sampling locations 1–8 for carapace (upper) and plastron (lower) shell surfaces, and pictures of representative sample of T. scripta.
Scute abbreviations: Ab = abdominal; An = anal; G = gular; M = marginal; N = nuchal; S = supracaudal.

| Site (abbreviation) | County, State | Latitude, longitude | Description | Sampling date(s) (all 2019) | # Turtles sampled for current study |
|---|---|---|---|---|---|
| N Canadian slough (NCS) | Oklahoma, Oklahoma | 35.574, -97.275 | Slow-moving side channel of N Canadian River | 28-June, 08-September | 2, 2 |
| Chisholm Creek (CC) | Oklahoma, Oklahoma | 35.653, -97.528 | Pool/logjam in small wooded creek | 02-July | 2 |
| Guthrie small pond (GSP) | Logan, Oklahoma | 35.859, -97.319 | Small (ca. 10−3 km2) wooded pond | 03-July | 2 |
| Shell Creek tributary (SCT) | Canadian, Oklahoma | 35.518, -97.786 | Slow-moving tributary of N Canadian River | 12-July | 1 |
| Yukon large pond (YLP) | Canadian, Oklahoma | 35.524, -97.797 | Private large pond (ca. 0.07 km2) in floodplain of N Canadian River | 13,14-July, 15-September | 2, 2 |
| Mississippi slough (MS) | Des Moines, Iowa | 40.724, -91.124 | Sullivan Slough area of Mississippi River backwater | 22-July | 2 |
| Overholser Reservoir (OR) | Oklahoma, Oklahoma | 35.512, -97.667 | Marsh area of large (ca. 6.5 km2) reservoir | 12-August | 2 |
| Altus large pond (ALP) | Jackson, Oklahoma | 34.635, -99.397 | Private large farm pond (ca. 0.1 km2) | 01-September | 2 |
Preserved scrape samples were centrifuged at 16,300×g for 3 minutes, and ethanol decanted prior to extraction. Pelleted material was resuspended in 410 μl lysis buffer PL1 (Takara Bio USA, Mountain View, California) and briefly vortexed to mix. Samples were then exposed to three sequential cellular disruption conditions: 1) freeze-thaw: 10 minutes incubation at -80° C, followed by 10 minutes incubation at 60° C, followed again by 15 minutes incubation at -80° C; 2) mechanical disruption: 60 seconds sonication with a Fisher Scientific FS20D Sonicator; 3) enzymatic digestion: 20 minutes incubation at 60° C with 20 μl proteinase K and 10 μl RNase A. DNA was subsequently extracted using the NucleoSpin Plant II DNA extraction kit and protocol (Takara Bio USA, Mountain View, California). Resulting DNA concentrations and A260/A280 ratios were measured using a Nanodrop spectrophotometer (Thermo Fisher Scientific). A total of 94 DNA extractions (71 scute + 23 environmental samples) were chosen for subsequent amplifications based on DNA quality and quantity, collection site and location of corresponding scute on the shell. All eight targeted scutes were selected from four T. scripta and one P. concinna turtles. Extractions from carapace location 3 and plastron location 8 were utilized from 16 additional T. scripta turtles. Two to three environmental DNA extractions from each site and collection date were also used in amplifications.
A two-step PCR amplification strategy was used to amplify 16S and 18S loci separately and in parallel and prepare samples for sequencing on the Illumina MiSeq platform. Primer design was based on the methods of [26], with the main exception that unique in-line indices were shifted to primers used in step 1 PCR. We found this slight alteration to be 1) more economical (all resulting primers were less than 60 base pairs in length), 2) simpler for downstream bioinformatic parsing (index combinations are always recovered in the same orientation on paired-end sequence reads), and 3) less prone to sample mix-up (since all samples are uniquely labeled in the first, rather than second, PCR amplification). Step 1 PCR primers targeted the V3-V4 16S and V8-V9 18S regions, using the Pro341F/Pro805R [27] and V8f/1510r [28,29] primer sets, respectively. Step 1 primer tails consisted of variable in-line indices of 2–7 base pairs in length and sequence complementary to Illumina sequencing primers. Step 1 amplifications were composed of 1.5 μl millipore-filtered water, 1.0 μl BSA (New England Biolabs), 2× Taq MasterMix (New England Biolabs), 0.5 μl each forward and reverse 10 μM primers, and 4 μl full or diluted DNA extraction (representing ca. 10–100 ng DNA). PCR conditions for step 1 16S amplifications were: 95° C for 2 minutes, 25 cycles of 95° C for 15 seconds/65-55° C for 30 seconds (1° C decrease per cycle for first 10 cycles)/68° C for 30 seconds, followed by a final extension at 68° C for 5 minutes. PCR conditions for step 1 18S amplifications were: 95° C for 2 minutes, 25 cycles of 95° C for 15 seconds/58° C for 30 seconds/68° C for 30 seconds, followed by a final extension at 68° C for 5 minutes. All step 1 PCR amplifications were performed in triplicate in 96-well plate format, with a negative control sample (with millipore-filtered water replacing input DNA extraction) placed in a different internal well in each plate. Full details of the PCR indexing scheme and all primer sequences used are available in S1 Appendix.
For each sample, 5 μl of product from each of the three replicate step 1 amplifications was pooled and used as an input source for step 2 PCR amplifications. Step 2 PCR amplifications utilized primers complementary to step 1 primer tails and containing sequence complementary to Illumina flowcell-bound oligonucleotides, and were performed separately for 16S and 18S amplification products. Step 2 amplifications for each sample contained 7.5 μl 2× PCR MasterMix, 1 μl each of 10 μl 10 μM forward and reverse primers, 4.5 μl millipore-filtered water, and 1 μl product from pooled step 1 PCR amplifications. PCR conditions for step 2 amplifications were: 95° C for 2 minutes, 10 cycles of 95° C for 15 seconds/55° C for 30 seconds/72° C for 30 seconds, followed by a final extension at 72° C for 5 minutes.
PCR products were checked for size and intensity using a 1% agarose gel stained with GelRed (www.biotium.com). All step 2 PCR reactions (94×16S + 94×18S = 188 total) were pooled ca. equimolarly and purified using Agencourt Ampure XP beads (www.beckman.com), at a ratio of 0.8:1 product:beads to remove residual primers and potential primer-dimers. Sequencing was completed at the University of Central Oklahoma on an Illumina MiSeq platform, using standard procedures with a MiSeq Reagent Kit V3 (600 cycle) (www.illumina.com) to produce 300 base pair paired-end reads.
Samples were first parsed from raw sequencing data based on 5´ and 3´ in-line index sequences using custom Unix scripting, and index and primer sequences were removed from forward and reverse reads with Cutadapt ver. 2.10 [30]. Subsequent visualization, denoising, and diversity and taxonomic analyses were completed using QIIME 2 ver. 2019.10 [31] separately and in parallel for both 16S and 18S sequence pools, and largely followed the “moving pictures” tutorial guidelines (https://docs.qiime2.org/2019.10/tutorials/moving-pictures/). Sequences were denoised with DADA2 [32], using forward and reverse reads trimmed to 277 and 186 bases for 16S, and 273 and 218 bases for 18S sequences based on quality score profiles (cutoff determined as the 5´-most position before the 25th percentile first dropped below Q = 30). Resulting denoised reads were de novo clustered at 97% identity cutoff and filtered for a minimum frequency of 100 and presence in at least two samples, to decrease potential artifacts of sequencing error. Taxonomic classification training was performed using the pre-trained Naïve Bayes classifier (classify-sklearn) and the feature-classifier QIIME2 plugin, and using SILVA [33] v132 99% 16S and 18S databases with targeted amplified regions extracted using the “microbiome_helper” guidelines (https://github.com/LangilleLab/microbiome_helper/wiki/Creating-QIIME-2-Taxonomic-Classifiers). Taxonomic accuracy in the resulting databases was validated using the “taxa_sanity_check” pipeline (https://github.com/gavinmdouglas/taxa_sanity_check). All features affiliated to “chloroplast”, “mitochondria”, or residing within the 18S “Metazoa: Tetrapoda” lineage were filtered from the dataset. A phylogenetic tree was generated for 16S and 18S sequences using the align-to-tree-mafft-fasttree function of QIIME2. Sampling depth (i.e., frequency of features per sample) for subsequent diversity core-metrics was determined as the highest sampling depth that allowed inclusion of 100% (i.e., 94/94) of samples. This value was 2,555 for 16S samples and 2,586 for 18S samples. Alpha rarefaction curves were used to validate inclusion of ≥90% of 16S and 18S microbial diversity at minimal sampling depths based on three applied alpha diversity metrics: 1) Shannon diversity, 2) Faith’s Phylogenetic diversity, and 3) Observed OTUs (16S and 18S alpha rarefaction curves and tables for these metrics are available in S2 Appendix).
Alpha and beta diversity analyses were completed for turtle shell and environmental communities to assess variability in microbial communities across three primary comparisons: 1) plastron vs. carapace, 2) plastron or carapace vs. environment, and 3) individual plastron and carapace scute locations. For plastron vs. carapace comparisons, we used all samples from T. scripta scute 3 (carapace) and scute 8 (plastron) samples. For plastron and carapace vs. environmental samples, we used either all scute 3 or all scute 8 samples from sampled T. scripta, and all wood and rock/concrete environmental samples. Scute locations 3 and 8 were chosen for these analyses because they provided the most complete representation of carapace and plastron surfaces based on DNA extraction and PCR success. For individual plastron and carapace scute comparisons, we used scute locations 1–8 on the four T. scripta collections from which all of these scute locations were sampled. Alpha diversity was assessed using three metrics: Shannon diversity, Faith’s phylogenetic diversity and Observed OTUs. Significance for alpha diversity comparisons was assessed using linear mixed effect modeling in the lme4 package for R [34] and the Satterthwaite approximation to account for small sample size [35]. Beta diversity was estimated using four dissimilarity indices: Jaccard, Bray-Curtis, and unweighted and weighted UniFrac. Significance in beta diversity comparisons for Jaccard and Bray-Curtis metrics was assessed through PERMANOVA tests using adonis2 in the R vegan package [36]; p-values were corrected using a Benjamini-Hochberg correction [37]. In mixed effect models, study site was applied as a fixed effect in all comparisons; turtle ID was applied in all comparisons as a random effect (alpha diversity) or strata (beta diversity), as our sampling involved multiple scutes per turtle captured and multiple turtles per site. For both alpha and beta diversity analyses, we first checked for significant differences in microbial communities between soft (wood) and hard (rock/concrete) environmental substrates. We recovered significant differences between these sample types in Faith’s Phylogenetic diversity, Observed OTUs, Jaccard, Bray-Curtis and unweighted UniFrac measures for 18S communities only. For these metrics in 18S alpha and beta diversity analyses we subsequently included environmental substrate type (wood vs. rock/concrete) as a fixed effect in statistical analyses. For all other analyses, wood and concrete samples were classified together as environmental samples. We checked for normality and the presence of outliers by visual inspection of residual plots (alpha diversity metrics) and NMDS plots (beta diversity ordination) for all applied metrics and data subsets. Alpha and beta diversity plots were created using the ggplot2 [38] and phyloseq [39] and R packages.
ANCOM differential abundance analyses [40] were completed for 16S and 18S taxonomic diversity by comparing environmental (wood and rock/concrete) and scute samples (all T. scripta scute 3 and 8 samples) across sampling locations. These analyses were completed for Class, Order, Phylum and Genus, (i.e., taxonomic levels 3–6), since ANCOM analysis may be impacted at low taxonomic levels by high proportions of differentially abundant taxa [40]. Last, we used the same group of samples to evaluate the distribution of ten bacterial genera and families, which include human-pathogenic species, recovered in our 16S sequencing data: Aeromonas (Aeromonadaceae), Clostridium (Clostridiaceae), Enterococcus (Enterococcaceae), Francisella (Francisellaceae), Legionella (Legionellaceae), Leptospira (Leptospiraceae), Neochlamydia (Parachlamydiaceae), Plesiomonas (Enterobacteriaceae), Pseudomonas (Pseudomonadaceae), and Vibrio (Vibrionaceae).
16S and 18S sequence data, with indices and primers removed and parsed by sample, is available through NCBI SRA (BioProject PRJNA639844).
DNA concentrations from selected extractions ranged from 1.9–360.7 ng/μl (average ± standard deviation = 82.6 ± 89.6 ng/μl). We recovered a total of 10,463,228 raw sequence reads, with 48,779 ± 17,671 (range = 11,460–103,674) average raw read pair counts for 16S sequences and 52,078 ± 15,049 (range = 9,121–81,123) for 18S sequences. No correlation was found between 16S and 18S per-sample raw read counts (y = 0.0494x + 49667, R2 = 0.0034); however, across all samples, average read counts for 16S and 18S environmental samples were slightly higher (ca. 10–18%) than for turtle scute samples.
After quality trimming, denoising and clustering, we recovered 1,734 and 315 total 16S and 18S OTUs across all samples; the majority of assignments of OTUs to identified sequence variants (ca. 61.5%) had relatively high confidence (confidence ≥ 0.95). At the class and genus level, turtle and environmental samples contained from 49–616 and 20–154 assigned taxa for 16S and 18S samples, respectively (Fig 2). On average, ca. 18% of these assignments were unique to either turtle or environmental samples.
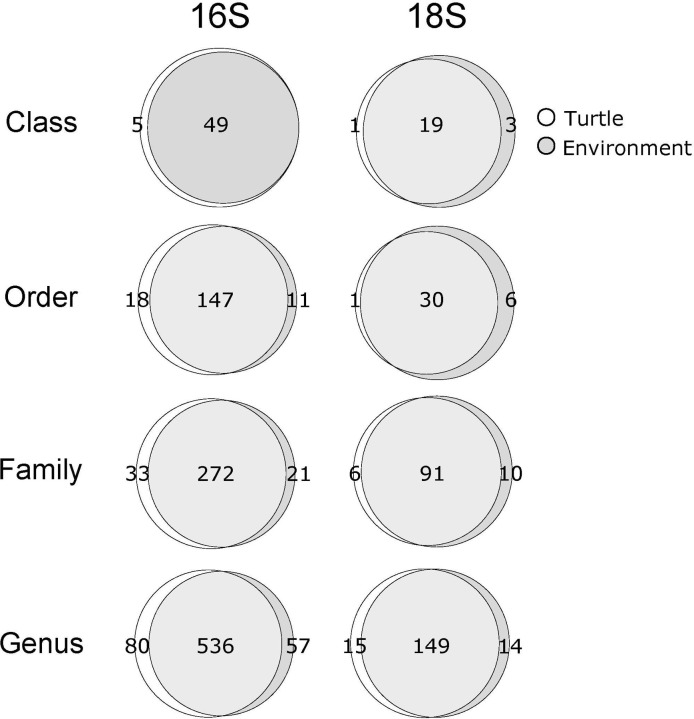
Venn diagrams of recovered taxon counts across all 16S and 18S turtle and environmental samples at the Class, Order, Family and Genus level.
Counts of shared and unique taxonomic assignments recovered in environmental and turtle samples are indicated for 16S (left column) and 18S (right column) communities. Data from T. scripta and P. concinna is included, as inclusion of P. concinna samples had negligible impact on counts of recovered taxonomic assignments.
While recovered microbial communities were taxonomically diverse, both 16S and 18S communities were dominated by several taxa in a majority of samples. For example, 64/71 scute and 22/23 environmental 16S communities were composed of over 50% Alpha- and Gamma-Proteobacteria, and Bacteroidia (Bacteroidetes) (Fig 3). Several other bacterial taxa, including Verrucomicrobiae (Verrucomicrobia), Oxyphotobacteria (Cyanobacteria), and Chloroflexia (Chloroflexi) were also strongly represented in many of the 16S scute and environmental communities, while many scute samples also had substantial representation of Blastocatellia (Acidobacteria). Similarly, a strong majority (66/71) of 18S scute communities were composed of over 50% ciliophoran alveolates (SAR) (Fig 3). Identified alveolates were predominantly Peritrichia ciliates, although carapace scute samples from the single T. scripta turtle collected at the “Shell Creek tributary” site were compositionally dominated (>50%) by Haptoria ciliates and Chromadorea metazoans. 18S environmental samples were generally dominated by metazoan Opisthokonta and ciliophoran alveolates, with substantial contributions from Ochrophyta stramenopiles in many samples. Neoptera, Oligochaete and Podocopa opisthokont taxa, and Peritrichea and Heterotrichea alveolates, were frequently strongly represented in environmental samples. Complete taxonomic frequencies for all 16S and 18S communities at the Class, Order, Family and Genus level are available in S3 Appendix.
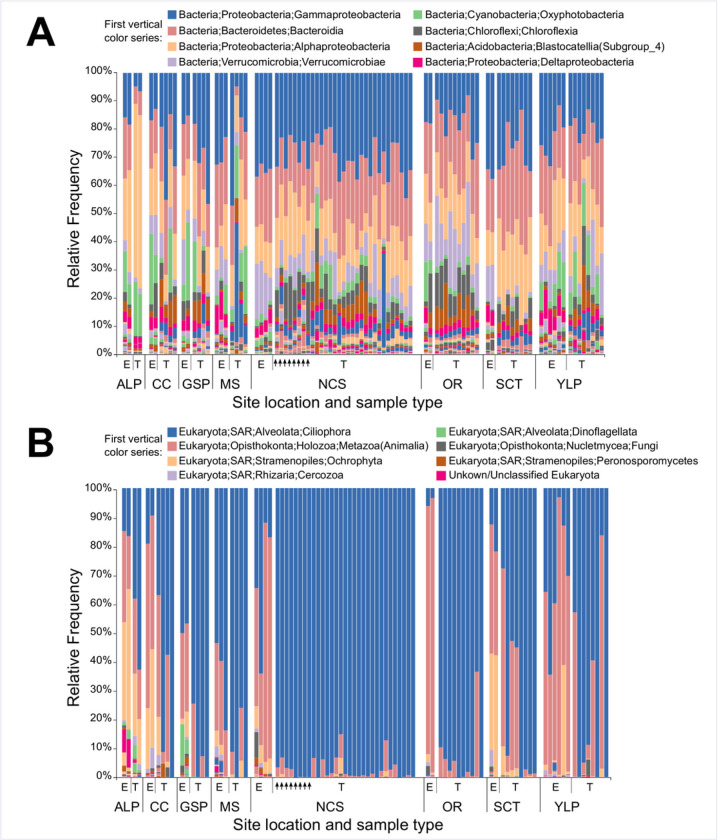
Taxonomic diversity of turtle scute and environmental microbial communities.
(A) Taxonomic affiliation of 16S communities at the Class level; (B) Taxonomic affiliation of 18S communities at the Order level. Samples are grouped by site, and separated within site by environmental (E) and turtle (T) samples. Vertical arrows indicate scute microbial communities sampled from P. concinna at the NCS site.
In alpha diversity comparisons, we recovered significant differences across nearly all applied metrics for T. scripta carapace vs. plastron, carapace vs. environment, and plastron vs. environment communities (Table 2). We did not recover significant differences in comparisons of individual scute locations on either the carapace or plastron of T. scripta shells (Table 2). For both 16S and 18S samples, carapace communities had a higher diversity than plastron communities, while both were lower than environmental samples (Fig 4 and S4 Appendix). Study site was a significant effect for some alpha diversity metrics across all comparisons except plastron vs. environment and carapace scute location (i.e., scutes 1–4), although it was never recovered as a significant effect across all metrics for any comparison (Table 2).
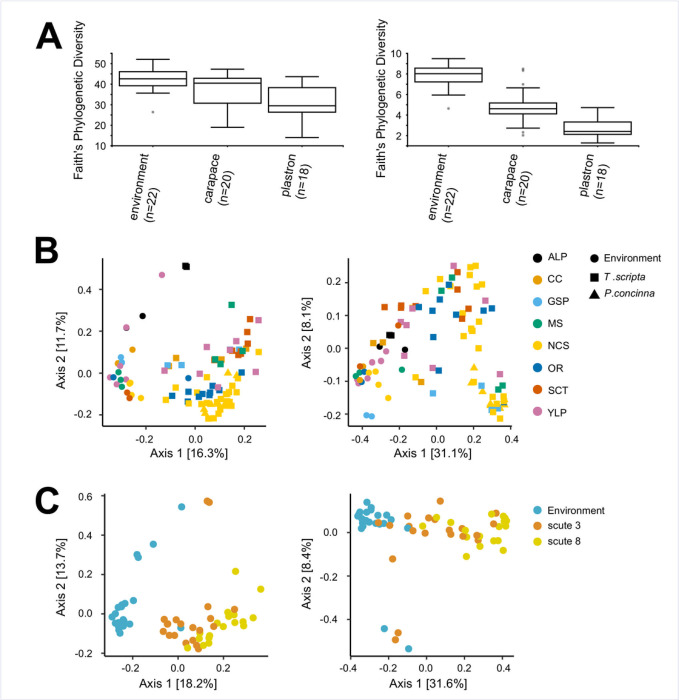
Representative alpha and beta diversity comparisons between environmental, carapace and plastron microbial communities.
A) Alpha diversity (Faith’s Phylogenetic diversity) estimates for 16S (left) and 18S (right) environmental, T. scripta carapace (scute 3) and T. scripta plastron (scute 8) communities. B) Beta diversity (unweighted UniFrac) PCoA plots for all wood and rock/concrete environmental samples, and all T. scripta and P. concinna scute samples. Sample provenance is indicated by color and shape (see legend). C) Beta diversity (unweighted UniFrac) PCoA plots for wood and rock/concrete environmental samples, and T. scripta carapace (scute 3) and plastron (scute 8) samples. Sample provenance is indicated by color (see legend). Corresponding plots for all applied alpha and beta diversity metrics are available in S4 Appendix.
| Comparison | Fixed effects | Alpha diversity | Beta diversity | |||||
|---|---|---|---|---|---|---|---|---|
| Shannon | Faith | Obs. OTUs | Bray-Curtis | Jaccard | Unw-UniFrac | W-UniFrac | ||
| 16S | ||||||||
| carapace vs. plastron | carapace vs. plastron, study site | 8.0E-5 | 2.7E-4 | 1.7E-5 | 1E-3 | 1E-3 | 1E-3 | 1E-3 |
| 9.0E-5 | 1.6E-5 | 1.9E+0 | 1E-3 | 1E-3 | 1E-3 | 1E-3 | ||
| carapace vs. environment | env vs. turtle, study site | 3.7E-4 | 1.2E-2 | 1.3E-3 | 1E-3 | 1E-3 | 1E-3 | 1E-3 |
| 7.4E-2 | 9.0E-2 | 1.3E-1 | 1E-3 | 1E-3 | 1E-3 | 1E-3 | ||
| plastron vs. environment | env vs. turtle, study site | 2.5E-6 | 1.3E-4 | 4.4E-6 | 1E-3 | 1E-3 | 1E-3 | 1E-3 |
| 3E-1 | 3.4E-1 | 4.8E-1 | 1E-3 | 1E-3 | 2E-3 | 7.7E-2 | ||
| scutes 1–4, all vs. all | scute location, study site | 4.9E-1 | 3.1E-1 | 4.3E-1 | 5.3E-1 | 6.2E-1 | 6.8E-1 | 1.6E-1 |
| 8.1E-1 | 3.5E-1 | 6.6E-1 | 1E-3 | 1E-3 | 1E-3 | 1E-3 | ||
| scutes 5–8, all vs. all | scute location, study site | 4.7E-1 | 4.3E-1 | 7.8E-1 | 7.1E-1 | 7.8E-1 | 7.4E-1 | 2.8E-1 |
| 1.5E-1 | 2.0E-3 | 3.0E-2 | 1E-3 | 1E-3 | 1E-3 | 1E-3 | ||
| 18S | ||||||||
| carapace vs. plastron | carapace vs. plastron, study site | 8.3E-2 | 6.3E-6 | 5.5E-6 | 1E-3 | 1E-3 | 1E-3 | 1E-3 |
| 5.7E-5 | 5.5E-2 | 1.0E-1 | 1E-3 | 1E-3 | 1E-3 | 3E-3 | ||
| carapace vs. environment | env vs. turtle, study site, substrate | 2.3E-3 | 1.1E-6 | 2.1E-8 | 1E-3 | 1E-3 | 1E-3 | 1E-3 |
| 1.1E-2 | 6.7E-2 | 2.9E-2 | 1E-3 | 1E-3 | 1E-3 | 1E-3 | ||
| 5.6E-2 | NA | NA | 5.4E-1 | 5.9E-1 | 4.1E-1 | NA | ||
| plastron vs. environment | env vs. turtle, study site, substrate | 3.8E-11 | 2.1E-10 | 3.7E-13 | 1E-3 | 1E-3 | 1E-3 | 1E-3 |
| 1.8E-1 | 9.5E-1 | 6.7E-1 | 1E-3 | 1E-3 | 1E-3 | 1E-3 | ||
| 3.9E-2 | NA | NA | 2.1E-1 | 2.0–1 | 4.0E-1 | NA | ||
| scutes 1–4, all vs. all | scute location, study site | 2.3E-1 | 8.1E-1 | 1.4E-1 | 2.8E-1 | 3.9E-1 | 4.0E-1 | 5.7E-1 |
| 5.1E-1 | 5.4E-1 | 5.3E-1 | 1E-3 | 1E-3 | 1E-3 | 5E-3 | ||
| scutes 5–8, all vs. all | scute location, study site | 5.2E-1 | 8.3E-2 | 1.3E-1 | 7.2E-1 | 6.9E-1 | 5.8E-1 | 5.9E-1 |
| 7.9E-1 | 7.9E-1 | 6.8E-1 | 2.7E-2 | 2.1E-2 | 2E-3 | 2.1E-2 | ||
Beta diversity was noticeably differentiated between environmental and turtle shell communities, including for P. concinna scute samples, which largely clustered with same-site T. scripta samples (Fig 4 and S4 Appendix). Comparisons were reflective of alpha diversity results, supporting differentiation between carapace, plastron and environmental communities. Significant differences in beta diversity were recovered across all metrics for both 16S and 18S comparisons of carapace vs. plastron, carapace vs. environment and plastron vs. environment (Fig 4 and Table 2); no significant differences were recovered across individual plastron or carapace scute locations (Table 2). In beta diversity analyses, “study site” (i.e., location of sample collection) was a significant factor across all metrics and comparisons, with the exception of the weighted UniFrac metric for 16S plastron vs. environment comparison (Table 2).
We recovered 49 taxa with significant differential abundance between turtle (T. scripta scutes 3 and 8 combined) and environmental (wood and rock/concrete combined) samples for 16S and 18S microbial communities, across the different taxonomic levels (Class, Order, Family and Genus, respectively) (Table 3). Eleven 16S genera were more abundant on turtle shells. These results were generally consistent across sampling sites, except for seven genera which were either less abundant on turtle shells or not recovered in sequencing data from the ALP site, and one genus which was less abundant on turtle shells compared to environmental samples at each of the OR and MS sites. The Deinococcus bacterial lineage (belonging to the Deinococcus-Thermus phylum) was the only 16S lineage recovered with differential abundance across all taxonomic levels examined, and was in all cases more abundant in turtle scute samples than in environmental samples. Three differentially abundant bacterial genera (Synechococcus PCC-7902, Rubrivirga, Paracoccus) were recovered exclusively on turtle shells. Four 18S genera (Epistylis, Tokophrya, Opercularia, Heliophrya) were more abundant on turtle shells compared to environmental samples; none of these genera were exclusive to turtle shells. No significant differences were observed in the abundance of any of the ten potentially pathogenic genera/families identified. All of these genera were nonetheless recovered from turtle shell microbial communities, and two genera (Enterococcus, Francisella) were recovered exclusively on turtle shells. Full taxonomic details of 16S and 18S ANCOM analyses are available in S5 Appendix.
| Microbial community | Taxonomic level | |||
|---|---|---|---|---|
| Class | Order | Family | Genus | |
| 16S | 1 (1, 0) | 12 (8, 4) | 8 (7, 1) | 14 (11, 3) |
| 18S | 1 (1, 0) | 3 (1, 2) | 2 (2, 0) | 8 (4, 4) |
Both freshwater turtle species and the aquatic environments they inhabit are increasingly imperiled by anthropogenic drivers. Nearly two-thirds of known turtle and tortoise species are currently classified from vulnerable to fully extinct [41], with harvest and urban development among the top threats. This level of threat is currently greater than that faced by birds, mammals, fish or amphibians [42,43]. Similarly, human activity is impacting freshwater ecosystems worldwide both directly and indirectly through pollution, overharvest, watershed alteration and climate change [44]. Since microbial communities are clearly linked to and indicative of both organismal health [45] and environmental condition [46,47] in freshwater habitats, it is increasingly critical to understand associated ecosystem-wide microbial communities and processes as part of management and conservation plans. Our data contribute to the understanding of shell-associated microbial communities in a common and widespread freshwater turtle species, the red-eared slider (T. scripta), in the context of microbial community taxonomic characterization, uniqueness, and potential as a bio-indicator of overall environmental status. The application of a metabarcoding strategy provides finer-scale resolution of shell-associated microbial constituencies compared to microscopy-based efforts, and our study is the first to describe full 18S microbial communities on external turtle shell surfaces. Inclusion of a single sampled individual of the river cooter (P. concinna) also provides insight into cross-species comparisons between two morphologically and ecologically overlapping turtle species [48,49].
In our sampling, we recovered highly diverse communities from both turtle shell substrates and shallow-water environmental substrates across a total of eight collection sites, representing different habitats and separated by up to ca. 1000 km. Our samples contained over 1,200 high confidence taxonomic affiliations within over 2,000 recovered 16S and 18S taxa in total, representing hundreds of microbial taxa. Conversely, turtle scute samples were also often dominated by one to several taxa, including the Bacteroidia and Alpha- and Gamma-proteobacteria bacterial classes, and Peritrichia ciliates. Although alpha-rarefaction curves supported that our analyses captured ≥90% of microbial OTU diversity at our sequencing levels, deeper sequencing would likely further facilitate understanding of microbial community structure in relation to the relatively numerous, uncommon 16S and 18S taxa recovered in our data.
Alpha diversity was consistently lower for both 16S and 18S communities across our sampled sites in T. scripta scute samples compared to shallow-water environmental samples. It is likely that reduced alpha diversity on turtle shells is influenced by regular drying periods during basking behavior, as red-eared slider (and river cooter) turtles commonly bask either partially or completely out of the water for extended periods of time [50]. Emersion activity has similarly been implicated as an anti-microbial-fouling mechanism in marine crab species [51]. In addition, shedding of the outer keratinous layer of scutes likely occurs on the order of one to several times per year, predominantly in warmer summer months [52], which should have the effect of largely ‘resetting’ microbial communities. We observed both basking behaviors and variable levels of scute shedding at sample sites and in captured turtles during sample collection. Nonetheless, ca. 8–12% of 16S and 18S taxa recovered from turtle shell communities were unique to turtle scutes. It is not clear whether these taxa are fully unique to turtle shells, since our environmental sampling was limited to only shallow-water submerged substrates. Assessment of these taxa in subsequent freshwater aquatic microbial sampling efforts may clarify these results. For microbial taxa recovered in our study as environment-specific, it is similarly unclear whether these taxa are potentially restricted from colonizing turtle shells by chemical or structural properties of turtle shell scutes, the presence or absence of associated microbial taxa, or abiotic conditions. It is possible that at least a portion of these taxa could persist on turtle shells under different conditions, for example lower frequency of basking-drying and/or shedding cycles, or could yet be recovered from turtle shells with wider within- or across-species sampling or deeper sequencing efforts.
For both alpha and beta diversity measures, we recovered significant differences in nearly all applied metrics when comparing carapace and plastron surfaces, but did not recover differences across individual carapace or plastron scute locations with any applied metrics. This suggests that carapace and plastron surfaces provide, at some level, fundamentally differing microbial environments. It is not immediately clear what factors most strongly influence carapace-plastron differences, however alternating exposure of carapace surfaces to sunlight and shade, and wet/dry cycling, expected during normal daily turtle movements, as well as mechanical disruption of plastron microbial communities (through scraping of plastron surfaces on environmental substrates) may interact in some way to favor elevated microbial diversity of carapace surfaces. Study site was more consistently recovered as a significant factor in beta diversity compared to alpha diversity. These results support that while overall levels of microbial diversity are expected to remain relatively consistent across the shells of T. scripta, at least within our sampling region, microbial species composition does appear to be influenced by site or habitat. Our results are reflective of [53], which support that alpha diversity of external microbiota may be determined by physical characteristics of aquatic host species, while beta diversity is more strongly influenced by local environmental factors. In-depth physical characterization of sampled habitats would enable understanding of the role of environmental variables (levels of dissolved organic matter, water temperature, pH, etc.) in microbial species composition of turtle shell surfaces in future studies. Our results further indicate that the dominant Phyla and Classes within microbial communities were generally stable across our sampling sites (Fig 3). In this regard, we also note that the most prominent 16S taxa recovered in our turtle shell samples are in relatively close alignment with those recovered from shells of the Australian Krefft’s river turtle [23] across taxonomic levels Class, Order and Family. We therefore suggest that microbial constituency for the shells of freshwater basking turtles is relatively stable across habitats at higher taxonomic levels, with diversity most likely concentrated at lower taxonomic levels (Genus, Species).
The lineages we recovered as significantly different in abundance in T. scripta shell vs. environmental samples may also in part reflect differing physical conditions. For example, the Deinococcus-Thermus phylum, recovered at all sites as more abundant on turtle shells, is considered an extremophilic group, with member taxa variably resistant to extreme temperatures, radiation, and desiccation [54]. These characteristics may support the ability to withstand high sun exposure and drying conditions associated with basking turtles. It is not immediately clear why these bacteria were not consistently recovered on the shallow-water substrates we sampled, and members of the Deinococcus-Thermus phylum previously have been reported in algae-associated microbial communities [55] among other habitats. Deinococcus-Thermus were also reported as common in external microbiomes of the Australian Krefft’s river turtle [23]. Further exploration specifically of the Deinococcus-Thermus phylum on freshwater turtle shells could yield insight into its diversity, and potentially patterns of co-speciation across the shells of different turtle species. Three bacterial genera recovered only on turtle shells in our data set (Synechococcus, Rubrivirga, Paracoccus) have all previously been recovered from environmental sampling, so it is probable that these taxa would be recovered at our sites with more extensive environmental sampling. Nonetheless, Synechococcus PCC-7902 was originally reported from polar bear [56] hair, which is similarly a keratin-based external surface of a semi-aquatic vertebrate animal. The 18S Epistylis, Tokophrya, Opercularia and Heliophrya genera are known as aquatic epibionts, and in some cases Epistylis in particular may have negative impacts on host health [57,58]. Most likely, these taxa were recovered as most abundant on turtle shells through a combination of factors, including relatively high silt and organic matter conditions common to our sampling sites [59,60], aggressive colonization of aquatic substrates [61], and potentially desiccation resistance [62]. Tokophrya may also form long-term, specific epibiont relationships [63], suggesting that this lineage, similar to the Deinococcus-Thermus phylum, may provide a unique opportunity to study epibiont adaptation and co-evolution in semi-aquatic system. Overall, the differential distribution of 16S and 18S taxa recovered in our data support that the turtle shell provides a unique niche for evolution in at least several microbial lineages, a trait that is likely shared with the external surfaces of other aquatic vertebrate taxa [64]. Dalla Valle et al. [65] demonstrated that the specific keratins composing the external shell surface of turtles also have relatively strong homology to those found in the crocodilian epidermis. Since the native and introduced geographic ranges of T. scripta overlap with several crocodilian species, including both the American alligator (Alligator mississippiensis) and crocodile (Crocodylus acutus), sampling of turtle and crocodilian external microbial communities in shared habitats could provide further insight into the specific role of turtle ecology and shell chemistry in determining resident microbial community assemblage.
Across the present study sites tested we recovered ten genera of bacteria that are known to contain human pathogens, although we did not test these samples specifically for pathogenicity. Two genera/families (Enterococcus (Enterococcaceae), Francisella (Francisellaceae)) were recovered solely from turtle shells, but these results were not significant in our analyses. In each of the remaining genera/families, abundance was variably higher in turtle shell and environmental samples. This suggests that while turtle shells could carry environmentally-present pathogenic bacteria, it is unlikely that they generally act to concentrate these taxa to high abundance in shell-associated microbial communities. It is also unlikely that turtle shell microbial communities could serve as effective early indicators for outbreaks of virulent bacterial strains in aquatic environments. Nonetheless, our data do support that freshwater turtle shells, similar to their marine counterparts [21], can serve as a biofilm ‘reservoir’ for a collection of microbial taxa, potentially including for pathogenic bacteria. As such, turtles may act as regional vectors during habitat selection and nest-/mate-searching movements [66].
Consideration of the shell-associated microbiota from a single P. concinna individual suggest that microbial communities may largely overlap between ecologically and morphologically similar turtle species (Fig 4). P. concinna and T. scripta microbial communities were similarly distant from environmental samples in both 16S and 18S alpha diversity (data not shown), and P. concinna scute samples were within the range of variation of T. scripta samples in beta diversity ordination (Fig 4). While a larger dataset would permit stronger comparisons between T. scripta and P. concinna, this likely would take considerably increased field sampling effort due to the disparity in abundance of these two species in Oklahoma [49] and likely throughout their ranges.
Finally, although our study focused primarily on T. scripta populations within Oklahoma, similar metabarcoding methods could easily be extended to other T. scripta populations and to other freshwater turtle species [23]. Red-eared sliders are both widely distributed in their native range in the eastern half of North America, and across every other continent except Antarctica through widespread introductions. Although considered highly invasive [67], as a widespread introduced species T. scripta also provides unique opportunities to assess microbial community variation and impact on both organismal and ecosystem health and functioning. While our results do not support that the shells of T. scripta act as complete bio-accumulators for aquatic environments, it is clear that they support diverse microbial communities that are not simple reflections of environmental microbial populations, and should prove a worthwhile area of focus for future studies in both microbial and vertebrate ecology.
The authors would like to graciously thank the following individuals and entities for assistance in this project: the UCO CURE-STEM program and Office of Research and Sponsored Programs for funding; the Oklahoma Department of Wildlife Conservation for collecting permissions; the city of Oklahoma City and the Oklahoma City Water Utilities Trust for permission to sample in Overholser Reservoir; Jim Steer and Jerry Parks for facilitating collections in Iowa; Stanley Burris, David Welch and Tyler Richey, and Dr. Nikki Seagraves for granting permissions to collect on private properties; Dr. Paul Stone for field protocol advice and expert species identifications; Samuel Le and Joseph Jeong for contributions in the laboratory; Caroline Testi for field sampling assistance; Dr. Aaron Liston and Dr. Kevin Weitemier for constructive feedback during manuscript preparation.
1
2
3
4
5
6
7
8
9
10
11
12
13
14
15
16
17
18
19
20
21
22
23
24
25
26
27
28
29
30
31
32
33
34
35
36
37
38
39
40
41
42
43
44
45
46
47
48
49
50
51
52
53
54
55
56
57
58
59
60
61
62
63
64
65
66
67
 Consistent patterns in 16S and 18S microbial diversity from the shells of the common and widespread red-eared slider turtle (Trachemys scripta)
 Facebook
 Twitter
 Linkedin
 Whatsapp

