 Correction: Changes in historical typhoid transmission across 16 U.S. cities, 1889–1931: Quantifying the impact of investments in water and sewer infrastructures
PLoS Neglected Tropical Diseases


- Altmetric
The images for Figs 1 and 2 are incorrectly switched. The image that appears as Fig 1 should be Fig 2, and the image that appears as Fig 2 should be Fig 1. The figure captions appear in the correct order. Please see the images in the correct order here.

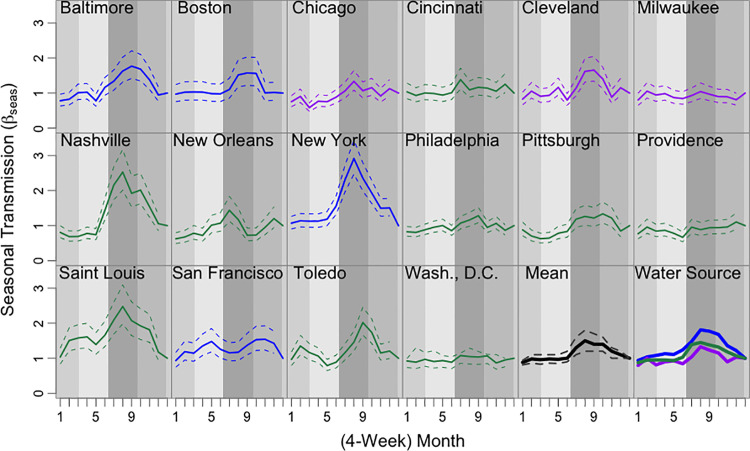
Annual seasonal typhoid transmission estimated from Time-series Susceptible-Infectious-Recovered models.
The estimated seasonal transmission rate in each 4-week period is plotted for each city (color-coded by water source type; solid lines are the mean estimates and dashed lines are the 95% confidence intervals). The second-to-last panel shows the mean seasonal transmission across all cities in bold black. The last panel shows the mean seasonal transmission rate for cities with a particular water source type, with reservoirs in blue, rivers in green, and Great Lakes in purple. Seasons are shown in the background in shades of grey (medium-light grey for winter, light grey for spring, dark grey for summer, and medium-dark grey for fall).
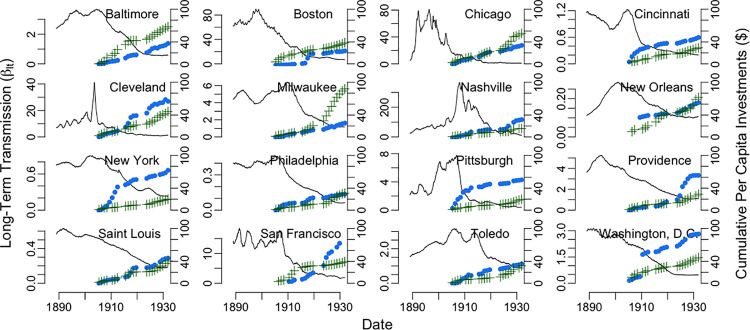
Long-term typhoid transmission rate by city estimated from Time-series Susceptible-Infectious-Recovered models.
The estimated long-term transmission rate (βlt, solid black line) is plotted for each city, by four-week generation interval. Overall per capita investments in the water supply (blue circles) and sewer system (green pluses) in 1931 US dollars are also shown for each city from 1902–1931.
Reference
1