 Evaluation of conventional and four real-time PCR methods for the detection of Leishmania on field-collected samples in Ethiopia
PLoS Neglected Tropical Diseases

 ,
Myrthe Pareyn,
Dagimawie Tadesse,
Mekibib Kassa,
Bart K. M. Jacobs,
Jean-Pierre Van Geertruyden,
Guy Caljon,
Lieselotte Cnops
,
Myrthe Pareyn,
Dagimawie Tadesse,
Mekibib Kassa,
Bart K. M. Jacobs,
Jean-Pierre Van Geertruyden,
Guy Caljon,
Lieselotte Cnops
The authors have declared that no competing interests exist.

- Altmetric
In most low-resource settings, microscopy still is the standard method for diagnosis of cutaneous leishmaniasis, despite its limited sensitivity. In Ethiopia, the more sensitive molecular methods are not yet routinely used. This study compared five PCR methods with microscopy on two sample types collected from patients with a suspected lesion to advise on optimal diagnosis of Leishmania aethiopica. Between May and July 2018, skin scrapings (SS) and blood exudate from the lesion spotted on filter paper (dry blood spot, DBS) were collected for PCR from 111 patients of four zones in Southern Ethiopia. DNA and RNA were simultaneously extracted from both sample types. DNA was evaluated by a conventional PCR targeting ITS-1 and three probe-based real-time PCRs: one targeting the SSU 18S rRNA and two targeting the kDNA minicircle sequence (the ‘Mary kDNA PCR’ and a newly designed ‘LC kDNA PCR’ for improved L. aethiopica detection). RNAs were tested with a SYBR Green-based RT-PCR targeting spliced leader (SL) RNA. Giemsa-stained SS smears were examined by microscopy. Of the 111 SS, 100 were positive with at least two methods. Sensitivity of microscopy, ITS PCR, SSU PCR, Mary kDNA PCR, LC kDNA PCR and SL RNA PCR were respectively 52%, 22%, 64%, 99%, 100% and 94%. Microscopy-based parasite load correlated well with real-time PCR Ct-values. Despite suboptimal sample storage for RNA detection, the SL RNA PCR resulted in congruent results with low Ct-values. DBS collected from the same lesion showed lower PCR positivity rates compared to SS. The kDNA PCRs showed excellent performance for diagnosis of L. aethiopica on SS. Lower-cost SL RNA detection can be a complementary high-throughput tool. DBS can be used for PCR in case microscopy is negative, the SS sample can be sent to the referral health facility where kDNA PCR method is available.
Cutaneous leishmaniasis is a neglected tropical disease and causing a public health problem in Ethiopia. Microscopy is still the standard method for detection of the parasite in Ethiopia, and also in many other low resource settings. A more sensitive method is needed for timely diagnosis and treatment. In this study, we compared five molecular methods on samples collected from patients with a skin lesion suspected of cutaneous leishmaniasis to advice on optimal diagnosis of L. aethiopica. We collected two sample types from the same lesion (skin scrapings and lesion fluid on filter paper) and isolated both DNA and RNA of them. Majority (90.1%) of the samples from skin scrapings were positive in two or more methods and the molecular methods had a higher sensitivity than the conventional methods. Interestingly, we evaluated for the first time a new molecular method designed to improve L. aethiopica detection. Also, we showed that RNA detection performed well for samples that were collected under difficult field conditions. Samples collected on filter paper showed less positive results than skin scraped samples, but could still be the method of choice for easy sampling and transport in resource-limited settings as it performed better than microscopy.
Introduction
Cutaneous leishmaniasis (CL) is a vector-borne disease caused by parasites of the genus Leishmania, which are transmitted by the bite of infected female phlebotomine sandflies. CL is endemic in more than 80 countries globally with an estimated 0.7–1.2 million CL cases each year, predominantly in 4 countries of the New World and 6 of the Old World (including Ethiopia) together accounting for 70 to 75% of global CL incidence [1]. More than 20 different Leishmania species can cause CL with some that geographically coexist. Leishmania (L.) major and L. tropica are most common in the Old World. In Ethiopia, there is a unique dominant species, L. aethiopica, which is mainly found in the highlands putting nearly 29 million populations at risk and has an annual burden of an estimated 20,000 to 50,000 cases per year [1–4].
CL is characterized by slowly growing nodular or ulcerative lesions, typically healing with scars. While not life-threatening, lesions can be disfiguring and stigmatizing, particularly those occurring in the face [5]. Localized CL is the most common clinical form, predominantly affecting the face, but also mucocutaneous CL and to a lesser extent diffuse CL are regularly reported in Ethiopia. In contrast to New World CL, L. aethiopica typically causes crusty lesions with a patchy distribution and local edema that slowly develop and heal eventually (requiring approximately one to three years). However, sometimes the infection may progress to more severe, chronic and complicated forms [6–8].
Like in many other resource-constrained countries, microscopic examination of Giemsa stained skin scrapings (SS) is still the cornerstone for CL diagnosis in Ethiopia. However, it is increasingly recognized that its sensitivity is suboptimal, ranging from around 17–83% [6, 9, 10], and is heavily dependent on technical expertise, staining quality, lesion type, and reference test used to determine the sensitivity. Molecular methods, such as polymerase chain reaction (PCR), combine high sensitivity with high specificity. Even in resource-constrained settings, user-friendly PCR platforms are nowadays well-established for routine diagnosis and surveillance of tuberculosis [11] and HIV [12]. Although such molecular tools have the potential to be used for other neglected diseases like leishmaniasis as well [13, 14], there is still a long way to go before implementation in routine care. Ideally, PCR testing should facilitate both diagnosis and surveillance. For the latter, easier tools for sample collection and/or storage would be useful. For example, filter paper is increasingly used for sample collection in remote settings with subsequent centralized analysis at a later stage [15–18].
PCRs designed in either conventional or real time formats can target different regions of the Leishmania genome for parasite detection at the genus, complex or species level [19, 20]. Typically, these PCRs target nuclear and ribosomal DNA, like the small subunit (SSU) 18S ribosomal RNA or internal transcribed spacer (ITS) ribosomal regions [21, 22] or the mini-exon spliced leader (SL) gene repeat [23, 24]. Another commonly used target is the extra-chromosomal minicircle kinetoplast DNA (kDNA), which is present in several thousands of copies, resulting in a considerably higher sensitivity [25, 26]. Alternatively, the parasite RNA can be detected which is considered as a marker for viable parasites, such as with the recently developed RT-PCR targeting the SL RNA sequence. This molecular target is conserved in Leishmania and performed well on L. infantum infected hamsters, spiked human blood and clinical samples from visceral leishmaniasis patients [27], but is not yet evaluated on CL patients.
With several targets and diagnostic methods available, it can be difficult to select the PCR method that is optimal for a particular setting. In the context of CL in Ethiopia, the PCR method must be applicable on different clinical sample types, capable of detecting L. aethiopica and more sensitive than microscopy. The aim of this study was to compare microscopy with five different molecular methods on two different sample types collected from skin lesions of suspected CL patients in the south of Ethiopia and to discuss their potential as diagnostic and surveillance tool in endemic settings.
Methods
Ethics statement
This survey was ethically approved by the Institutional Ethical Review Committee of the College of Medicine and Health Sciences of Arba Minch University, Ethiopia (Letter Ref No: CMHS/1167/111 dated 18th April 2018). Samples were collected from all volunteers who gave their oral consent to participate in the study.
Sample collection
An active case finding survey was conducted between May and July 2018, in which participants suspected of CL were conveniently selected from the 38 rural kebeles in four zones (Gamo Goffa, 27; Wolayta, 5; Dawuro, 3 and Segen area, 3) of the Southern Nations Nationalities and Peoples’ Regional State of Ethiopia. Samples were collected from 111 suspected CL patients who gave their oral consent to participate in the survey. For collection of the samples, one small incision was made with the point of a surgical blade at the margin of the lesion after it was cleaned with 70% denatured alcohol. Two types of samples were subsequently collected: (i) a skin scraping (SS) collected along the cut edge of the incision of which one part was stored in 97% ethanol at -20°C for PCR analysis and the second part was smeared onto two glass slides for microscopy, and (ii) a blood exudate from the same lesion spotted on filter paper, further referred to as dry blood spot (DBS). The blood exudate for DBS collection was immediately taken from the SS incision with a capillary and dropped onto two Serobuvard calibrated pre-punched filter paper disks (LDA, Zoopole, Ploufragan, France) until saturation (approximately 5 μl/disk).
Microscopy
After dried completely, the skin smears were fixed with 100% methanol, dried again and stained with 5% Giemsa for microscopic examination [28]. The slides were observed under a light microscope with a 1000× magnification. The examination of duplicate smears was carried out blindly by two experienced staff members, and thereafter, results were compared to each other. In case of a discordant result between the two readers, a third expert observed the slides and a consensus result was reached by a two out of three observers’ agreement. Parasite load was graded from +1 to +6 according to WHO parasite grading standard operating procedure [29].
DNA/RNA extraction
Before the extraction procedure, the SS were centrifuged, the ethanol was removed and the remaining tissue was left to dry. DNA and RNA were simultaneously extracted from the SS pellet and DBS using the NucleoSpin RNA kit and an additional NucleoSpin RNA/DNA buffer set (Macherey Nagel, Germany). This protocol enabled sequential elution of DNA and RNA from a single sample. The isolation from DBS was done slightly different than mentioned in the standard manufacturer’s protocol: one pre-cut circle was incubated in β-mercaptoethanol (for RNase inactivation) and lysis buffer for 3 hours at room temperature with frequent vortexing to elute the blood from the filter paper. Eventually, RNA was eluted in 60 μl nuclease-free water while DNA was eluted in 100 μl DNA elute. Both extracts were stored at -20°C until further analysis in the laboratories of Arba Minch University by conventional PCR and Gondar University by real-time PCR.
Conventional ITS-1 PCR
DNA isolates of the SS samples were subjected to a conventional PCR targeting a 350 bp fragment of the ITS-1 gene (“ITS PCR”), based on El Tai et al. [22] as described before [30]. In short, the samples were screened in duplicate with a 15 μl reaction mix consisting of 0.5 μM of each primer (LITSR 5’-CTGGATCATTTTCCGATG-3’ and L5.8S 5’-TGATACCACTTATCGCACTT-3’ (Invitrogen, Life Technologies, Belgium)), 0.2 mM dNTP (GE Healthcare Lifescience, Belgium), 1X QIAGEN PCR Buffer (Qiagen, Belgium), 0.04 U/μl HotStarTaq DNA polymerase (Qiagen) and 1.5 μl of 1/10 diluted DNA extract. The reaction was carried out on a Biometra T professional gradient Thermocycler (Biometra, the Netherlands) and amplicons were visualized on a 1.5% agarose gel. A negative (no template) and positive (L. aethiopica infected Phlebotomus pedifer DNA extract) control were used for each run.
The ITS-1 amplicons were also used to identify the Leishmania species in a selection of positive samples from six areas: five from Gamo Goffa (Zadha, Kemba, Demba Goffa, and Kucha woredas) and one from Wolayta (Kindo-Didaye woreda). Amplicons were sent to Vlaams Instituut voor Biotechnologie (VIB) at the University of Antwerp (Belgium) for Sanger sequencing. The obtained sequences were aligned in GenBank using the BLAST tool and the Leishmania species was identified if query coverage and identity exceeded 98%.
Real-time PCR assays
DNA extracts were also tested with three TaqMan probe-based real-time PCRs: one targeting the SSU 18S rRNA gene (referred to as ‘SSU PCR’) and two targeting the kDNA minicircle sequences (the first here so-called ‘Mary kDNA PCR’ that was originally designed by Mary et al. for L. donovani complex species for VL [26]; and the second further called ‘LC kDNA PCR’ that was newly designed to improve L. aethiopica detection).
The SSU PCR used primers (18S-L-F and 18S-L-R; 0.4 μM) as described by Deborggraeve et al. [31] with an additional 18S probe (0.1 μM) as described before [30] and the Mary kDNA PCR was performed with the primers (0.6 μM of each primer) and hydrolysis probe (0.4 μM) as described [26]. The LC kDNA PCR makes use of primers from Nuzum et al., [13] that were adapted to forward primer LC-F (5’-TATTTTACACCAACCCCCAGT-3’; 1 μM) and reverse primer LC-R (5’-GGTAGGGGCGTTCTGC-3’; 1μM) with a newly designed FAM-labeled LC-probe (5’-CAGAAAYCCCGTTCAAAAAATGGC-3’, 0.4 μM).
Technical validation of the LC kDNA PCR was performed by testing reactivity with all Old World Leishmania species (L. aethiopica, L. tropica, L. major, L. infantum, L. donovani) and New World reference strains (L. braziliensis, L. mexicana, L. amazonensis, L. peruviana, L. panamensis, L. guyanensis, L. lainsoni). The analytical sensitivity was determined based on serial dilutions of four L. aethiopica strains. Cross-reactivity was also assessed for Trypanosoma brucei gambiense, Trypanosoma brucei rhodesiense, Mycobacterium leprae, Mycobacterium lepromatosis and Plasmodium falciparum. In addition, analytical specificity was tested on whole blood samples of 25 endemic controls (from Ethiopia) and 10 healthy non-endemic controls (from Belgium).
The three PCRs were run with HotStarTaq Master mix kit (Qiagen) in a total volume of 25 μL containing 1x master mix, primers and probes (Integrated DNA Technologies (IDT), Leuven, Belgium), 4.5 mM MgCl2 (SSU PCR only), 0.01% BSA (Roche, Vilvoorde, Belgium), and 5 μL DNA. The PCR programme consisted of an initial activation step of 15 min at 95°C, followed by 50 cycles of denaturation for 5 sec at 95°C, annealing for 20 sec at 58°C, and elongation for 30 sec at 72°C on the RotorGeneQ cycler (Qiagen). A fixed and stringent fluorescent threshold (0.2) was used to determine the cycle threshold (Ct) value.
Real-time RT-PCR assay
RNA extracts were diluted 1/10 and subjected to the SYBR green-based reverse transcriptase (RT)-PCR targeting the spliced leader RNA sequence (SL RNA PCR) as described [27]. The SL RNA PCR was also run on the RotorGeneQ cycler. In the absence of a melt curve analysis, a stringent Ct-value cut-off of 32.9 was applied for the positive identification of SL RNA amplicons. This cut-off was established based on a ROC analysis on historical RT-PCR data (82 negatives and 81 VL-positive samples), providing 98% sensitivity and specificity.
In each real-time PCR run, two no-template negative PCR controls (PCR-grade water and elution buffer) were used to monitor for contamination, and a positive PCR control (L. donovani, 100 pg/reaction) was included twice to check the PCR performance. All PCR runs were valid meaning that all positive controls were positive with Ct-values in the expected range and that all negative controls were negative (no Ct-values detected within 50 cycles). Ct-values are an indirect measure for the parasite load, with low Ct-values indicating high parasite loads, and high Ct-values indicating low parasite loads.
In case that a high Ct-value (> 38) was detected in a clinical sample for a single real-time PCR test, the sample was retested to confirm the positive result.
In case the clinical sample was negative for all real-time PCRs, a HBB PCR (targeting the human beta-globin gene) was done to detect human DNA to control for PCR inhibition, insufficient material or inefficient extraction as described before [32].
Statistical analysis
The PCR data were entered into an Excel spreadsheet and analysed with R software (version 3.5.2, "Eggshell Igloo"- R Core Team) [33]. A CL suspected patient was identified as a true positive case if at least two of the six diagnostic tests (microscopy, ITS PCR, SSU PCR, Mary kDNA PCR, LC kDNA PCR and SL RNA PCR) were positive, which was used as the composite reference test, similarly to as described before [16]. Confidence intervals (CIs) for sensitivity and specificity were constructed using the Clopper-Pearson formula. The association between parasitic load and Ct-value was tested with ordinal ANOVA, using the ordPens package and illustrated with smoothers constructed with the mgcv package [34]. A type-I error (α) of 5% and equivalent 95% coverage for CIs was used for all analyses. Correlation between Ct-values of different methods was calculated using Pearson’s correlation coefficient and expressed as its associated R2 (which is the squared correlation, the percentage of variance explained or in common).
Results
Pre-analysis validation
The LC kDNA PCR validation showed reactivity for all Old World Leishmania species, except L. major. No New World Leishmania species were detected and no cross-reactivity was observed for T. b. gambiense, T. b. rhodesiense, Mycobacterium leprae, M. lepromatosis and P. falciparum. The analytical sensitivity of the assay was assessed to be at least 1 fg/reaction. Endemic and healthy non-endemic controls were all negative (e.g. no Ct-value detected up to 50 cycles).
The species was identified as L. aethiopica based on ITS-1 sequences found in the selected samples from 6 different area’s. Therefore, Leishmania will be here further referred to as L. aethiopica.
Comparison of different CL diagnostic tests on SS samples
First, the positivity rate of SS samples was determined for each of the six diagnostic tests individually (microscopy and ITS, SSU, Mary kDNA, LC kDNA and SL RNA PCRs) (Table 1). Microscopy identified 46.8% of the subjects as Leishmania positive, after re-examination by a third reader due to 19.9% inter-observer discordant results. The molecular methods showed higher positivity rates, except the ITS PCR (19.8%). The SSU PCR resulted in 57.7% positive subjects while the Mary and LC kDNA PCRs showed a higher positivity rate of 89.2% and 90.1% respectively. The SL RNA PCR identified 85.6% positive SS RNA extracts.

| Test | Positive n (%) | Negative n (%) | Sensitivity % (95% CI) | Specificity % (95% CI) |
|---|---|---|---|---|
| Microscopy | 52 (46.8) | 59 (53.2) | 52 (42–62) | 100.0 (72–100) |
| ITS PCR | 22 (19.8) | 89 (80.2) | 22 (14–31) | 100.0 (72–100) |
| SSU PCR | 64 (57.7) | 47 (42.3) | 64 (54–73) | 100.0 (72–100) |
| Mary kDNA PCR | 99 (89.2) | 12 (10.8) | 99 (95–100) | 100.0 (72–100) |
| LC kDNA PCR | 100 (90.1) | 11 (9.9) | 100 (96–100) | 100.0 (72–100) |
| SL RNA PCR | 95 (85.6) | 16 (14.4) | 94 (87–98) | 91 (59–100) |
| Composite reference | 100 (90.1) | 11 (9.9) | NA | NA |
Due to the lack of a gold standard reference test, the sensitivity and specificity of each method were calculated with a composite reference (Table 1), with a sample defined as truly positive if positive by at least two of the six index tests. This resulted in sensitivity for microscopy of 52% (95% CI, 42%-62%). The ITS PCR had the lowest sensitivity (22%; 95% CI, 14%-31%). The SSU, Mary and LC kDNA PCRs had a sensitivity of 64% (95% CI, 54–73%), 99% (95% CI, 95%-100%) and 100% (95% CI, 96%-100%) respectively. The SL RNA PCR displayed a sensitivity of 94% (95% CI, 87%-98%). Keeping in mind the limitation of having only a small set of samples that were negative with the composite reference test (n = 11), the specificity of all index tests was 100% except for the SL RNA PCR (91%) because the latter test identified one sample as positive at low Ct-value, which was not confirmed by the other assays.
When comparing overall, 10 out of the 111 SS samples were negative with all diagnostic methods, with one sample that was positive with only one test (the SL RNA PCR). In five of these negative samples, no human DNA was detected by the HBB PCR, indicating that PCR inhibition, insufficient sample start material or inefficient extraction cannot be excluded in these samples. All other 100 samples were confirmed as positive with at least one additional test (Table 2). Of these, four samples were positive by two tests, 20 by three tests, 29 by four tests, 35 by five tests and 12 were positive by all six tests.
| Nr of tests positive | Number of SS samples | Microscopy | ITS | SSU | Mary kDNA | LC kDNA | SL RNA |
|---|---|---|---|---|---|---|---|
| 0 | 10 | ||||||
| 1 | 1 | + | |||||
| 2 | 3 | + | + | ||||
| 2 | 1 | + | + | ||||
| 3 | 18 | + | + | + | |||
| 3 | 2 | + | + | + | |||
| 4 | 17 | + | + | + | + | ||
| 4 | 10 | + | + | + | + | ||
| 4 | 2 | + | + | + | + | ||
| 5 | 27 | + | + | + | + | + | |
| 5 | 8 | + | + | + | + | + | |
| 6 | 12 | + | + | + | + | + | + |
The two kDNA PCRs showed the highest agreement among each other with the same results except for one sample. The samples that were positive with the less sensitive tests (see Table 1), were all confirmed by tests with higher sensitivity, except one sample that was microscopically positive which was confirmed by the LC kDNA PCR only. This cumulative trend of samples being positive in more than one diagnostic test can also be seen.
The range of Ct-values for SS samples positive in all four real-time PCRs (n = 64, blue boxplots) are shown in Fig 1. Among these samples, the SSU PCR showed the highest median Ct-value (34.2), whereas Mary and LC kDNA PCRs had lower median Ct-values of 28.5 and 25.6 respectively. The SL RNA PCR assay had the lowest median Ct-value (17.7). Samples that were negative for the SSU PCR but positive with kDNA PCRs and SL RNA PCR (n = 30; pink boxplot), showed higher median Ct-values in the Mary kDNA (37.8), LC kDNA (34.8) and SL RNA (25.7) PCR assays than their counterparts that were also positive with SSU PCR. The five samples only positive by the two kDNA PCRs (red boxplots), gave median Ct-values of 41.0 for the Mary kDNA PCR and 36.7 for the LC kDNA PCR.

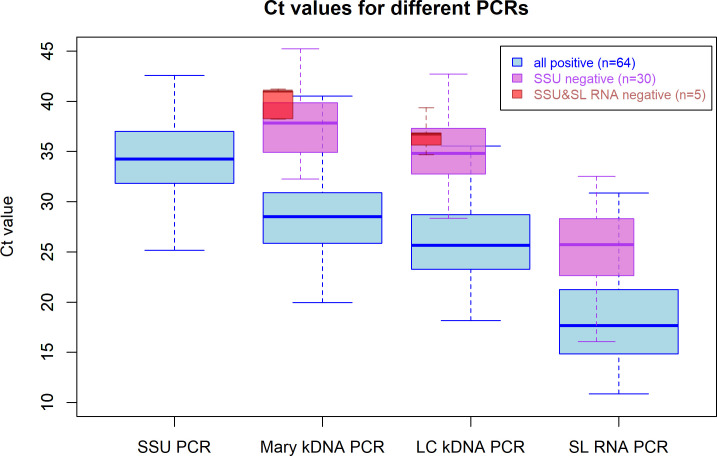
Range and median Ct-values for samples positive with the real-time PCR assays.
Blue box plots represent samples that are positive in all four methods (n = 64); pink box plots present samples that were positive in the two kDNA PCRs and the SL RNA PCR, but negative in the SSU PCR (n = 30) and red box plots represent samples that were only positive with both kDNA PCRs (n = 5). The thick horizontal line in the box represents the median; the bottom and the top line of the box is the 25th and 75th percentile respectively.
Fig 2 shows the R2 correlation between Ct-values detected on SS DNA and RNA extracts with the different real-time PCR methods. The Mary kDNA and LC kDNA had the strongest relationship (R2 = 0.943, n = 99). The SSU PCR Ct-values were slightly less correlated with the ones from the LC kDNA (R2 = 0.872, n = 64) and Mary kDNA (R2 = 0.853, n = 64) assays. The correlation of the SL RNA PCR with the various DNA PCRs was lower: LC kDNA (R2 = 0.721, n = 94), Mary kDNA (R2 = 0.691, n = 94) and SSU PCR (R2 = 0.383, n = 64).
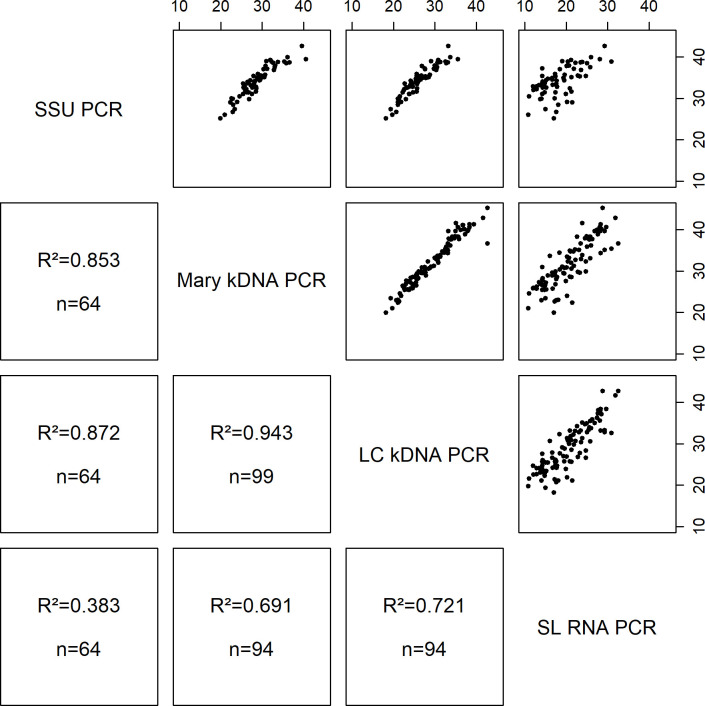
Comparison of Ct-values for the different real-time PCR assays on positive skin scraping DNA and RNA extracts.
R2: squared correlation; n: number of samples positive in both PCR methods that were compared. The Ct-values are displayed on the X- and Y-axis.
Ct-values of the real-time PCR assays were also compared with the parasitic load determined by microscopy (Fig 3). Overall, a clear trend was observed between the parasite load and the median Ct-values. The higher the parasite load, the lower the Ct-values and samples that were microscopy negative had the highest Ct-values in all PCRs. Statistical analysis showed that Ct-values were significantly associated with the parasite load for the SSU PCR (Fig 3A, p-value = 0.0253), and were more significant for the kDNA PCRs (Fig 3B, p-value: 0.0003; 3C p-value: 0.0004) and SL RNA PCR (Fig 3D, p-value: 0.0001).
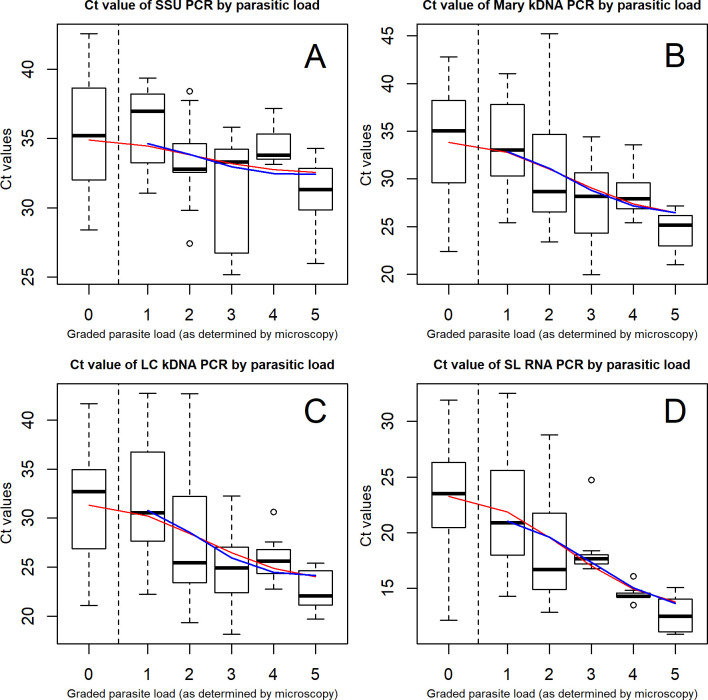
Boxplot for comparison of Ct-values with microscopy parasite load.
The thick horizontal lines in the box represent the median; the bottom and top line of the box are the 25th and 75th percentile respectively. The red fitted line shows the trend of Ct-values of samples which were identified as positive by PCRs, including those negative by microscopy. The blue line shows the trend of Ct-values of the PCR by parasite load as of +1 in microscopy.
Comparison of SS and DBS sample types
To compare the two sampling methods, the PCRs with the highest sensitivity were also evaluated on DBS samples. The comparison of DBS and SS samples tested by the LC kDNA PCR is displayed in Fig 4 and those by the Mary kDNA PCR and SL RNA PCR are shown in S1 Fig. The DBS, collected from the same incision of the lesion, generally showed a lower positivity rate (76/111; 68.4%) compared to the SS. In particular, 28 subjects that were identified as positive by the LC kDNA PCR on SS (with Ct-values ranging between 21.4 and 42.6) were negative based on the DBS sample. Seven individuals were identified as negative by both sampling methods and 72 (65%) subjects were identified as positive in both sample types with Ct-values that were generally higher on DBS (ranging between 18.2 and 39.2 on SS and 27.1 and 42.0 on DBS). On the contrary, four subjects that were negative on SS were additionally identified as CL case based on the DBS sample with the LC kDNA PCR with Ct-values between 27.1 and 43.3. Of these four DBS samples, three were positive with the Mary kDNA PCR and two with the SL RNA PCR as well. Additionally, one more case was only detected on the DBS sample and not on the SS sample by the Mary kDNA PCR and SL RNA PCR (S1 Fig).
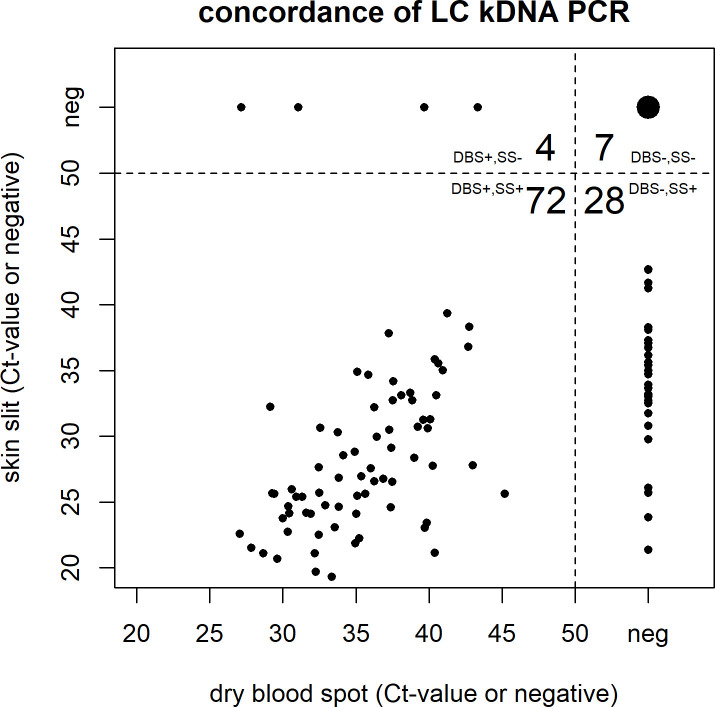
Comparison of Ct-values and concordance of Dry Blood Spots (DBS) versus Skin Scraping (SS) for the LC kDNA PCR.
Discussion
For neglected tropical diseases such as leishmaniasis, laboratory confirmation of clinical suspicion is mostly done by traditional methods (microscopy). The lack of sensitivity of this approach can hamper diagnosis and treatment. We therefore investigated the added value of PCR to accelerate its implementation in routine practice. We compared microscopy with five PCR assays including conventional and real-time formats with different gene targets on DNA or RNA extracts of two sample types from patients suspected of CL from a wide geographical area in the South of Ethiopia. The two sample types (SS and DBS) were collected from the same lesion and the DNA and RNA were simultaneously extracted from the same starting material. This approach avoids inter-lesional differences and reduces deviations due to different extraction methods which make the comparison as fair as possible.
Six samples from different zones were identified up to species level and were all L. aethiopica. However, this does not rule out that there were no L. tropica or L. major cases among the samples. As there are several reports of other Leishmania species isolated from sand flies and rodents in the country [35, 36], more large-scale molecular studies in different parts of Ethiopia are required to determine which species are causing CL and MCL.
Direct identification of amastigotes by microscopy on Giemsa-stained skin scraping smears is still the standard method for the diagnosis of CL in Ethiopia. Especially in endemic regions, it is widely available and the first-choice method [37] being familiar to lab staff and not expensive. In this study, the positivity rate of microscopy was 46.8% (Table 1) and lies within the range of 40% to 75% seen in other Old World CL endemic countries. The high inter-observer disagreement observed in this study demonstrates again that microscopy can be technically challenging [38–42] and requires the presence of a relatively high number of intact parasites [43]. This can be problematic in chronic lesions when patients present late [44] or with complex mucocutaneous CL [38], as parasite loads in these lesions are generally low [45]. Hence, PCR is reported to be superior to other methods for chronic lesions [46].
In contrast to microscopy, it is well-known that molecular tools can provide rapid, sensitive, accurate detection, quantification, and species identification depending on the target and design used [47–49]. In this study, we, therefore, compared the performance of well-known (SSU, kDNA) and less common (SL) PCR targets for CL detection. Since microscopy could not be used as the reference method, we applied a composite reference, similar to as described before [16, 50] to judge on the sensitivity of the different methods. Specificity was presented for completeness, but this result should be interpreted with care due to the low number of negative samples.
Of the five molecular assays in this study, the sensitivity of the conventional ITS PCR was lowest and unexpected, even lower than microscopy (Table 1). Literature showed various sensitivities of ITS for CL diagnosis ranging from 69.2% up to 96.6% [10, 20, 51, 52]. This poor performance might be explained by the use of 1/10 diluted DNA, the lower PCR reaction volume or the possibility of the parasite load in the samples of our study being at the limit of detection of the ITS assay. Moreover, the copy number of the ITS gene (20–200 copies) is much lower compared to the kDNA and SL RNA targets [10, 53] as demonstrated before [20, 52, 54]. However, when the ITS PCR does not provide the desirable sensitivity, a subsequent nested PCR could be performed to increase its performance [55]. Based on our experience, we would advise against the use of conventional or nested PCR formats for routine diagnostics, due to the higher workload and risk of post-PCR contamination. On the other hand, the amplicons of conventional PCRs are generally longer, and the universal ITS PCR therefore allows species identification by RFLP, sequencing or high-resolution melt technology [53, 56].
The SSU PCR targets a 115 bp-long highly conserved region [21] allowing broad use in Leishmania detection at the genus level, but without the ability of species discrimination. Although the SSU gene has similar copy numbers (20–400), the SSU PCR performed better than the ITS PCR as demonstrated here and before [57], probably due to its real-time format and shorter amplicon length. The PCR can amplify up to one single parasite in human blood [30], which relates to clinical disease [58]. However, in our study, the SSU PCR had a lower sensitivity than the kDNA PCRs as has been reported before [19, 20].
In this study, both kDNA PCRs identified the same subjects as CL positive, except one (Table 2). Studies done in Old World CL countries demonstrated high sensitivities for kDNA targeting PCRs ranging between 91.7% up to 100% [10, 20, 50, 59]. The kDNA minicircle sequence is by far the most often used target in studies on visceral [26, 32, 58] or New World leishmaniasis [19, 60]. With over 10,000 copies of minicircles per parasite, this PCR is more sensitive than the SSU [57] and ITS PCRs [10]. The Mary kDNA PCR was designed for species of the L. donovani complex group and some of the CL causing Leishmania species are not well detected [26]. We, therefore, designed a new PCR, the LC kDNA PCR, to improve amplification of L. aethiopica based on primers described first by Nuzum et al., [13] for symptomatic VL and used before by Nicolas and colleagues [25] for Old and New World CL species in mice and for differentiation of Old World CL species by melt curve analysis [61]. With its new probe-based format, the LC kDNA PCR showed the highest sensitivity among all PCRs, with lower Ct-values than the Mary kDNA PCR for L. aethiopica detection in CL suspected cases (Fig 1), illustrating its potential in Old World CL diagnosis. The potential of the kDNA PCR as a quantitative tool for treatment follow-up for (M) CL patients [62] is also of interest in clinical practice.
The skin slit RNA extracts were subjected to the pan-Leishmania SL RNA PCR [27] which performed well for CL diagnosis despite sample storage at -20°C without RNA stabilizing reagents and the use 1/10 diluted RNA. The assay performed better than the SSU and ITS PCRs, probably due to the high copy number and very short amplicon (39 bp). Only six out of 99 SS samples that were positive by both kDNA PCRs were not detected (Table 2). Overall, Ct-values were low compared to the other PCR assays as described earlier (Fig 1) [27]. Although more stringent storage conditions are generally needed for RNA [63, 64], it did not compromise assay performance in this study of field collected samples. RNA detection is also considered as a marker for viable parasites [65] although it has been demonstrated that longer targets are more indicative of viability than shorter amplicons [55]. The intercalator dye-based format of the SL RNA PCR assay is substantially cheaper than probe-based assays and thus beneficial for use in high throughput testing and epidemiological research.
One of the added values of PCR methods, in general, is that they can be applied to different types of clinical specimens [66–71]. The standard sample for CL diagnosis is a punch biopsy or skin scraping but less invasive sample collection methods have been studied [50, 71]. Lesion aspirates showed lower sensitivities compared to biopsies [47, 72] while filter paper lesion impression has a high sensitivity for ulcerative lesions and looks promising in New World CL [16, 50]. Collection of samples with filter paper is relevant for use in field conditions and to simplify transport.
In this study, a total of 102 of the 111 suspected cases were confirmed by PCR, 100 on SS and two additional ones on DBS. CL could not be diagnosed in only eight patients that were negative by all PCRs on both sample types, of which only a part could be explained by PCR inhibition, insufficient starting material or inefficient nucleic acid extraction [72]. We also found that the DBS performed less than SS and had a 28% lower positivity rate with the LC kDNA PCR and that the filter paper storage conditions were not ideal for RNA stability as demonstrated by the 38% lower positivity rate with the SL RNA PCR. Of note, the performance of PCR on DBS was still better than microscopy. It would be interesting to evaluate other sample collection methods like lesion impressions on filter paper or a tape stripping sampling method in future studies, which are also easy to perform in the field [73–75].
Overall, all four real-time PCR formats performed better than microscopy and the conventional ITS PCR, and Ct-values correlated well with the parasite load, making them valid for monitoring parasite quantities during follow-up [73]. The new LC kDNA PCR proved to be an excellent assay for CL diagnosis in Ethiopia. The lower-cost SL RNA detection represents a complementary tool which can be useful for high throughput studies. SS samples performed much better than DBS, but regarding sensitivity, PCR on DBS is still preferred above microscopy.
In Ethiopia, there is currently no comprehensive diagnostic algorithm that includes molecular methods and it would require additional infrastructure and training at centers nearby CL endemic sites. Therefore, on the basis of our results, we propose that at the primary health care level, microscopy can still be the first diagnostic method followed by treatment when positive. In case that microscopy is negative, the SS sample can be sent to the referral health facility where a kDNA PCR method is available. With this study, we therefore advocate for the implementation of PCR in routine care for CL diagnosis, and at least at the referral hospital level.
Acknowledgements
We would like to thank all study subjects volunteered to participate in this study. We are also thankful to the zonal and district health offices for their cooperation and to Arba Minch University, and the University of Gondar for their lab support. We thank Sofie Braet for providing reference strain DNA of the ITM mycobacteriology biobank; and Mrs. Ilse Maes and Dr. Gert Van der Auwera for providing kDNA alignments and testing analytical sensitivity.
References
1
2
3
4
5
6
7
8
9
10
11
12
13
14
15
16
17
18
19
20
21
22
23
24
25
26
27
28
29
30
31
32
33
34
35
36
37
38
39
40
41
42
43
44
45
46
47
48
49
50
51
52
53
54
55
56
57
58
59
60
61
62
63
64
65
66
67
68
69
70
71
72
73
74
75