 Unraveling ChR2-driven stochastic Ca2+ dynamics in astrocytes: A call for new interventional paradigms
PLoS Computational Biology


The authors have declared that no competing interests exist.

- Altmetric
Optogenetic targeting of astrocytes provides a robust experimental model to differentially induce Ca2+ signals in astrocytes in vivo. However, a systematic study quantifying the response of optogenetically modified astrocytes to light is yet to be performed. Here, we propose a novel stochastic model of Ca2+ dynamics in astrocytes that incorporates a light sensitive component—channelrhodopsin 2 (ChR2). Utilizing this model, we investigated the effect of different light stimulation paradigms on cells expressing select variants of ChR2 (wild type, ChETA, and ChRET/TC). Results predict that depending on paradigm specification, astrocytes might undergo drastic changes in their basal Ca2+ level and spiking probability. Furthermore, we performed a global sensitivity analysis to assess the effect of variation in parameters pertinent to the shape of the ChR2 photocurrent on astrocytic Ca2+ dynamics. Results suggest that directing variants towards the first open state of the ChR2 photocycle (o1) enhances spiking activity in astrocytes during optical stimulation. Evaluation of the effect of Ca2+ buffering and coupling coefficient in a network of ChR2-expressing astrocytes demonstrated basal level elevations in the stimulated region and propagation of calcium activity to unstimulated cells. Buffering reduced the diffusion range of Ca2+ within the network, thereby limiting propagation and influencing the activity of astrocytes. Collectively, the framework presented in this study provides valuable information for the selection of light stimulation paradigms that elicit desired astrocytic activity using existing ChR2 constructs, as well as aids in the engineering of future application-oriented optogenetic variants.
Optogenetics is a novel technique involving the targeted delivery of light-sensitive ion channels like Channelrhodopsin-2 (ChR2) to cells. Recently, this technique has been expanded to non-neuronal cell types, e.g., astrocytes. Optogenetic control of astrocytes in vivo can aid in further understanding the intricacies of their debated roles in the brain. Here, using a mathematical model, we evaluate the effect of short and long-term light stimulation of ChR2-expressing astrocytes on their Ca2+ spiking activity and basal level. We further investigate how ChR2 gating dynamics, buffering, and coupling coefficient of Ca2+ influence astrocytic activity in a single cell and a network. Results of our study can serve as a tool for experimental design and engineering of new application-oriented optogenetic constructs targeting astrocytes.
Introduction
The role of astrocytic calcium signaling in various regulatory mechanisms in the brain is far from being fully understood and is a subject of considerable controversy [see refs [1–6]]. These are fueled in part by the limited in vivo reproducibility of in vitro/in situ experimental observations [7–10], as well as a dearth of cell-specific protocols to induce astrocytic Ca2+ signaling in vivo in order to delineate their role from ongoing neuronal activity. Sensory and transcranial direct current stimulation techniques [11–13] have been used to elicit Ca2+ changes in astrocytes. However, these methods lack cell specificity due to the concurrent activation of other cell types, including neurons. Studies have also modulated astrocytic Ca2+ activity in vivo using cell-specific techniques including Ca2+ uncaging [14,15], chemogenetics [16,17] and optogenetics [18,19]. Ca2+ uncaging requires invasive site-specific delivery of calcium vehicles, which are rendered inoperative upon depletion via photolysis. Chemogenetics, e.g., designer receptor exclusively activated by designer drugs (DREADDS), offers a platform for controlled, targeted drug delivery; however, they suffer from low temporal resolution. Contrarily, optogenetics is an avant-garde, minimally invasive, and reproducible approach [20,21], providing a platform to genetically target specific cell types with high temporal and spatial precision, which can be employed as a tool to exclusively modulate astrocytic Ca2+ signaling in vivo.
Despite the recent inception of the field of optogenetics, a wide variety of optogenetic tools have been constructed, among which channelrhodopsin 2 (ChR2) has been one of the most commonly used. Applications of this technique in astrocytes has helped examine the role of these cells in memory enhancement [22], cortical state switching [23], and hyperemic response [18,19]. The biophysical characterization and the response to light stimulation in several ChR2 variants, predominantly in excitable cells, are available in literature [24,25]. More recently, several ChR2 variants have been engineered for enhanced channel conductance (ChETA) [26], increased calcium permeability (CaTCh) [27], and faster recovery kinetics (ChRET/TC) [28]. ChR2 constructs have also been modified to form chimeric variants to regulate responses and facilitate multiwavelength optogenetics in neurons [29]. Contrary to neurons, a holistic approach to quantify the effect of light stimulation on astrocytes has not yet been formulated. Given that light activation of ChR2-enabled astrocytes alters dynamics of intracellular ionic species, mathematical modeling can be of importance in predicting how laser specifications, as well as the biophysical properties of the ChR2 construct, can affect astrocytic calcium signaling. Available theoretical models of Ca2+ dynamics in astrocytes primarily rely on elevating intracellular IP3 levels to initiate a Ca2+ response from the intracellular stores and have not evaluated the effect of direct influx of these ions through transmembrane channels, e.g. ChR2. To achieve predictions with high accuracy, it is also imperative that the model accounts for the stochastic nature of spontaneous calcium oscillations in these cells, which result from the random opening of the inositol trisphosphate receptor (IP3R) channels in clusters. Such a model can guide experimentalists in optimizing light stimulation paradigms for existing optogenetic variants to achieve desired Ca2+ levels in astrocytes, as well as aid in the development of novel application-based constructs targeting these cells.
To this end, we outline a novel stochastic model of astrocytic calcium dynamics with an incorporated optogenetic component—ChR2. Firstly, we quantify and evaluate the effect of different light stimulation paradigms on the Ca2+ dynamics of single cells expressing three existing ChR2 variants, i.e., wild type (WT), ChETA, and ChRET/TC. For the WT variant, we use the two channel characterizations provided in ref. [30], namely WT1 and WT2. Using the model, we analyze the effect of light stimulation in astrocytes congruent with experimental recording durations (in the order of tens of minutes) [31–33], and also gauge the potential effect of long-term optogenetic stimulation (in the order of several hours or beyond) in these cells. Secondly, we quantify the effect of varying stimulation light intensities on a ChR2-incorporated astrocyte with respect to its spiking rate and basal level. Thirdly, to identify key features necessary for the development of prospective ChR2 constructs, we perform a global sensitivity analysis of different parameters of the single cell model to the model output. Lastly, through the incorporation of gap junctions allowing for the diffusion of IP3 and Ca2+, we analyze the effect of local light stimulation on the global Ca2+ response in a network of astrocytes expressing ChR2.
Materials and methods
The biophysical model outlined in Fig 1 consists of our previously developed model of astrocytic calcium dynamics [34,35], based on the Li-Rinzel simplification of the De Young-Keizer model [36,37], and a 4-state model of ChR2 photocurrent kinetics adapted from refs. [30,38]. We incorporated a 4-state model of ChR2 photocycle, as previous studies have demonstrated its superiority in capturing the dynamics of the ChR2 photocurrent compared to 3-state models [30,39]. The ChR2 model assumes two sets of intra-transitional closed/open states, i.e., dark-adapted (c1 and o1) and light-adapted (c2 and o2), in describing the dynamics of a ChR2 photocycle. Light stimulation window (S0(t)) is modeled as a pulsed train with unit amplitude and is characterized by a period (T) and a pulse width (δ) (expressed as a percentage of T), indicating the duration within the pulse period for which the light is on.

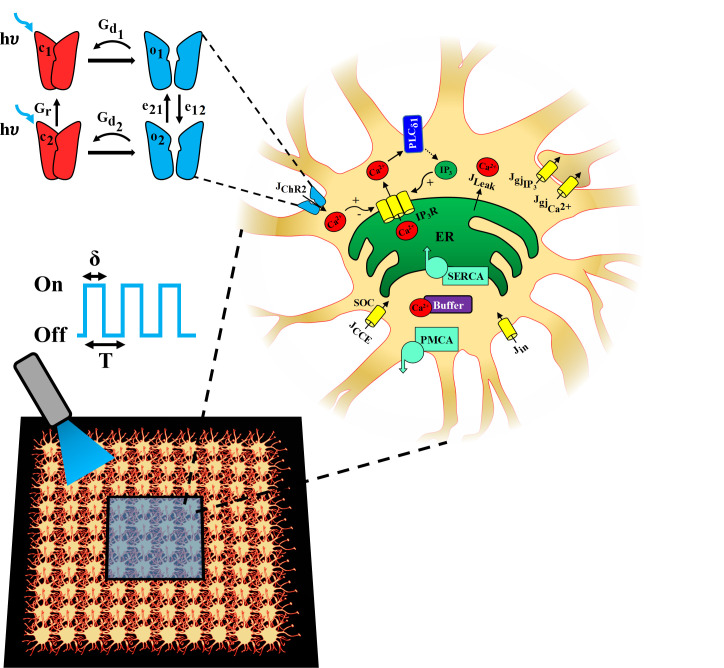
Schematic of the biophysical model.
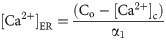
A model for a ChR2-expressing astrocyte is presented, accounting for: 1) Ca2+ release from the endoplasmic reticulum (ER) into the cytosol via the IP3R clusters, 2) Phospholipase-C δ1 (PLCδ1) mediated production of IP3, 3) capacitive calcium entry (CCE) via the store operated calcium channel (SOC), 4) passive leak from the ER to the cytosol (Jleak), 5) replenishment of ER stores via sarco(endo)plasmic reticulum Ca2+-ATPase (SERCA) pump, 6) extrusion of Ca2+ by plasma membrane Ca2+ ATPase (PMCA) pump into the extracellular (EC) space, 7) passive leak (Jin) into the cytosol from the EC space, and 8) Ca2+ buffering by endogenous buffer proteins. In astrocytic network simulations (bottom panel), each cell is connected to its neighboring cells though Ca2+ and IP3 permeable gap junctions, indicated as and , respectively, and a central region (blue shaded box) is stimulated with light. A 4-state model [closed states (c1 and c2) in red and open states (o1 and o2) in blue] is used to represent ChR2 gating dynamics. The blue light (λ = 470 nm) stimulation paradigm used to open ChR2, leading to a Ca2+ influx (JChR2), is characterized by pulse period (T) and pulse width (δ).
The model incorporates Ca2+ influx from the extracellular space through a light-evoked ChR2 flux (JChR2), a capacitive calcium entry (CCE) flux via store-operated Ca2+ channels (SOC) (JCCE), and a leak flux representing other transmembrane Ca2+ channels and exchangers (Jin). It also accounts for the release of Ca2+ from the endoplasmic reticulum (ER) into the cytosol through IP3Rs (), a form of Ca2+-induced Ca2+ release (CICR) process, and a leak flux (JLeak). Replenishment of ER Ca2+ is done via activation of the sarco(endo)plasmic reticulum Ca2+-ATPase (SERCA) pump, while plasma membrane Ca2+ ATPase (PMCA) pump extrudes cytosolic Ca2+ into the extracellular space. The dynamics of IP3 concentration in the soma ([IP3]) is included via Ca2+-dependent activation of the Phospholipase Cδ1 (PLCδ1) pathway. Buffering of Ca2+ is explicitly accounted for by a fast buffering approximation process [40]. Intercellular signaling in a network of astrocytes is modeled by incorporation of Ca2+ and IP3 permeable gap junctions between neighboring cells.
Single cell model
The dynamics of a single ChR2-enabled astrocyte can be summarized by the following system of stochastic differential equations (SDEs):


| Value | Unit | Description | Source | ||
|---|---|---|---|---|---|
| IP3 Dynamics | |||||
| vδ | 0.15 | μM/s | Maximum rate of IP3 production (PLCδ1) | [35] | |
| KδCa | 0.55 | μM | Half saturation constant of Ca2+ (PLCδ1) | [35] | |
| 1.25 | s-1 | IP3 degradation rate | [35] | ||
| 0.14 | μM/s | Basal level of cytosolic IP3 production | [35] | ||
| Ca2+ Dynamics | |||||
| xCCE | 0.01 | μM/s | Maximum CCE influx | [35] | |
| hCCE | 10 | μM | Half-inactivation constant for CCE influx | [35] | |
| α1 | 0.19 | ~ | Volume ratio between ER and cytosol | [35] | |
| vSERCA | 0.90 | μM/s | Maximum rate constant of SERCA pump | [35] | |
| Kp | 0.10 | μM | Half-maximal activation of the SERCA pump | [35] | |
| d1 | 0.13 | μM | Dissociation constant for IP3 (IP3R) | [35] | |
| d5 | 0.08 | μM | Ca2+ activation constant (IP3R) | [35] | |
| v1 | 6 | s-1 | Ligand-operated IP3R channel flux constant | [35] | |
| v2 | 0.11 | s-1 | Ca2+ passive leakage flux constant | [35] | |
| kout | 0.50 | s-1 | Rate constant of Ca2+ extrusion | [35] | |
| λ | 1 | ~ | Time scaling factor | [35] | |
| ε | 0.01 | ~ | Ratio of PM to ER membrane surface area | [35] | |
| Jin | 0.04 | μM/s | Passive leakage | [35] | |
| Vm | -70 | mV | Membrane voltage | Model assumption | |
| G(Vm) | ~ | Voltage dependent rectification function | [38] | ||
| volcyt | 10-12 | L | Volume of the cytosol, assuming spherical cell | [41] | |
| Am | 4.83×10⁻⁶ | cm2 | Surface area of the astrocyte membrane (calculated using volcyt and assuming spherical cell shape) | Model assumption | |
| F | 9.65×10⁴ | C/mol | Faraday’s constant | ||
| 2 | ~ | Valence of Ca2+ ions | |||
| bt | 200 | μM | Total buffer protein concentration | [42] | |
| K | 20 | μM | Buffer rate constant ratio | [42] | |
| N | 20 | ~ | Number of IP3Rs within a cluster | [43] | |
| Gating Parameters | |||||
| a | 0.20 | (μMs)-1 | Rate constant for Ca2+ binding in IP3 inhibitory site | [35] | |
| d2 | 1.05 | μM | Dissociation constant for Ca2+ inhibition (IP3R) | [35] | |
| d3 | 0.94 | μM | Dissociation constant for IP3 (IP3R) | [35] | |
| Network Dynamics | |||||
| 1 | s-1 | Coupling coefficient of IP3 | Model estimate | ||
| 0.1 | s-1 | Coupling coefficient of Ca2+ | Model estimate | ||
| Wiener Processes | |||||
| 0.02 | s-1/2 | Variance of Wiener process of [IP3] | [35] | ||
| 0.01 | s-1/2 | Variance of Wiener process of [Ca2+]c | [35] | ||
| 0.01 | s-1/2 | Variance of Wiener process of [Co] | [35] | ||
| ChR2 Parameters | |||||
| p1 | ChRWT1 | 0.06 | ms-1 | Maximum excitation rate of c1 | [26,28,30] |
| ChRWT2 | 0.12 | ||||
| ChETA | 0.07 | ||||
| ChRET/TC | 0.13 | ||||
| ChRWT1 | 0.46 | ms-1 | Rate constant for the o1 to c1 transition | [26,28,30] | |
| ChRWT2 | 0.01 | ||||
| ChETA | 0.01 | ||||
| ChRET/TC | 0.01 | ||||
| e12 | ChRWT1 | 0.20 | ms-1 | Rate constant for the o1 to o2 transition | [26,28,30] |
| ChRWT2 | 4.38 | ||||
| ChETA | 10.51 | ||||
| ChRET/TC | 16.11 | ||||
| e21 | ChRWT1 | 0.01 | ms-1 | Rate constant for the o2 to o1 transition | [26,28,30] |
| ChRWT2 | 1.60 | ||||
| ChETA | 0.01 | ||||
| ChRET/TC | 1.09 | ||||
| p2 | ChRWT1 | 0.06 | ms-1 | Maximum excitation rate of c2 | [26,28,30] |
| ChRWT2 | 0.01 | ||||
| ChETA | 0.06 | ||||
| ChRET/TC | 0.02 | ||||
| ChRWT1 | 0.07 | ms-1 | Rate constant for the o2 to c2 transition | [26,28,30] | |
| ChRWT2 | 0.12 | ||||
| ChETA | 0.15 | ||||
| ChRET/TC | 0.13 | ||||
| Gr | ChRWT1 | 9.35×10⁻⁵ | ms-1 | Recovery rate of the c1 state after light pulse is turned off | [26,28,30] |
| ChRWT2 | 9.35×10⁻⁵ | ||||
| ChETA | 1×10⁻³ | ||||
| ChRET/TC | 3.85×10⁻⁴ | ||||
| τChR2 | ChRWT1 | 6.32 | ms-1 | Activation time of the ChR2 ion channel | [26,28,30] |
| ChRWT2 | 0.50 | ||||
| ChETA | 1.59 | ||||
| ChRET/TC | 0.36 | ||||
| g1 | ChRWT1 | 0.11 | mS/cm2 | Maximum conductance of the ChR2 ion channel in the o1 state | [26,28,30] |
| ChRWT2 | 0.10 | ||||
| ChETA | 0.88 | ||||
| ChRET/TC | 0.56 | ||||
| γ | ChRWT1 | 0.03 | ~ | Ratio of maximum conductance of the ChR2 ion channel in the o2 and o1 state | [26,28,30] |
| ChRWT2 | 0.02 | ||||
| ChETA | 0.01 | ||||
| ChRET/TC | 0.02 | ||||
| EChR2 | All variants | 0 | mV | Reversal potential of ChR2 | [38] |
The components of the G matrix are generally determined by the rate parameters of the deterministic part of the SDE, which lead to a state-dependent multiplicative noise in the system [32,44]. In calcium dynamics, the source of stochasticity is mainly attributed to the aggregation of a small number of IP3R channels in clusters, which leads to the formation of intra-cluster Ca2+ blips (resulting from random opening of a single IP3R) or Ca2+ puffs and sparks (from the concurrent opening of a large number of IP3Rs within a cluster). When coupled with other clusters, synchronized Ca2+ puffs can originate global Ca2+ events in the cell [32]. Several schemes have been developed to model the stochastic dynamics of IP3Rs in different cell types, ranging from models incorporating detailed Markov Chain processes, to those adapting Fokker-Planck approximations (or their equivalent Langevin equations) of the Markov approaches [refer to ref. [45] for a review of the deterministic and stochastic models of IP3Rs].
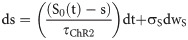
In this study, we adopted the Langevin approach outlined in ref. [43] for the dynamics of open IP3R inactivation gates in Eq 1, where the associated noise is a Gaussian white noise with zero mean and the variance () depending on the levels of [Ca2+]c, [IP3], h, and the number of IP3Rs in a cluster. We have previously estimated the noise level in the equations for [IP3], [Ca2+]c, and [Co] in astrocytes as additive, uncorrelated Wiener processes with zero mean and a constant variance () [35] using the local linearization (LL) filter [46] (Table 1). These processes account for potential sources of stochasticity other than the dynamics of the IP3R channels. We further assume that the dynamics of ChR2 gating is only deterministic, i.e., .
The dynamics of the free cytosolic calcium concentration is given by:

The efflux of Ca2+ from the ER into the cytosol via the IP3R channel can be described as:

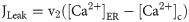
The leak of Ca2+ ions from ER into the cytosol is modeled as:
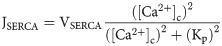
A hill-type kinetic model describing the activity of the SERCA pump is given by:
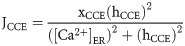
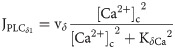
The flux through SOC channels is described using the following equation:
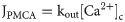
Ca2+ extrusion across the PM via PMCA is given by:
PLCδ1-mediated IP3 changes in the cell is described as:

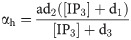
The dynamics of the fraction of open inactivation IP3R gates is given by:


The total free Ca2+ in the cell is modeled as:

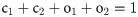
The open and closed gating dynamics of ChR2 are given by:


The existence of ChR2 in open and closed states satisfies the following algebraic condition:
The current generated through ChR2 is given by:

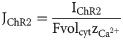
Although ChR2 is a non-selective cation channel, in this study, we assume that JChR2 is solely a calcium flux, as calcium dynamics is one of the most prominent modes of signaling in astrocytes.
Quantification of astrocytic activity
Throughout this manuscript, we calculated the light-evoked mean spiking rate and basal level of [Ca2+]c as a measure of astrocytic activity. For spiking rate calculations, we first removed the trend of simulated calcium traces, i.e., ChR2-induced steady rise in the baseline levels as observed in the traces of Figs 2 and 3. Using a threshold of 0.2 μM, calcium spikes were detected from the baseline-corrected traces and used to compute the mean spiking rate over the entire duration of stimulation. This threshold was chosen to exclude small-amplitude Ca2+ fluctuations from the calculation of the mean spiking rate. Light-induced elevations in the Ca2+ basal levels were calculated at the end of the stimulation window. These two measures were compared to study the effect of different light stimulation paradigms, i.e., varying combinations of T and δ values, as well as model parameters, on the response of optogenetically-stimulated astrocytes.
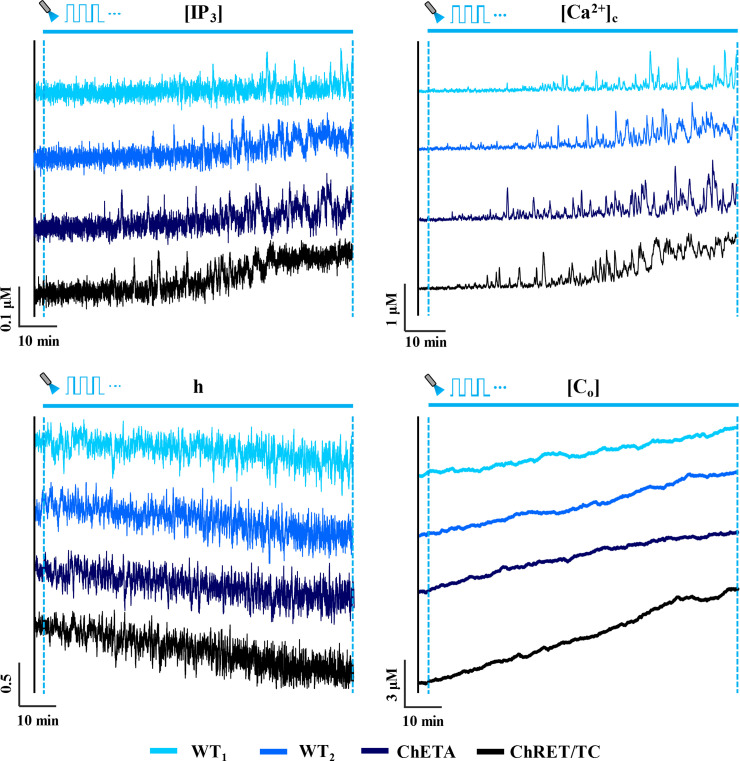
Response of ChR2 variants to light stimulation.
Representative traces (90 minutes in duration) of IP3 concentration ([IP3]), cytosolic calcium concentration ([Ca2+]c), fraction of open inactivation IP3R gates (h), and total calcium concentration ([Co]) for an astrocyte expressing various ChR2 variants (wild type 1 (WT1), wild type 2 (WT2), ChETA and ChRET/TC) in response to light stimulation (T = 2 s, δ = 20% (0.4 s), unit amplitude). The blue horizontal solid line indicates the stimulation window.
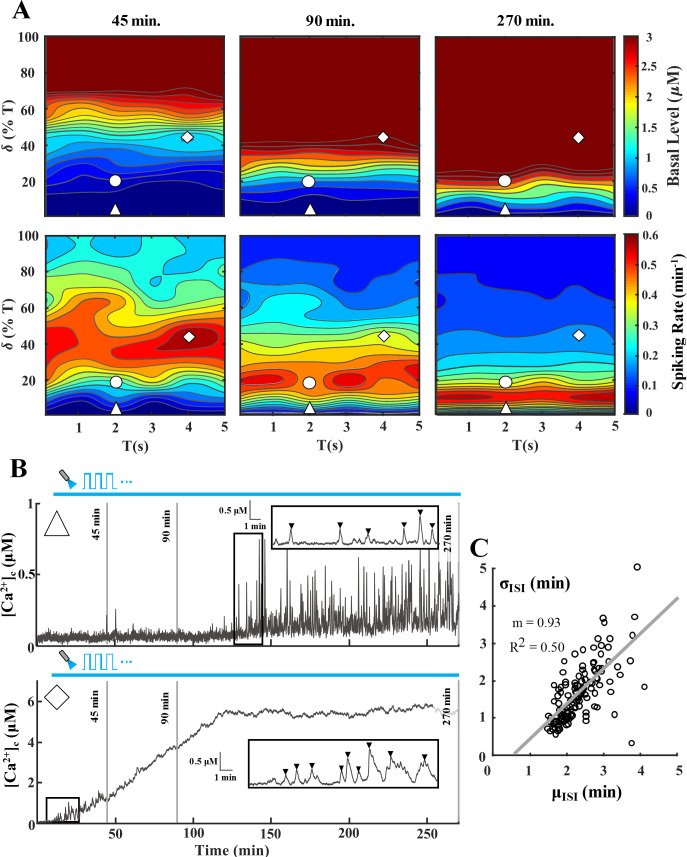
Response of a ChETA-expressing astrocyte to various light stimulation paradigms.
Simulations were conducted to evaluate astrocytic Ca2+ response to different paradigms ranging from T = 1–5 s and δ = 0–100% of T (trials = 5). A) Heat maps of Ca2+ basal level (top panel) and spiking rate (bottom panel) for the T-δ combinations assessed. Each column depicts basal level and spiking rate heat maps up to a certain point, i.e. 45, 90, and 270 minutes, to determine the cell response as light stimulation progresses from short-term to long-term. Scale bars for heat maps of basal level and spiking rate were capped to 3 μM and 0.6 spikes/min, respectively. The △ and ◊ symbols correspond to T-δ combinations that result in the traces of panel B. B) Representative [Ca2+]c traces corresponding to T-δ combinations highlighted in A [Top trace (△): T = 2 s, δ = 1% (0.02 s); Bottom trace (◊): T = 4 s, δ = 45% (1.8 s)]. The inset of each trace highlights a 15-minute section to show the detected Ca2+ spikes. For spike detection, a threshold of 0.2 μM above the basal level was utilized. Each vertical solid grey line denotes the time points corresponding to heatmaps of panel A. C) Average (μISI) vs. standard deviation of ISI (σISI) where each point corresponds to a single simulated 270-min [Ca2+]c trace. Solid line shows the linear fit between μISI and σISI values. Throughout the manuscript, △, ○, and ◊ represent paradigms resulting in low, medium, and high Ca2+ spiking during short-term (45 min) stimulation of astrocytes, respectively.
Sensitivity analysis
A global sensitivity analysis was performed to assess the sensitivity of the single cell model output, i.e., Ca2+ spiking rate and basal level, to variation in parameters determining the magnitude of ChR2 photocurrent and those describing the Ca2+ buffering kinetics. Each parameter was allowed to vary around its control value within a lower and upper bound (Table 2), and the Latin hypercube sampling (LHS) method with uniform distribution was used to select 1000 random parameter sets to perform the sensitivity analysis [47,48]. The upper and lower bounds were selected such that the range encompasses reported values of parameters for different variants of ChR2. The single cell model was solved for each parameter set, and the partial rank correlation coefficient (PRCC) for each parameter was then computed to determine the magnitude of the parameter influence (positive or negative) on the desired model output. A 95% confidence interval was chosen to determine if the exerted influence is statistically significant.
| Parameter | Range | Unit |
|---|---|---|
| ChR2 parameters | ||
| p1 | 51.28−1.50×10² | ms-1 |
| 8.16−5.47×10² | ms-1 | |
| e12 | 163.52−1.93×10⁴ | ms-1 |
| e21 | 4.00−1.92×10³ | ms-1 |
| p2 | 10.00−7.69×101 | ms-1 |
| 56.32−1.81×10² | ms-1 | |
| Gr | 7.48×10⁻²−1.20 | ms-1 |
| τChR2 | 2.89×10⁻⁴−7.6×10⁻³ | ms-1 |
| γ | 1.13×10⁻²−3.66×10⁻² | ~ |
| g1 | 7.84×10⁻²−1.05 | mS/cm2 |
| Buffering Parameters | ||
| bt | 160−240 | μM |
| K | 16−24 | μM |
Astrocytic network model
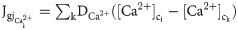
To study the network-wide response of astrocytes to light stimulation, we incorporated Ca2+ and IP3 permeable gap junctions between cells in a network of astrocytes. Fluxes:
All simulations were performed in MATLAB using the Local Linearization method described in refs. [46,49] with an integration step size of 0.1 ms. A listing of all parameters and their descriptions is provided in Tables 1 and 2. The codes associated with this study can be downloaded from http://web.eng.fiu.edu/jrieradi/CaAnalysisCode/.
Results
Effect of ChR2 variants on the light-evoked response of astrocytes
Representative traces for the time evolution of state variables of Eq 1 for astrocytes expressing different variants of ChR2 are illustrated for 90 minutes of light stimulation (Figs 2 and S1). Simulations reveal a progressive increase in the spiking activity of cytosolic calcium in all variants with the duration of stimulus. Apparent in the traces is a lag between the onset of light stimulation and regions with more regular spiking activity, likely reflecting the time required for [Ca2+]c to reach sufficient levels to activate IP3R channels. Traces show a steady increase in the total calcium content of the cell, and conversely, a decreasing trend in the fraction of open IP3R inactivation gates (h). The [IP3] levels, however, show a rather steady profile for WT and ChETA variants, and predict only a slight increase towards the end of the stimulation window for ChRET/TC. This increase can be attributed to the elevated basal [Ca2+]c in ChRET/TC expressing astrocytes, activating the production of IP3 via the PLCδ1 pathway ([Ca2+] at half- maximal activation of PLCδ1 is ~0.5 μM, Table 1). Comparison of results across variants suggests that light-induced changes are steepest in astrocytes expressing ChRET/TC. These model predictions are in line with the higher magnitude of the ChR2 flux in ChRET/TC compared to other variants in both transient and plateau regions of the photocurrent during the light stimulus (S2 Fig). Furthermore, results suggest that for the simulation time in this figure, the mechanism of light-evoked increased spiking in cytosolic calcium, predominantly in WT or ChETA enabled astrocytes, is mainly through the activation of IP3Rs by increases in [Ca2+]c rather than elevations in [IP3].
Effect of light stimulation paradigm on single cell model response
Heat maps (Fig 3A) show the effect of various light stimulation paradigms on the spiking rate and Ca2+ basal level in ChETA-expressing astrocytes for different stimulation times, i.e., 45, 90, and 270 minutes (for other ChR2 variants refer to S3 Fig). Simulations show that as the stimulus duration increases, the Ca2+ basal level rises steadily due to a net Ca2+ entry into the cytosol (note the upward trend of [Co] in the traces of Fig 2). This effect is demonstrated in representative traces of Fig 3B, where depending on the T-δ combination, [Ca2+]c may reach supraphysiological, toxic levels which bring the cell outside of the window for regular spiking (i.e., [Ca2+]c window for IP3R-mediated Hopf bifurcation; notice the bottom trace of Fig 3B). Consequently, T-δ combinations that elicit high spiking activity in astrocytes during short-term stimulation (45 min) will transition into regions with medium and low activity as the stimulus progresses (notice the ◊ symbol in spiking rate heat maps, bottom panel of Fig 3A). Conversely, as seen in the top trace of Fig 3B, combinations with low levels of spiking in short-term stimulations might transition into regions eliciting high calcium activation, with basal levels within the physiological range, as the stimulation progresses. Thus, to remain within optimal spiking and basal [Ca2+]c levels, one might choose stimulus waveforms based on the desired stimulation duration. It should be noted, however, that the predicted behavior is also a consequence of Ca2+ buffering capacity of the cell, light intensity, and parameters determining the shape and magnitude of the ChR2 photocurrent (Fig 4).
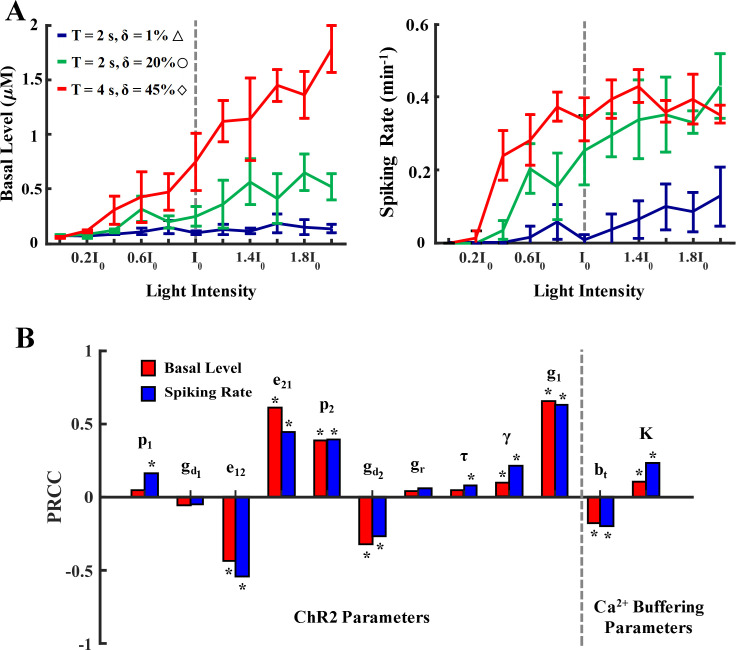
Model sensitivity to light intensity, Ca2+ buffering, and ChR2 parameters.
A) Effect of different light intensities and stimulation paradigms on the basal level and mean spiking rate of a ChETA-expressing astrocyte. Light intensity was varied as a fraction of the control value (I0). Stimulation paradigms were selected based on the 45-min spiking rate heat map in Fig 3A for low (△), medium (○), and high (◊) activity regions. Data is shown as mean ± std (trials = 5). B) Global sensitivity analysis of the astrocytic Ca2+ response to variations in ChR2 and Ca2+ buffering parameters during light stimulation (Δ: T = 2 s, δ = 1% (0.02 s)). Parameters were allowed to vary within a range (Table 2) and 1000 parameter sets were selected using Latin Hypercube Sampling (LHS) with uniform distribution. The partial rank correlation coefficient (PRCC) of each parameter was calculated as a measure of their effect on the basal level (red) and spiking rate (blue) of a ChR2-expressing astrocyte. * denotes statistically significant (p < 0.05) positive or negative influence.
To quantify the regularity of light-evoked calcium spiking in the astrocyte model, we demonstrate the σISI−μISI relationship for the inter-spike interval (ISI) values, i.e., the time between subsequent calcium spikes, of simulations in Fig 3A. The average and standard deviation of ISI of the [Ca2+]c traces are represented by μISI and σISI, respectively. This analysis has been performed for different cell types, including astrocytes, during spontaneous as well as IP3-induced calcium oscillations [31,32]. In agreement with these experimental observations, results from our simulations also show a positive and linear correlation between μISI and σISI values in the astrocytic calcium spiking during light stimulation (Fig 3C). Regions with Ca2+ levels outside of the predicted range for sustained oscillations, i.e., regions with either low or supraphysiological Ca2+ basal levels, result in infrequent and irregular spiking with higher μISI and σISI values.
Sensitivity to model parameters
Simulations predict salient features of light-induced responses in our model astrocyte, i.e., regions with elevated calcium spiking and a steady rise in the Ca2+ basal level. Results in Fig 4A show the effect of light intensity, or equivalently the amplitude of the waveform, on Ca2+ response of ChETA-expressing astrocytes for three distinct T-δ combinations. These paradigms correspond to regions with low (△), medium (○) and high (◊) spiking activity in the 45-minute stimulation heatmap of Fig 3A, respectively. For all combinations, the Ca2+ basal level shows an upward trend with increasing light intensity (with varying slopes), indicating a larger Ca2+ influx through ChR2. Similar trends are observed for spiking rates in the case of low and medium T-δ combinations. For the stimulus paradigm with highest spiking under control conditions (I0), the spiking rate plateaus over a range of intensity values and follows a declining trend upon further increase in the light intensity. This indicates that the associated increase in the basal level leads to a decrease in the firing rate of astrocytes as cytosolic calcium levels exit the region where regular oscillations can occur. These model predictions are similar to experimental observations of monotonic increase in the firing of ChR2-positive neurons stimulated with increasing light intensities [50].
We further performed a global sensitivity analysis to evaluate the effect of parameters determining the dynamics of ChR2 photocycle and buffering capacity on the astrocytic Ca2+ responses for a low light stimulation paradigm (Fig 4B). Parameters that exerted statistically significant influence on the desired model output are marked with an asterisk. Results indicate differential effects of model parameters on Ca2+ response of the astrocyte to light stimulation. For instance, increasing the maximum conductance of ChR2 in o1 state (g1) is positively correlated with both spiking rate and basal levels, as the elevated conductance results in higher magnitudes of Ca2+ influx through the channel resulting in the elevation of basal levels and further activation of IP3Rs. Similarly, e21 (the rate of transition from o2 to o1) has a positive correlation with both measures, while the rate of the reverse reaction (e12) is shown to be negatively correlated to the model output. These results suggest that by transitioning the state of ChR2 from o2 to o1, both spiking rate and basal level of Ca2+ will likely increase. This model prediction can be attributed to the higher conductance of the channel in the o1 state, the transient region of the ChR2 photocurrent in S2 Fig, compared to o2 state, the plateau region. Sensitivity analysis of the Ca2+ buffering parameters demonstrates that with increasing buffering capacity, i.e., increasing total buffer concentration (bt) or reducing the affinity of buffer proteins to Ca2+ (K), both basal Ca2+ level and mean spiking rate of astrocytes will expectedly decrease.
Network-wide astrocytic response to light stimulation
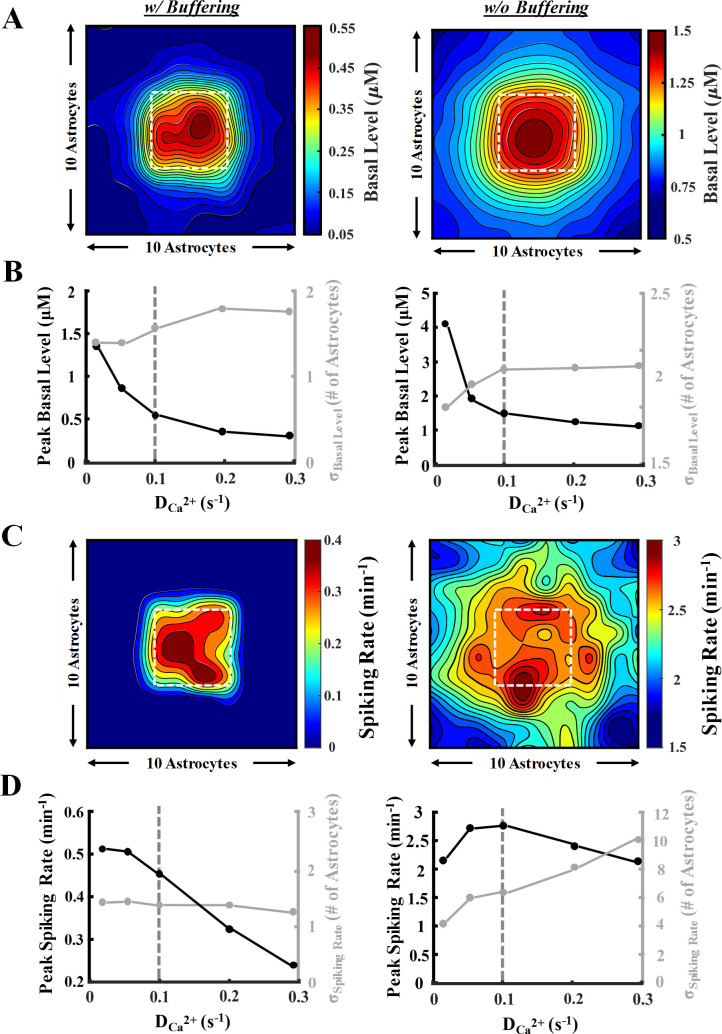
A 10-by-10 network of gap-connected astrocytes was modeled in Fig 5 and S1 Movie. Light stimulation (T = 4s, δ = 45%; = 0.1 s-1) was applied to a central region (the highlighted box in Fig 5A), and simulations were performed for 45 minutes. Fig 5A heatmaps demonstrate the resulting basal Ca2+ level in the network after light stimulation, with and without the inclusion of Ca2+ buffering. Under both conditions, results show increased basal levels in the stimulated region and the propagation of calcium to unstimulated cells. Basal levels reached in focal and distal astrocytes without buffering were drastically higher compared to those with buffering. In the presence of Ca2+ buffering, only the area in close vicinity of the stimulated region exhibits an increase in the basal level; whereas, in the absence of buffering, even the cells farthest from the stimulation region undergo an increase in calcium. This suggests that buffering reduces the diffusion range of Ca2+ within the network, thereby limiting propagation. Given the focal and centered stimulation of the network, the distribution of calcium can be suitably quantified using a 2D Gaussian fit (Eq 14). In Fig 5B, the peak basal level, along with the spread from the center (in terms of number of astrocytes), are quantified with varying values. In both cases, an intuitive decrease in peak basal level coupled with an increase in the spread is observed as increases. Both trends plateaued as values reached higher than 0.1 s-1.
Network-wide astrocytic Ca2+ response to light stimulation.
A 10-by-10 network of astrocytes was employed to analyze the response of cells when the central 4-by-4 astrocytes (white square in heatmaps of panels A and C) were stimulated (◊: T = 4 s, δ = 45% (1.8 s), 45 min). See the network organization schematic in Fig 1. Simulations were conducted in the presence (left panel) and absence (right panel) of Ca2+ buffering with varying gap junctional Ca2+ coupling coefficient (). A symmetric 2D Gaussian fit was utilized to quantify the response, i.e., peak and magnitude of the spread from the stimulated region. A) Heat maps of network-wide light stimulation-induced Ca2+ basal levels. B) Plots of the peak basal level and σbasal-level obtained from the Gaussian fit with varying values. Vertical dashed grey line denotes the value used to generate the heat maps in panels A and C. C) Heat maps of network-wide spiking rate response corresponding to basal levels in panel A. For spike classification, a threshold of 0.2 μM above the basal level was selected. D) Plots for the peak spiking rate and σspiking rate with varying values.
Similar responses are observed in the mean spiking rate of the astrocytic network upon light stimulation (Fig 5C). Inclusion of calcium buffering limited the spiking activity of astrocytes only in regions immediately surrounding the stimulated region. On the contrary, without calcium buffering, the spiking activity propagated to unstimulated areas and resulted in higher mean spiking rate values. Analysis of network-wide peak spiking rate and spread with buffering in Fig 5D (left panel) indicates a decreasing trend of peak spiking with . The propagation of the spiking rate, however, remained almost unchanged over the entire range of values examined. Conversely, when buffering was not included (Fig 5D, right panel), the increase in resulted in an increasing trend in the spread of spiking activity while the peak spiking rate remained at high values throughout. Increasing the number of cells expressing ChR2 in the network also resulted in a steady increase in both spiking rate and calcium basal levels in the network (S4 Fig) when buffering was included. Under no buffer condition, the peak basal level showed a steep incline, while the spread of the basal activity remained constant. Both peak spiking rate and spread showed an upward trend with increased expression level, with peak levels reaching a plateau when higher than 50% of the cells expressed ChR2. Collectively, simulations in Fig 5 highlight the role of calcium buffering in limiting the diffusion of free calcium in the network of astrocytes and thereby reducing both basal and spiking levels of calcium in cells. Additionally, comparison of the network results with those of single cells (Fig 3) reveals that the dispersion of calcium into the neighboring cells through gap junctions drastically reduces the supraphysiological values of calcium concentrations predicted in isolated cells.
Discussion
The past few decades have witnessed an upsurge in research on understanding the role of astrocytes in brain function. Aside from providing structural support to neurons [51,52] and regulating the ‘excitatory-inhibitory’ neurotransmitter balance [53], the exact contribution of these cells, particularly in processes involving their Ca2+ signaling, is unknown and is highly debated [see refs [1–6]]. For instance, astrocytes are thought to be directly involved in neurovascular coupling by sensing neuronal activity and releasing Ca2+-mediated vasoactive agents to relax smooth muscle cells of parenchymal arterioles [14,54,55]. However, recent experimental evidence has thrown the validity of this assumption into disarray by questioning astrocytes’ involvement, and the extent of their influence, in the onset of the hyperemic response [16,56,57]. Another controversy involving astrocytes is their potential role in modulating neuronal activity via Ca2+-mediated release of gliotransmitters. While several groups present evidence for the active involvement of gliotransmission in neuromodulation, others argue that this process is not likely to occur under physiological conditions [4,5,58]. Ca2+ homeostasis is also dramatically altered in astrocytes under several pathological conditions and during reactive gliosis [59]. These include elevated Ca2+ levels, as well as intercellular waves in epilepsy [60], Alzheimer’s disease [34,61], and spreading depression [62,63]. Despite the involvement of astrocytes in these multi-mechanistic phenomena, differentiating their specific contributions from concurrent neuronal activity has remained one of the most enduring challenges in the field. Thus, selectively targeting astrocytes, and their Ca2+ signaling, using advanced techniques like optogenetics can provide assistance in resolving the above controversies and help find answers to their exact roles in health and disease. The mathematical modeling framework outlined in our study is a step in this direction in providing a tool for experimentalists to precisely achieve desired astrocytic Ca2+ levels to examine their role in the abovementioned phenomena.
Salient features of light-evoked calcium signaling in astrocytes
Simulation results predict that calcium dynamics in astrocytes, as seen in experimental studies [33,64,65], can be heavily regulated by light-induced activation of ChR2. Consistent in all simulations performed in this study, upon light activation, astrocytes underwent increases in their basal calcium level and exhibited changes in the spiking activity (Figs 2 and 3). Our results demonstrate that the extent of the rise in calcium (reflecting the higher magnitude of entry through ChR2 compared to the rate of scavenging by PMCA, SERCA, and buffer proteins) is largely dependent on the specifications of the laser stimulus, i.e., T-δ combination and light intensity, as well as parameters determining the shape of the ChR2 photocurrent (Figs 3 and 4). Additionally, whether astrocytes show high or low spiking activity is also contingent upon the duration of light stimulation. As such, T-δ combinations with high spiking activity of single cells in short-term stimulations may transition to regions with medium or low spiking in longer durations, or vice versa (Fig 3B). These results emphasize the importance of choosing an ‘ideal’ T and δ combination for the desired short-term or long-term astrocytic activity. An inaccurate selection of these combinations could prompt astrocytes to an unphysiological Ca2+ signaling regime, which might be detrimental for the health of the cells. Whether these model predictions are physiologically accurate needs to be validated against experimental observations for both short and long-term activation of ChR2. When coupled with other astrocytes in a network, however, the dispersion of calcium to neighboring cells dramatically reduced the basal levels reached in the stimulated region (Fig 5A), with values depending on the magnitude of the calcium and IP3 coupling coefficients in the network. This indicates that experimental design for optogenetic stimulation of a network of astrocytes, e.g., in vivo recordings, cannot be solely based on predictions drawn from single cells, and that network activity depends on ChR2 expression level (S4 Fig).
Engineering of application-based ChR2 variants
Several research groups have engineered ChR2 variants with distinct characteristics, e.g. enhanced conductance, sensitivity, and faster recovery kinetics [26,28] for specific applications in excitable cells. Results of our study can be useful in the development of future ChR2 constructs for eliciting desired activity targeting astrocytes. More specifically, results of our sensitivity analysis (Fig 4B) indicated that the kinetics of ChR2 photocycle significantly affect the Ca2+ spiking rate and basal levels. Intuitively, directing ChR2 to the open states (o1 and o2) from the closed states (c1 and c2) leads to an increase in astrocytic activity in response to light stimulation. For instance, decreasing and facilitates the existence of ChR2 in the open states as they are negatively correlated to both basal level and spiking rate. Also, an increase in p2 drives the system to the open state and is positively correlated to both measures. However, less intuitively, for the simulations performed in our study, increased astrocytic activity was achieved when ChR2 resided more in the o1 state as compared to the o2 state. This can be observed as an increase in e21 and a decrease in e12 leading to the existence of ChR2 in o1 (see Fig 1 ChR2 photocycle). The shape of the photocurrents in S2 Fig also confirms that the channel has the highest flux in the o1 state (the transient phase). Collectively, these results suggest that tailoring new ChR2 constructs such that the photocurrent is directed mainly towards the o1 state can enhance the astrocytic activity. The same analysis can be performed under different stimulation paradigms and for varying durations of stimulus.
Model limitations and future directions
ChR2 is a non-selective cation channel, with varying permeability for Na+, K+, Ca2+, and H+ across different variants [24,25]. Cationic entry has shown to induce membrane depolarization which can activate voltage-gated calcium channels, although their functional role in astrocytes is a subject of ongoing debate [58], and result in further influx of calcium, potentially activating large conductance calcium activated potassium currents [66]. Activation of these channels change the membrane potential of the cell and can thus affect the magnitude of the ChR2 photocurrent, since ChR2 is Vm-sensitive. Our model does not include the dynamics of other major ionic species and does not account for the abovementioned dependencies on the membrane potential. We have also not explicitly accounted for other intracellular compartments, e.g. microdomains and mitochondria, involved in the calcium dynamics of astrocytes. In a recent study [67], it was demonstrated that inclusion of microdomains and mitochondria compartments reduced the calcium and IP3 levels required for the activation of IP3Rs in non-excitable cells and can potentially affect the ChR2-induced calcium signaling in our model. Another limitation of the model is that, in this study, we adopted the Langevin approach outlined in ref. [43] for the implementation of stochasticity in the dynamics of IP3R channels and have not accounted for the detailed diffusion of calcium ions within and between IP3R clusters. This would require a system of partial differential equations as demonstrated in ref. [32]. In this study, we sought to provide a minimalistic theoretical framework which can readily be employed by researchers for the investigation of light induced Ca2+ responses in astrocytes. Combination of the presented model with more detailed models as in [42] and [68] where exhaustive geometry and dynamics of various ionic species are accounted for, can enhance our understanding of the intricacies of the behavior of astrocytes and their response to light.
Acknowledgements
The authors would also like to sincerely thank Mr. Josue Santana for his help in the early stages of the project, and Dr. James Schummers, Dr. Nikolaos Tsoukias, Dr. Rita Alevriadou, Mr. Ramkrishnan Krishnan, and Dr. Ricardo Siu for insightful discussions.
References
1
2
3
4
5
6
7
8
9
10
11
12
13
14
15
16
17
18
19
20
21
22
23
24
25
26
27
28
29
30
31
32
33
34
35
36
37
38
39
40
41
42
43
44
45
46
47
48
49
50
51
52
53
54
55
56
57
58
59
60
61
62
63
64
65
66
67
68