 Brain metastasis detection using machine learning: a systematic review and meta-analysis
Neuro-Oncology


- Altmetric
Background
Accurate detection of brain metastasis (BM) is important for cancer patients. We aimed to systematically review the performance and quality of machine-learning-based BM detection on MRI in the relevant literature.
Methods
A systematic literature search was performed for relevant studies reported before April 27, 2020. We assessed the quality of the studies using modified tailored questionnaires of the Quality Assessment of Diagnostic Accuracy Studies 2 (QUADAS-2) criteria and the Checklist for Artificial Intelligence in Medical Imaging (CLAIM). Pooled detectability was calculated using an inverse-variance weighting model.
Results
A total of 12 studies were included, which showed a clear transition from classical machine learning (cML) to deep learning (DL) after 2018. The studies on DL used a larger sample size than those on cML. The cML and DL groups also differed in the composition of the dataset, and technical details such as data augmentation. The pooled proportions of detectability of BM were 88.7% (95% CI, 84–93%) and 90.1% (95% CI, 84–95%) in the cML and DL groups, respectively. The false-positive rate per person was lower in the DL group than the cML group (10 vs 135, P < 0.001). In the patient selection domain of QUADAS-2, three studies (25%) were designated as high risk due to non-consecutive enrollment and arbitrary exclusion of nodules.
Conclusion
A comparable detectability of BM with a low false-positive rate per person was found in the DL group compared with the cML group. Improvements are required in terms of quality and study design.
Key Points
Larger datasets are used for training algorithms in the DL group than the cML group.
The DL group showed a lower false-positive rate per person than the cML group.
The quality and study design of the published literature should be improved.
Importance of the Study
Although there is no fully established quality assessment tool for reporting machine learning research, many guidelines such as the transparent reporting of a multivariable prediction model for individual prognosis or diagnosis (TRIPOD) are currently being revised. At the point where a clear transition from cML to DL occurred for the automated detection of BM, this systematic review and meta-analysis of the algorithm performance and quality of published machine learning research highlights the technical details of cML versus DL and offers valuable information to guide studies in the future.
Brain metastases (BM) are the most common malignant brain tumors in adults. Detection of BM is important because of its high incidence (about 20% of patients with systemic cancer), its contribution to mortality in patients with advanced-stage cancer, and the comparable local control rate of stereotactic radiosurgery to radiotherapy for limited BM.1–3 Recent technological advances in MRI have led to more accurate BM detection.4–6 However, human readers also confront several challenges such as excessive workload (due to the increased burden of the initial screening and follow-up MRIs), fatigue and fluctuations in concentration, mimickers of BM,5 and risk of medico-legal problems.7
A computer-aided detection (CAD) system could potentially solve these problems. CAD can help radiologists enhance their reading efficacy by increasing vigilance.8 On account of recent progress in artificial intelligence technology, the volume of research in CAD for BM on MRI has greatly increased, particularly with the advent of deep learning (DL).9–20 The studies consistently report that CAD can automatically detect varying size of enhancing BM nodules on MRI using different machine learning algorithms, along with some false-positive lesions. To compare the results of these studies and to choose the optimal CAD algorithm for BM detection, a comparative study is needed. However, to date, the performance and technical details of CAD for BM on MRI in the literature have never been systematically reviewed.
On the other hand, classical machine learning (cML) and DL algorithms are both inherently prone to overfitting and spectrum bias. Thus, a robust study design is required to avoid such biases and to enhance the clinical impact and generalizability. However, currently there are no established quality assessment criteria specific to the systematic review of machine learning studies.21–23 In addition, it would be meaningful to compare technical details of both groups, such as the sample size of the dataset, use of external validation, or use of BM nodule size criteria. Therefore, this systematic review and meta-analysis aimed to evaluate the impact of DL over cML on the performance of CAD for BM detection, to assess the quality and methodological appropriateness of included studies, and to provide guidance for future research.
Materials and Methods
This systematic review and meta-analysis was performed according to the Preferred Reporting Items for Systematic Reviews and Meta-Analyses (PRISMA) guidelines.24
Literature Search
A search of MEDLINE and EMBASE databases was performed to find original literature that reported the detectability of machine learning using MRI data for patients with BM. The following search terms were used: ((brain metastasis) OR (brain metastases) OR (metastatic brain tumor) OR (intra-axial metastatic tumor) OR (cerebral metastasis) OR (cerebral metastases)) AND ((automated) OR (computer aided) OR (computer-aided) OR (CAD) OR (radiomic) OR (texture analysis) OR (deep learning) OR (machine learning) OR (neural network) OR (artificial intelligence)). No beginning search date was set, with the literature search being updated until April 27, 2020. The search was limited to publications written in the English language. The bibliographies of relevant articles were searched to identify any other appropriate articles.
Inclusion Criteria
Studies satisfying the following criteria were included: (1) involved patients with BM; (2) machine learning using MRI data was the index test; and (3) contained sufficient data for the detectability (proportion) analysis of the index test.
Exclusion Criteria
Studies or subsets of studies were excluded if any of the following criteria were met: (1) case reports or case series including fewer than 10 patients regardless of the topic; (2) letters, editorials, conference abstracts, systematic reviews or meta-analyses, consensus statements, guidelines, and review articles; (3) articles not focusing on the current topic; (4) articles with, or with suspicion of, overlapping populations; and (5) contained insufficient data for the detectability analysis of machine learning using MRI data for the patients with BM.
Two radiologists, S.J.C. and L.S., with 7 and 10 years, respectively, of experience in neuroimaging, independently performed the literature search and selection.
Data Extraction
We extracted data using standardized forms according to the PRISMA guidelines.24 Herein, the DL group was defined as the studies that utilized deep neural networks (eg, convolutional neural networks or its derivatives) as their main algorithm. Otherwise, the studies were classified into the cML group.21 The following data were extracted:
1. Characteristics of the included studies: authors, year of publication, institution, country of origin, duration of data recruitment, study design (prospective vs retrospective), category of validation (internal vs external, random split vs temporal split if internal validation), number of patients in each dataset (total, developmental, and test set, respectively. Due to the unclear word across the studies, we defined the developmental set as all datasets except for test set (ie, the validation set for the fine-tuning step in the DL is considered as the developmental set23), male-to-female ratio (total, developmental, and test set, respectively), and proportion of lung cancer (which is the most common primary cancer for BM) among the enrolled patients with cancer (total, developmental, and test set, respectively), number of metastatic nodules in each dataset (total, developmental, and test set, respectively), mean size of metastatic nodules in each dataset (total, developmental, and test set, respectively), proportion of nodules equal to or larger than 10 mm (total, developmental, and test set, respectively), patient inclusion criteria, and performer who determined the ground truth.
2. MRI characteristics: MRI machine and vendor, magnetic field strength (T), in-plane resolution, and slice thickness (mm).
3. Machine learning characteristics: specific type or name of algorithm of machine learning, presence of skull stripping, signal intensity normalization, segmentation, data augmentation.
4. Detectability and false-positive rate per person (the number of false-positive lesions per patient) of machine learning using MRI data for the patients with BM.
Quality Assessment
Since there is no established quality assessment tool that focuses on machine learning methodology, we selected several items from Checklist for Artificial Intelligence in Medical Imaging (CLAIM), a recently published guideline,25 and applied them to tailored questionnaires of the Quality Assessment of Diagnostic Accuracy Studies 2 (QUADAS-2) criteria.26 Specifically, the following CLAIM items were synthetically considered when assessing each domain of the QUADAS-2: (1) in the risk of bias of patient selection domain: data sources, selection of data subsets, and how missing data were handled; (2) in the risk of bias of index test domain: statistical measures of significance and uncertainty, and robustness or sensitivity analysis; (3) in the risk of bias of reference standard domain of the QUADAS-2: sufficient detail to allow replication about definition of ground truth, rationale for choosing the reference standard, qualifications and preparation of annotators for source of ground truth annotations; and (4) in concerns regarding the applicability of index test domain: validation or testing on external data.
Two reviewers (S.J.C. and L.S.) independently performed the data extraction and quality assessment. Disagreements between the 2 reviewers were discussed at a research meeting until a consensus was reached.
Data Synthesis and Analyses
The current work aimed to systematically review the relevant topic, including a detailed quality assessment, and to perform a pooled proportion analysis of detectability of machine learning using MRI data for patients with BM. The pooled proportions were calculated using an inverse-variance weighting model.27–29 A random-effects meta-analysis of proportions was utilized to calculate the overall proportions. The study heterogeneity was evaluated using Higgins inconsistency index (I2), with substantial heterogeneity being indicated by an I2 value greater than 50%.30 The comparative statistical significance of the false-positive rate per person between 2 groups was obtained using multilevel mixed-effects Poisson regression. All statistical analyses were conducted by one author (S.J.C., with 3 years of experience in conducting systematic reviews and meta-analysis), using the “meta” package in R, version 3.6.3 (http://www.r-project.org/).
Results
Literature Search
A systematic literature search (Figure 1) initially identified 1044 articles from OVID-MEDLINE and EMBASE. After removing 202 duplicates, the screening of the remaining 842 titles and abstracts yielded 21 potentially eligible articles. No additional article was identified after searching the bibliographies of these articles. After full-text reviews of the 21 provisionally eligible articles, nine articles were excluded because they were not in the field of interest,31–37 contained potentially overlapping data,38 or contained insufficient information in terms of detectability of machine learning using MRI data for patients with BM.39 Finally, 12 articles were included in the present systematic review and meta-analysis.9–20

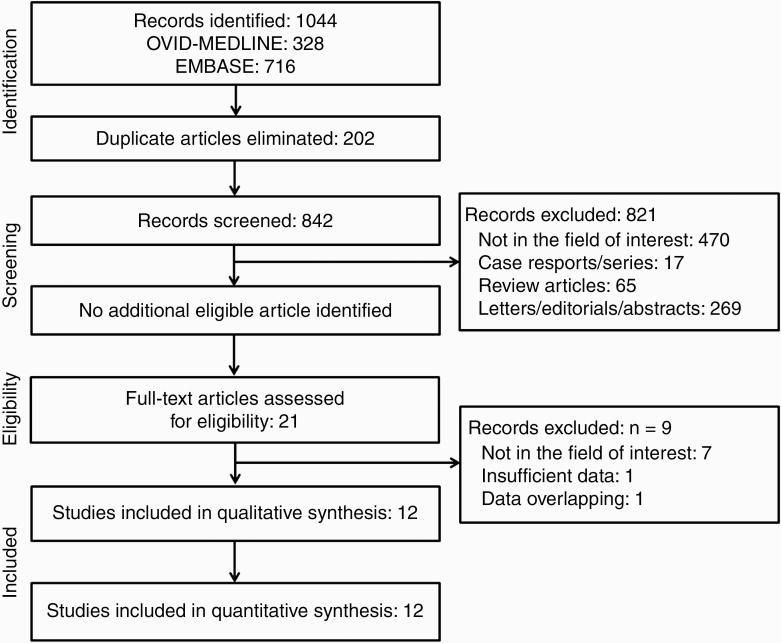
Flow diagram of the study selection process.
Characteristics of the Included Studies
Table 1 shows the detailed characteristics of the 12 studies, including 5 on cML9,13,15,16,18 and 7 on DL.10–12,14,17,19,20 One study was a multicenter study,17 but the others were all single-center studies.9–16,18–20 One study was a prospective design,13 while the others were all retrospective.9–12,14–20 One study performed external validation,17 and another study performed internal validation with a temporal split.16 All other studies performed internal validation with a random split.9–15,18–20 The number of enrolled patients across all studies was 3620, with individual studies ranging from 26 to 1632 patients. The number of metastatic nodules across all studies was 10 258, with studies ranging from 62 to 3264. There was a clear transition from cML to DL after 2018 (Figure 2). The number of enrolled patients and the metastatic nodules were relatively smaller in the cML group, ranging from 26 to 140 and 62 to 584, respectively,9,13,15,16,18 than the DL group, which ranged from 158 to 1632 and 932 to 3264, respectively.10–12,14,17,19,20 The ratio of patient numbers in the developmental set to that in the test set in 4 of the included studies was higher than 4 (all of which were in the DL group).10–12,19 The ratio was equal to or lower than 1 in 49,13,15,18 (all of which were in the cML group) of the remaining 8 studies.9,13–18,20 In terms of the number of metastatic nodules, the ratio of the developmental/test set was higher than 4 in 3 of the included studies,10,16,19 equal to or lower than 4 in 6,9,13,15,17,18,20 and available in 3 studies.11,12,14 The proportion of lung cancer among patients with underlying cancer and the proportion of the nodules equal to or larger than 10 mm are presented in Table 1. Overall, studies included highly probable metastatic nodules. In detail, 3 of the enrolled studies used a size threshold as the inclusion criteria.12,13,18 The ground truths were determined by radiologists and/or neuro-oncologists across the studies. Among them, 4 studies took the follow-up MRI into consideration to determine the ground truth.9,15,16,19

| Group | Source | Affiliation | Recruitment Duration of Data | Study design | Validation | Total Pt. No. (Dev/Test) | Total Male/Female Ratio (Dev/Test) | Total Proportion of Lung cancer, % (Dev/Test) | Total Nodule No. (Dev/Test) | Total Mean Nodule Size (Dev/Test) | Total Proportion of Nodule Size ≥ 10 mm, % (Dev/Test) | Enroll Criteria | Ground Truth |
|---|---|---|---|---|---|---|---|---|---|---|---|---|---|
| cML | Ambrosini RD et al 20109 | University of Rochester, USA | NA | Retro. | NA | 31 (9/22) | NA (NA/ NA) | NA (NA/ NA) | 203 (124/79) | 7mm (7mm/7mm) | NA (NA/ NA) | NA | By radiologist, with FU MRI |
| cML | Farjam R et al 201213 | University of Michigan, USA | NA | Pros. | Internal random split (5-fold CV) | 29 (9/20) | NA (NA/ NA) | NA (NA/ NA) | 292 (106/186) | NA (NA/ NA) | NA (NA/ 0) | Nodule size > 5mm | By a radiologist |
| cML | Pérez-Ramírez Ú et al 201615 | Universitat Politècnica de València’, Spain | January 2014-February 2014 | Retro. | Internal random split | 30 (8/22) | NA (NA/ NA) | 47.4 (50/ 45) | 62 (20/42) | 7.7mm (7.6mm/7.8mm) | 40.3 (35/ 42.9) | No history of radiosurgery | By a radiologist and a radiation neuro-oncologist, with FU MRI |
| cML | Sunwoo L et al 201716 | Seoul National University Bundang Hospital, Republic of Korea | January 2015-March 2016 | Retro. | Internal temporal split | 140 (80/60) | 1.1 (1.1/1) | 80 (77.5/ 83.3) | 584 (450/134) | 4.8 mm (5mm/4.5mm) | 22.9 (23.6/20.9) | No extra-axial metastasis or other coexistent diseases, sufficient MRI quality, nodule number < 50 | By two radiologists, with FU MRI |
| cML | Yang S et al 201318 | Severance Hospital, Republic of Korea | NA | Retro. | Internal random split | 26 (7/19) | NA (NA/ NA) | NA (NA/ NA) | 86 (33/53) | NA (NA/ NA) | 0 (0/0) | Nodule size ≥ 1mm, <10mm | By a radiologist |
| DL | Bousabarah K et al 202010 | Faculty of Medicine and University Hospital Cologne, Germany | April 2012-June 2019 | Retro. | Internal random split | 509 (469/40) | 1.1 (1.1/1.9) | 54 (54.4/ 50) | 1223 (1149/83) | 1.34 cm3 (1.3cm3/1.92 cm3 | NA (NA/ NA) | Candidate for stereotactic surgery, Sufficient MRI sequence | By radiation oncologists or neurosurgeons |
| DL | Charron O et al 201811 | Paul Strauss Center, France | 2010–2016 | Retro. | Internal random split | 182 (164/18) | NA (NA/ NA) | NA (NA/ NA) | 412 (NA/NA†) | 8.7 mm (NA/ NA) | 33.7 (NA/ NA) | No history of surgery or radiation, sufficient MRI sequence | By a radiation oncologist |
| DL | Dikici E et al 202012 | Ohio State University College of Medicine, USA | NA | Retro. | Internal random split | 158 (126/32) | NA (NA/ NA) | NA (NA/ NA) | 932 (NA/NA†) | 5.5 mm (NA/ NA) | 8.7 (NA/ NA) | Nodule size ≤ 15mm | By a radiologist |
| DL | Grøvik E et al 202014 | Stanford University, USA | June 2016-June 2018 | Retro. | Internal random split | 156 (105/51) | 0.5 (NA/ NA) | NA (NA/ NA) | NA (NA/856) | NA (NA/ NA) | NA (NA/ NA) | No history of surgery or radiation, sufficient MRI sequence | By two radiologists |
| DL | Xue J et al 201917 | Multicenter *, China | October 2016-May 2019, | Retro. | Internal random split (4-fold CV) & External | 1632 (1201/431) | 1.3 (1.3/1.1) | NA (NA/ NA) | 3264 (2402/862) | NA (4.01 cm3/NA) | NA (NA/ NA) | No extra-axial metastasis or other coexistent diseases, sufficient MRI protocol | By a radiologist and an oncologist |
| DL | Zhang M et al 202019 | Brigham and Women’s Hospital, Harvard Medical School, USA | NA | Retro. | Internal random split | 361 (316/45) | 1.6 (NA/ NA) | NA (NA/ NA) | 2053 (1777/276) | NA (NA/ NA) | 35.8 | NA | By two radiologists, with FU MRI |
| DL | Zhou Z et al 202020 | University of Texas MD Anderson Cancer Center, USA | January 2011-August 2018 | Retro. | Internal random split | 266 (212/54) | 1.5 (0.8/0.9) | 39.1 (37.3/ 46.3) | 1147 (913/383) | 10 mm (NA/ NA) | 47.6 (34.2/61.1) | Candidate for stereotactic surgery | By 3 radiologists and a radiation neuro-olcolgist |
Abbreviation: CV, cross-validation; Dev/Test; Developmental data set/ Test data set; DL, deep learning; cML, classical machine learning; NA, not available; No., number; Pt. patients; Pros, prospective; Retro, retrospective;
* Shandong Provincial Hospital; Affiliated Hospital of Qingdao University Medical College; Second Hospital of Shandong University; † We assumed number of the nodules of the test set by estimating the proportion between patients sample size or by a division of “n” of cross-validation (eg, n-fold cross-validation); ‡ Proportion of lung cancer among the total underlying cancers.
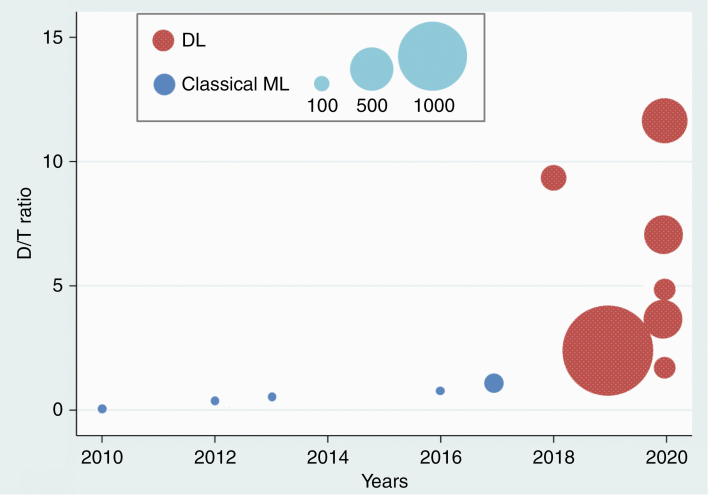
Distribution of studies by the year of publication (x-axis) and the ratio of patient numbers in the developmental set compared with the test set (D/T ratio) (y-axis). The size of the circles represents the sample size of each study. ML, machine learning; DL, deep learning.
MRI and Machine Learning Characteristics of the Included Studies
MRI examinations were performed using 1.5T scanners in 3 studies,9,11,15 3T scanners in 3 studies,13,17,18 and either 1.5T or 3T scanners in the other 6 studies (Table 2).10,12,14,15,19,20 One study acquired the images with a slice thickness of 2.5 mm,9 another study with 1 to 2 mm,17 and the others with equal to or lower than 1 mm,11–16,18–20 except for one study in which the slice thickness data was not available. All studies in the cML group used a template-matching algorithm,9,13,15,16,18 including one study that additionally used a cross-correlation method,13 and another, which additionally used a K-means clustering method.16 In the DL group, 5 of the 7 studies used a 3D convolutional neural network,10–12,17,19 one study used a 2.5D convolutional neural network,14 and the other study used a single-shot detector.20 In terms of the detailed techniques, 6 of the studies performed skull stripping (3 in cML and 3 in DL). All 12 studies performed intensity normalization, 7 of the studies performed tumor segmentation (2 in cML and 5 in DL), 7 of the studies performed data augmentation (none in cML and all 7 in DL), and 3 of the studies thresholded the enhancement degree (1 in cML and 2 in DL).
| Group | Source | MRI | Machine learning | Performance | |||||||||
|---|---|---|---|---|---|---|---|---|---|---|---|---|---|
| Machine | Tesla | In-plane resolution, mm | Slice thickness, mm | Algorithm (name) | Skull stripping | Intensity Normalization | Segmentation | Data Augmentation | Enhancement degree threshold | Detectability | False- positive rate | ||
| cML | Ambrosini RD et al 20109 | Signa, GE | 1.5 | 0.43 | 2.5 | Template-matching algorithm | Yes | Yes | No | No | NA | 90.5 | 36 |
| cML | Farjam R et al 201213 | NA, Philips | 3 | 0.94 | 1 | template-matching algorithm + cross-correlation method | No | Yes | No | NA | Yes | 93.5 | 3.3 |
| cML | Pérez-Ramírez Ú et al 201615 | Magnetom Symphony; Siemens | 1.5 | 0.5 | 1 | template-matching algorithm | NA | Yes | Yes | NA | NA | 88.1 | 6.91 |
| cML | Sunwoo L et al 201716 | Intera; Achieva; Ingenia, Philips | 1.5; 3 | 1 | 1 | template-matching and K-means clustering algorithm | Yes | Yes | Yes | No | NA | 87.3 | 302.4 |
| cML | Yang S et al 201318 | Magnetom Trio, Siemens | 3 | 1 | 1 | template-matching algorithm | Yes | Yes | No | No | NA | 81.1 | 0.42 |
| DL | Bousabarah K et al 202010 | Ingenia; Archieva; Intera, Philips | 3; 3; 1.5 | NA | NA | 3D CNN (U-Net, mo U-Net) | NA | Yes | Yes | Yes | NA | 82 | 0.35 |
| DL | Charron O et al 201811 | NA | 1.5 | 0.82 | 1 | 3D CNN (DeepMedic) | Yes | Yes | Yes | Yes | Yes | 98 | 14.2 |
| DL | Dikici E et al 202012 | Aera; Avanto; Espree; Skyra; Triotrim, Siemens; Optima MR450w; Signa HDxt, GE | 1.5 or 3 | 0.49–1 | 0.8–1 | 3D CNN (CropNet) | NA | Yes | Yes | Yes | NA | 90 | 9.12 |
| DL | Grøvik E et al 202014 | SIGNA Explorer; TwinSpeed; Discovery 750; SIGNA Architect, GE | 1.5; 1.5; 3; 3; 3 | NA | 1 | 2.5D CNN (modified GoogLeNet) | Yes | Yes | Yes | Yes | NA | 83 | 3.4 |
| DL | Xue J et al 201917 | MAGNETOM; Discovery MR750, Skyra; GE | 3 | 1 | 1.5; 1.2; 1 | 3D CNN (BMDS net) | No | Yes | Yes | Yes | NA | 96† | NA |
| DL | Zhang M et al 202019 | NA, Siemens and GE | 1.5; 3 | 0.43–1, 0.47–1 | 0.6, 1 | 3D CNN (Faster R-CNN) | Yes | Yes | NA | Yes | Yes | 95.6 | 19.9 |
| DL | Zhou Z et al 202020 | Signa HDxt; Discovery MR750w, GE | 1.5; 3 | 0.94 | 1 | single-shot detector | No | Yes | No | Yes | NA | 81 | 7 |
Abbreviations: CI, confidence interval; CNN, convolutional neural network; DL, deep learning; cML, classical machine learning; 3D, 3-dimensional.
* Charron O et al 2018 performed additional analysis for the necrotic tumor; Farjam R et al 2012 and Zhang M et al 2020 defined the degree of enhancement as follows: contrast to intensity variation ratio (CVIR) and contrast-to-background ratio (CBR), respectively.; †The study yielded detectability per voxel-wise proportion, whereas the others presented per nodule-wise proportion.
Quality Assessment of the Studies via QUADAS-2
The quality of the included studies was assessed according to the QUADAS-2 criteria,26 under the consideration of the CLAIM guideline.25 The results are presented with a diagram in Supplementary Figure 1, and the detailed assessment is presented in Table 3 according to the domain of the risk of bias and concern of applicability, respectively. In the patient selection domain of risk of bias, two enrolled studies were considered to have a low risk of bias,14,16 3 studies were considered to have a high risk of bias due to non-consecutive patient selection and excluding nodules by size criteria,12,13,18 whereas the other studies with non-consecutive patient selection were considered to have an unclear high risk of bias.9–11,15,17,19,20 In the index test domain, all studies were considered to have a low bias risk because the ground truth was blinded to the machine, and a prespecified threshold (determined in the algorithm development phase) was used in the test phase. In the reference standard domain, 5 studies were considered to have a low risk of bias since they defined the ground truth of metastasis under the consideration of the follow-up MRI,9,15–17,19 whereas the others were considered unclear.10–14,20 In the flow and timing domain, two studies were considered to have an unclear risk of bias because some patients in these studies were excluded during the size thresholding of the BM nodules,13,18 while the others were considered to have a low risk of bias.9–12,14–17,19,20 In the index test domain of concern of applicability, 2 studies which performed internal validation with a temporal split or external validation were considered to have a low concern of applicability, whereas the others that used internal validation with a random split were considered to have an unclear concern of applicability.9–15,18–20 Besides, all studies were considered to have low applicability in the patient selection and reference standard domains.
| Source | Risk of Bias | Concern of Applicability | ||||||||||||
|---|---|---|---|---|---|---|---|---|---|---|---|---|---|---|
| Patient selection | Index Test (Machine Learning) | Reference Standard | Flow and Timing | Patient Selection | Index Test§ | Reference Standard | ||||||||
| Consecutive | Case- control | Inappropriate Exclusion | Blinded to Ref/Stan. | Prespecified- threshold | Correctly Classified Target Condition | Blinded to Index test | Adequate Interval: Index to Ref/Stan. | All patients with Ref/ Stan. | Same Ref/ Stan. | All patients analyzed | ||||
| Ambrosini RD et al 20109 | Uncelar | No | No | Yes | Yes | Yes† | Yes | Yes | Yes | Yes | Yes | Low | Unclear | Low |
| Farjam R et al 201213 | Uncelar | No | Yes* | Yes | Yes | Unclear | Yes | Yes | Yes | Yes | Uncelar‡ | Low | Unclear | Low |
| Pérez- Ramírez Ú et al 201615 | Uncelar | No | No | Yes | Yes | Yes† | Yes | Yes | Yes | Yes | Yes | Low | Unclear | Low |
| Sunwoo L et al 201716 | Yes | No | No | Yes | Yes | Yes† | Yes | Yes | Yes | Yes | Yes | Low | Low | Low |
| Yang S et al 201318 | Uncelar | No | Yes* | Yes | Yes | Yes† | Yes | Yes | Yes | Yes | Unclear‡ | Low | Unclear | Low |
| Bousabarah K et al 202010 | Uncelar | No | No | Yes | Yes | Unclear | Yes | Yes | Yes | Yes | Yes | Low | Unclear | Low |
| Charron O et al 201811 | Uncelar | No | No | Yes | Yes | Unclear | Yes | Yes | Yes | Yes | Yes | Low | Unclear | Low |
| Dikici E et al 202012 | Uncelar | No | Yes* | Yes | Yes | Unclear | Yes | Yes | Yes | Yes | Yes | Low | Unclear | Low |
| Grøvik E et al 202014 | Yes | No | No | Yes | Yes | Unclear | Yes | Yes | Yes | Yes | Yes | Low | Unclear | Low |
| Xue J et al 201917 | Uncelar | No | No | Yes | Yes | Yes† | Yes | Yes | Yes | Yes | Yes | Low | Low | Low |
| Zhang M et al 202019 | Unclear | No | No | Yes | Yes | Yes† | Yes | Yes | Yes | Yes | Yes | Low | Unclear | Low |
| Zhou Z et al 202020 | Uncelar | No | No | Yes | Yes | Unclear | Yes | Yes | Yes | Yes | Yes | Low | Unclear | Low |
* The studies excluded nodules using a size criteria; † The studies assessed the metastasis on follow up MRI.; ‡ Several patients were excluded during the size thresholding process.; § The temporal separation and external validation data sets were considered as a low concern of applicability.
Pooled Detectability Performance of the MRI
For all 12 included studies, the pooled proportion of detectability of machine learning using MRI data for the patients with BM was 90.0% (95% confidence interval [CI], 85–93%), ranging from 81.1% to 98% (Table 2 and Figure 3). Heterogeneity was present (I2 = 90%). The subgroup pooled proportion of detectability of the cML group, and DL group were 88.7% (95% CI, 84–93%) and 90.1% (95% CI, 84–95%), respectively, with no statistical difference. The DL group showed a significantly lower false-positive rate per person than the cML group (10 vs 135, P < 0.001). Otherwise, there was no significant factor affecting the heterogeneity among the type of machine learning (cML vs DL), sample size ratio (developmental set/test set), nodule number ratio (developmental set/ test set), and nodular number per person on the meta-regression analysis.
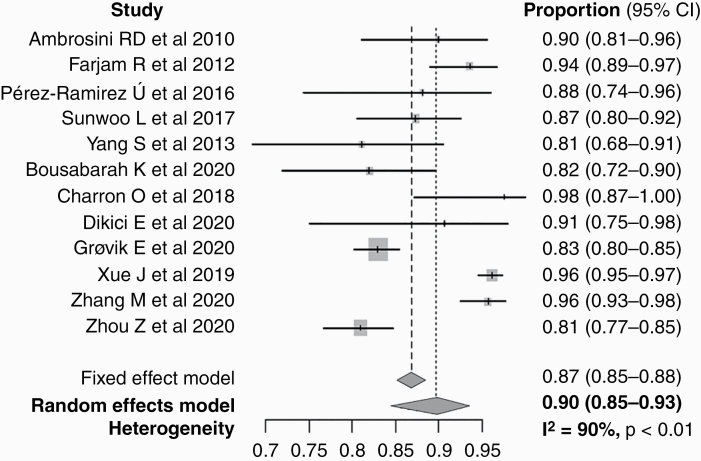
Forest plot of the pooled proportion of detectability.
Discussion
In this study, the machine learning studies of BM detection on brain MRI were systematically evaluated concerning the demographics, MRI and machine learning methodology, and quality of reporting. In terms of methodology, machine learning research can be categorized into cML and DL. A clear transition from cML to DL was noted after 2018, and the number of papers on automated detection of BM has gradually increased since then. Therefore, at this point, it is important to systematically review the published machine learning research and provide guidance for future studies. We found that cML studies were based on a smaller sample size than DL studies. Although the pooled proportion of detectability of BM between the cML and DL groups was not significantly different (88.7% and 90.1%, respectively), the false-positive rate per person was significantly lower in the DL group than the cML group (P < 0.001). Based on the modified version of CLAIM and QUADAS-2 criteria, we found that at least some studies were considered to have a high or unclear risk of bias in the domains of patient selection, reference standard, and flow and timing. These results shed light on the current state of the technology, as well as the need for quality improvement.
As the overall incidence of BM is estimated to be 20% in systemic oncology patients, and it is a major contributor to cancer mortality in patients with advanced-stage cancer, detection of BM is essential so that treatment can be initiated.1,2 Advances in neuroimaging, particularly the use of 3D MR imaging, has enhanced the sensitivity of BM detection at initial cancer detection.4–6 Among the common underlying cancer origin including lung, breast, skin, colon, pancreas, testes, ovary, cervix, renal cell carcinoma, and melanoma,1 the current National Comprehensive Cancer Network guidelines recommend screening brain MRI for patients with lung cancer (stage II to IV non-small-cell lung cancer, small cell lung cancer of any stage) and melanoma (stage IIIC to IV) regardless of the patient’s neurologic suspicion.40 In addition, due to recent technological advances in stereotactic radiosurgery, accurate diagnosis and localization of BM have become even more important. However, despite such demand, there are several challenges in accurate BM detection for radiologists. Thinner slice thickness images led to an increased detection rate of tiny BM nodules but increase the workload, detect mimickers such as small vessels more frequently,5 and increase the risk of medico-legal problems in case of detection failure.7
CAD systems for BM using machine learning methodology have been proposed to overcome these issues.9–20 Generally, the 2 groups (cML and DL) share methodologically common features, such as the use of development and validation datasets, the need for data labeling, and preprocessing. In both groups, the development dataset is used to train the model, which needs to be sufficiently large so that it consists of a sufficient number of observations to reach the optimal performance.41,42 However, the sample size of the development dataset required for training the model sufficiently differs in both groups. In most cML methods, the features are predetermined by an expert with domain knowledge. Thus, the data are mainly used to determine thresholds or parameters of the model in cML; hence, the required data for training tend to be relatively limited. On the other hand, the features are not predefined in DL. Instead, they are subsequently learned by the algorithm itself.43 In addition, because DL is generally built with much more complex network architecture than is cML, reaching up to several millions of hyperparameters for recent forms of convolutional neural networks,44 inevitably requires much bigger data. As such, we found that the number of enrolled patients and the metastatic nodules in this study were relatively larger in the DL group, ranging from 62 to 584 and 932 to 3264, respectively, compared with the cML group, in which it ranged from 26 to 140 and 158 to 1632, respectively. Furthermore, it was noted that only studies in the DL group performed data augmentation during the model development. Data augmentation refers to boosting the training data by rotation, resizing, or signal modulation to compensate for the relative shortage of data, thereby facilitating the training and reducing the risk of overfitting.45 On the other hand, in terms of the test set, there is relatively little difference between cML and DL in its size. Consequently, the sample size ratio of developmental/test was higher than 4 in the majority of DL studies, whereas the ratio was less than 1 in most cML studies.46,47
In this study, we found that the false-positive rate per person was significantly reduced in the DL group compared with the cML group, while the pooled proportion of BM detectability remained comparable. This suggests that overall, the DL group tended to perform better than cML group. At a given performance level, if we choose to set the algorithm to be more sensitive (towards higher detectability), the algorithm will become less specific (towards higher false-positive rate), and vice versa. Thus, since the detectability was fairly high for cML studies, recent DL studies might have put more effort into lowering the false-positive rate per person while maintaining the detectability. Due to the limited number of analyzed studies and the “black-box” nature of DL,21–23 it is challenging to assess the reasons for improved performance of DL studies compared with cML studies. Although the handcrafted features selected by the experts with domain knowledge in classical ML seems to be quite effective, the combination of more complex network architecture with bigger training data might have enabled the DL model to learn formerly unknown clues in detecting a nodule and differentiating true metastasis from false-positive lesions. In addition, the use of data augmentation would have contributed to enriching the development dataset. We believe that the reduction of the false-positive rate has clinical implications as this would help alleviate the increased workload of human readers using CAD systems. Future studies need to be carried out to clarify the reason for the improved performance and to enhance the explainability of DL.
Given that we are undergoing a transition period from cML to DL, it would be particularly meaningful to perform a quality assessment of research regarding the detection of BM on brain MRI. Unfortunately, the quality assessment tool for reporting the detection performance of machine learning studies has not yet been fully established. Recently, to address applications of artificial intelligence in medical imaging that include classification, image reconstruction, text analysis, and workflow optimization, CLAIM has been proposed as an extension of the Standards for Reporting and Diagnostic Accuracy Studies (STARD) guideline.25,48 Therefore, we assessed the included studies using the QUADAS-2 criteria framework,26 adjusted by CLAIM. One concern is whether the dataset reflects the real-world data in terms of the clinical aspect. 3 of the enrolled studies excluded nodules during data handling due to their size. Only two of the enrolled studies declared that patients were “consecutively collected” during the patient enrollment process, and only two performed data sampling with a temporal split or external validation. Non-consecutive sampling has a risk to obscure the spectrum of the disease in the dataset.22,49 Many reviewers of machine learning research recommend consecutive rather than convenient sampling, split rather than random sampling, temporal split in internal sampling studies, and external or global sampling methods to reduce the overfitting and spectrum bias, as well as enhance the clinical impact and generalizability.21–23 Many existing guidelines, such as the transparent reporting of a multivariable prediction model for individual prognosis or diagnosis (TRIPOD), are a work-in-progress with regard to machine learning studies.50 These guidelines will help to improve the robustness of the methodology used, lower the overfitting and spectrum bias, and ultimately enhance the reproducibility of machine learning studies.
This study has some limitations. First, a relatively small number of studies are included. However, the numbers of enrolled studies in the cML and DL groups were well balanced to offer parallel evaluation. Second, we could not compare the performance of BM detection between a human performer and CAD due to the limited number of available studies. A further comparative study is warranted to confirm the added value of CAD.
In conclusion, a comparable detectability of BM with a low false-positive rate per person is noted in the DL group compared with the cML group. Improvements are required in terms of quality and study design.
Funding
This study was supported by a grant from the National Research Foundation of Korea (grant number: NRF-2018R1C1B6007917).
Conflict of interest statement. The authors report no conflict of interest, and the present study has not been presented elsewhere.
Authorship statement. S.J.C.: experimental design, the implementation, analysis, and interpretation of the data, writing of the draft manuscript, and approval of the final version. L.S.: experimental design, the implementation, analysis, and interpretation of the data, writing of the manuscript at the revision stage, and approval of the final version. S.H.B., Y.J.B., B.S.C., and J.H.K.: analysis and interpretation of the data, writing of the manuscript at the revision stage, and approval of the final version.
References
3.
4.
6.
7.
8.
9.
10.
11.
12.
13.
14.
15.
16.
17.
18.
19.
20.
21.
22.
23.
24.
25.
26.
27.
28.
29.
30.
31.
32.
33.
34.
35.
36.
37.
38.
39.
40.
41.
42.
43.
44.
45.
46.
47.
48.