 Corrigendum to article “Quantitative proteomics reveals that long non-coding RNA MALAT1 interacts with DBC1 to regulate p53 acetylation’’
Nucleic Acids Research

These authors contributed equally to the work as first authors.

- Altmetric
The Authors wish to report some errors in their article.
In the original Figure 5D, the representative overlay images for the vector and MALAT1+DBC1 cells do not match the corresponding BrdU and Hoechst images in the first two columns. Overlay images from other fields were used by mistake during figure assembling. The correct images are shown in the revised figure 5 below.

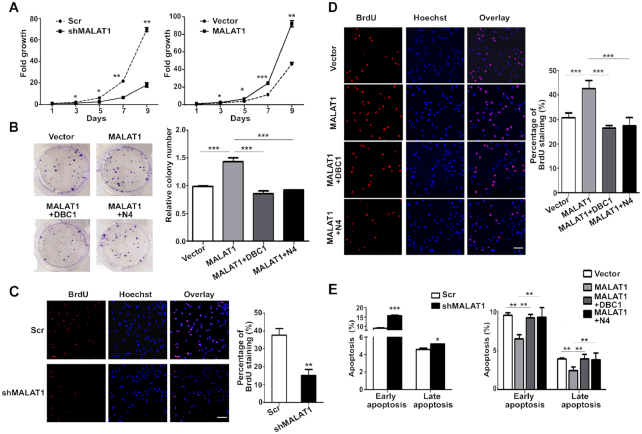
MALAT1 regulates cell proliferation and apoptosis in HepG2 cells through binding with DBC1. (A) The growth curve of MALAT1-downregulated cells (left panel) and MALAT1-overexpressed cells (right panel) over 9 days. Cells (2 × 10⁵) were seeded in each well, and the cell numbers were counted every 48 h. Data are from three independent assays. Bar, mean; error bar, SD (*P < 0.05, **P < 0.01, ***P < 0.001, by repeated measures ANOVA). (B) Colony-formation assay of HepG2-MALAT1 and HepG2 cells co-transfected with both MALAT1 and DBC1 or DBC1-N4. Representative images show the results of the colony-formation assay (left panel). Histogram shows the relative colony numbers (right panel). Data are from three independent assays. Bar, mean; error bar, SD (***P < 0.001, by one-way ANOVA). BrdU incorporation analysis of MALAT1-knockdown HepG2 cells (C) and MALAT1-overexpressing cells with or without the overexpression of full-length or N4 fragment of DBC1 respectively (D). Representative images showing alterations in S phase distribution (left panel). Histogram shows the percentage of BrdU staining (right panel). Data are from three independent assays. Bar, mean; error bar, SD (**P < 0.01, ***P < 0.001, by Student's t-test or one-way ANOVA). (E) Annexin V assay for analyzing cell apoptosis in HepG2 cells transfected with shMALAT1 plasmid (left panel) or MALAT1-overexpressing plasmid with or without co-transfection of full-length or N4 fragment of DBC1 respectively (right panel). Data are from three independent assays. Bar, mean; error bar, SD (*P < 0.05, **P < 0.01, ***P < 0.001, by Student's t-test or one-way ANOVA).
In the original Supplementary Figure S2E, the gel image of SF3B3 was inadvertently duplicated from the image of IGF2BP2, which is on the left in the exact same figure. The correct image is shown in the revised Figure S2 below.
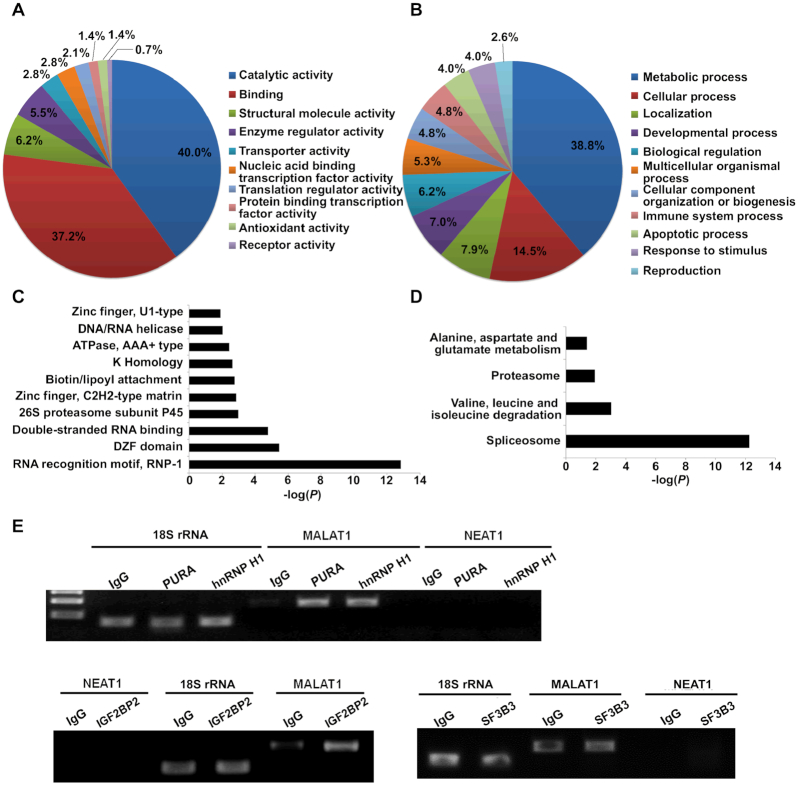
Gene ontology analysis of the identified MALAT1-interacting proteins and the validation using RNA immunoprecipitation (RIP). (A) Diagram showing the molecular functions of the identified MALAT1-interacting proteins. (B) Diagram showing the related biological processes of the identified MALAT1-interacting proteins. The annotation information was acquired through the Panther database (http://www.pantherdb.org). Bar graphs present the P values of the enriched protein domains (C) and signaling pathways (D). The protein domain and pathway analyses were performed using DAVID (https://david.ncifcrf.gov/). (E) Agarose gel electrophoresis analysis of the qRT-PCR products of MALAT1, 18S rRNA and NEAT1 in the immunoprecipitates of the selected proteins. IgG was used as negative control.
In the original Supplementary Figure S5B, the blot of p53 doesn’t match the raw data. The correct image is shown in the revised Figure S5 below.
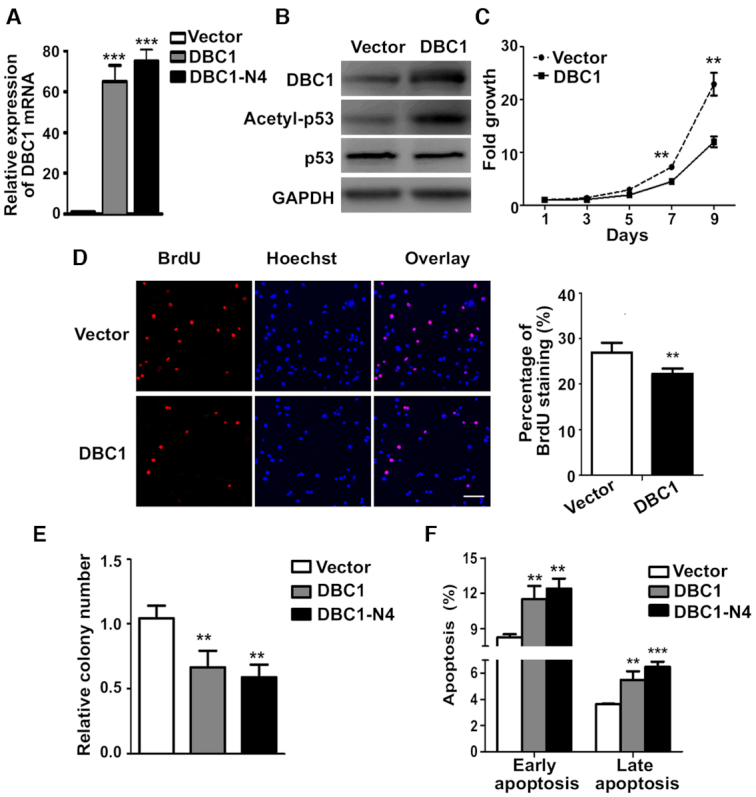
DBC1 and DBC1-N4 inhibit cell proliferation and promote apoptosis. (A) The overexpression of DBC1 and DBC1-N4 was examined by qRT-PCR. Data represent the means ± SD of triplicate independent analyses (***P < 0.001, by student's t-test). (B) Western blot analysis indicates that DBC1 overexpression increases p53 acetylation. GAPDH expression was used as a control. (C) Growth curve assay using DBC1-overexpressing HepG2 cells. Data represent the means ± SD of triplicate independent analyses (**P < 0.01, by repeated measures ANVOA). (D) BrdU incorporation analysis using DBC1-overexpressing HepG2 cells. Histogram shows the means ± SD from two independent experiments (**P < 0.01, by student's t-test). (E) Colony-formation assay was performed to study the proliferation of HepG2 cells overexpressing full-length DBC1 or DBC1-N4, and their corresponding control cells. Data represent the means ± SD of two independent analyses (**P < 0.01, by one-way ANOVA). (F) Apoptosis analysis of HepG2 cells overexpressing full length DBC1 or DBC1-N4. Apoptotic cells were detected by Annexin V/PI staining assay and examined by flow cytometry. Data represent the means ± SD of triplicate independent analyses (**P < 0.01, ***P < 0.001, by one-way ANOVA).
These errors have no impact on the results and conclusions reached in the article.