 LegumeIP V3: from models to crops—an integrative gene discovery platform for translational genomics in legumes
Nucleic Acids Research


- Altmetric
Legumes have contributed to human health, sustainable food and feed production worldwide for centuries. The study of model legumes has played vital roles in deciphering key genes, pathways, and networks regulating biological mechanisms and agronomic traits. Along with emerging breeding technology such as genome editing, translation of the knowledge gained from model plants to crops is in high demand. The updated database (V3) was redesigned for translational genomics targeting the discovery of novel key genes in less-studied non-model legume crops by referring to the knowledge gained in model legumes. The database contains genomic data for all 22 included species, and transcriptomic data covering thousands of RNA-seq samples mostly from model species. The rich biological data and analytic tools for gene expression and pathway analyses can be used to decipher critical genes, pathways, and networks in model legumes. The integrated comparative genomic functions further facilitate the translation of this knowledge to legume crops. Therefore, the database will be a valuable resource to identify important genes regulating specific biological mechanisms or agronomic traits in the non-model yet economically significant legume crops. LegumeIP V3 is available free to the public at https://plantgrn.noble.org/LegumeIP. Access to the database does not require login, registration, or password.
INTRODUCTION
Legumes are second only to the Graminiae in their importance to humans (1). Crops of this large plant family are excellent food and feed sources for humans and animals, providing proteins with essential amino acids, complex carbohydrates, dietary fiber and other nutrients. Legumes feature efficiently fixing atmospheric nitrogen (N) through N-fixing endosymbiosis with soil bacteria called rhizobia that colonize the root cells of leguminous plants. Therefore, these plants have been used for centuries to increase soil fertility through biological N-fixing and improve crop yields. There is great interest in using and further improving legumes to meet the global food and feed production challenges, promoting low-input regenerative agriculture by decreasing the use of N fertilizers, improving biodiversity both above and below ground and protecting the environment.
Recent advances in genome editing have provided researchers molecular tools to modify target DNA precisely and economically in almost any plant, opening the door to a new plant breeding and bioengineering frontier. Genome-editing technology requires prior knowledge about the characteristic sequences or genes that control the desired agronomical traits. Progress in fundamental legume biology has focused on the model species. Knowledge about trait-associated genes and pathways in the non-model crop legumes is often lacking. Such limitation hinders the application of modern sequence-based bioengineering and breeding to crop legumes.
We have been continuously developing the LegumeIP, an integrative database for comparative genomics and transcriptomics of model and crop legumes (2,3). The previous versions focused on model legumes such as Medicagotruncatula, Glycine max and Lotus japonicus. The study of these model legumes has played a vital role in understanding essential genes, pathways and networks regulating important biological mechanisms or agronomic traits. The costs of sequencing for DNA (genome) and RNA (transcriptome) have been decreasing consistently during the past five years. Since the release of LegumeIP V2, a significant amount of genomic and transcriptomic data for many rarely studied non-model legumes have been generated, providing data and insights for the research and improvement to non-model crop legumes. We present the significantly updated LegumeIP V3 database, which enables translational genomics to identify novel key genes in less-studied non-model legume crops by referring to the knowledge gained in model legumes.
In the new release (V3), we included the genomics and RNA-seq-based transcriptomics data for all known sequenced non-model legume crops, such as Arachis hypogaea (peanut), Cajanus cajan (pigeon pea), Cicer arietinum (chickpea), Phaseolus vulgaris (kidney bean), Trifolium pratense (red clover), Trifolium subterraneum (sub clover), Vigna angularis (adzuki bean), Vigna radiata (mung bean), Vigna unguiculata (cowpea), Lupinus angustifolius (lupine) and Medicago sativa (alfalfa). The database now contains the genomic data for 22 species (17 legumes and five reference model plants as outgroups) and more than 115 RNA-seq experiments consisting of 2,600 runs (mainly for model species).
In addition to the biological data, the LegumeIP V3 provides users a rich set of comparative and translational genomics tools that enable gene and pathway discovery in non-model crop legumes. The integrated analytical tools and rich data from model species facilitate the discovery of critical genes, pathways and networks that control important biological mechanisms or agronomic traits, such as biological nitrogen fixation, tolerance to drought, low nitrogen (N) and phosphorus (P) nutrients and resistance to pathogens. The comparative genomic tools further aid in translating these bits of knowledge to other less-studied non-model legume crops. These are the most significant and fundamental improvements compared to previous versions. Thus, the updated database will be a valuable resource for identifying genes and pathways in these non-model yet economically important legume crops.
DATA COMPILATION AND PRE-PROCESS
The LegumeIP V3 currently hosts the genomic data from 22 plant species [Supplemental Table S1], including model legumes, non-model legume crops and five non-legume outgroup species. The database defines each specific version of genome annotation in a species as a different reference genome. Under each reference genome, we functionally annotated genes and proteins using an in-house automatic genome annotation pipeline through which all proteins were searched against plant UniProt database (4) using the NCBI BLASTP (5) with e-value cutoff <1e–4. The ontology terms, such as gene ontology (GO) terms (6) and KEGG Orthology (KO) terms (7), were extracted from functional descriptions of protein in UniProt. Also, these proteins were annotated using the InterProScan annotation pipeline (8).
We further annotated each gene by its primary protein using HMMs (hidden Markov models) from PANTHER library Version 15.0 (9) and classified the protein and corresponding gene into PANTHER families. Each primary protein and its gene were grouped with its homolog or ortholog using the OrthoFinder pipeline (10). Both annotation procedures provide valuable information to identify genes from the same evolutionary origin but different species. We performed multi-alignments analysis for member proteins from each PANTHER family (11). We employed both Maximum Likelihood (ML) and Neighbor-Joining (NJ) approaches to build phylogenetic relationships for these member proteins. The ML trees were constructed by RAxML (12) software with a bootstrap setting of the value 100, and the NJ trees were built by QuickTree (13).
LegumeIP V3 contains RNA-seq data downloaded from the public repository for all included species with a focus on model species, such as Medicago truncatula, Glycine max (soybean), Lotus japonicus, Solanum lycopersicum (tomato), Populus trichocarpa (poplar), Hordeum vulgare (barley), Oryza sativa (rice) and Arabidopsis thaliana. These data cover diverse experimental conditions, including ecotype, mutations, tissues, developmental stages and treatments (Supplemental Table S1). Such a comprehensive dataset provides insights into key genes, pathways and networks regulating important biological mechanisms and agronomic traits. Meanwhile, all non-model legumes in the LegumeIP V3 have some RNA-seq data, at least as evidence of gene models.
The included RNA-seq runs were curated and organized into a hierarchical structure with experiment, condition and sample. One RNA-seq run (or sometime multiple combined RNA-seq runs) typically represents a sample that also is called a biological replicate under an experimental condition. The condition is described with species, ecotype, mutation, tissue, developmental stage and treatment type/level/period. Multiple experimental conditions form an experiment under a specific experimental design. All RNA-seq reads were mapped against their respective reference genomes using STAR (14) and further analyzed for raw counts using RSEM (15). Both read-to-genome alignments in BAM format (16) and read raw counts are stored in database for gene discovery, model curation and expression analysis.
INFRASTRUCTURE AND TECHNICAL IMPLEMENTATION
We redesigned front-end interfaces, back-end database schema and analysis pipelines for LegumeIP V3. The front-end interface was developed with Python 3 and its Flask web framework (https://palletsprojects.com/p/flask/). The annotation data and sequence data, including genomic sequences, gene, transcript, protein and other sub-gene elements, are stored in the popular open-source relational database MariaDB (https://mariadb.org/) with table schema described by Chado (17) with some modifications. We used such modern web technologies as HTML 5, Bootstrap 4 and jQuery to improve user experiences. Several analysis functions were developed with the R Bioconductor package (18) and python SciPy (19) and PANDAS packages (20).
NEW DATA ANALYSIS FUNCTIONS
Gene expression analysis
RNA-seq data normalization
Users can analyze gene expression data stored in the LegumeIP database. The normalized gene expression values of each RNA-seq sample depend on other samples that were selected together in the RNA-seq analysis. LegumeIP does not store the pre-normalized result in advance until users choose RNA-seq dataset at sample level and submit for on-the-fly normalization (21) based upon the selected sample list. The sample with low quality, such as a biological replicate that is deviated far away from other replicates, can be identified by built-in principal component analysis (PCA) and further excluded from normalization procedure per user decision. The normalized RNA-seq result enables the user to compare the gene expression values of specific genes across conditions.
Differential expression analysis
LegumeIP integrates the DESeq2 package (21) to perform differential expression (DE) analysis between two conditions. The DE analysis function is a valuable tool for identifying genes or transcripts that were significantly high or low expressed in treatment condition (e.g. drought stress) compared to the control condition.
Co-expression analysis
LegumeIP incorporates the Bioconductor R package WGCNA (22) for gene co-expression analysis based on large-scale gene expression profiles. This built-in tool allows users to select RNA-seq data in terms of conditions and perform ‘bicor’ correlation analysis (22) between genes, and further cluster genes with similar expression patterns among chosen conditions. The co-expression analysis function aims to identify the gene modules involved in a specific biological mechanism or pathway.
Pathway analysis
Prior knowledge gained in model species can serve as a reference for discovering new genes involved in a similar biological mechanism or pathway in non-model species. LegumeIP has integrated a pair of pathway- and ontology term-enrichment analysis tools based on GO and KEGG databases, respectively. Both tools accept gene lists directly from users or other integrated upstream analysis tools, such as the DE analysis output or gene search results, and perform hypergeometric distribution tests using Python SciPy package. The P-values are corrected by Benjamini–Hochberg adjustment for multiple hypothesis testing (23). The over-representation of GO or KO terms measured by the adjusted P-values provide gene function and biological pathway information.
USER INTERFACES
Selection of organism and reference genome
The database currently contains 22 species and 24 genome annotation versions, which are briefly listed on the left panel of the Home page or detailed in the Organism page (also see Supplemental Table S1). Both pages can be accessed from the top navigation bar. Since most of the query and analysis functions need to be performed on a specific genome, users must first select the species and genome annotation version. With selected genome, users can search genes and protein families, perform gene expression analysis, and conduct other investigations, such as KEGG pathway and GO term enrichment analysis and BLAST.
Comprehensive search of genes and families
In LegumeIP, a feature can be any sequence element, such as gene, transcript, CDS, promotor or protein. Users can search these features in the Gene page using keywords, ontology term accessions, feature accessions and sequence coordinates (Figure 1A). Currently, LegumeIP contains feature annotation referring to popular ontology databases, including GO, KEGG KO, PANTHER and InterProScan. After submission, the matched features will be listed with links to the individual Gene Card page. It is worth pointing out that the Gene Card page includes sequence, annotation, coordinates of the gene and, also importantly, its expression data in bar charts for predefined Expression Profile datasets. Embedded in the Gene Card page, the JBrowse plugin (24) is deployed to visualize gene structure and alignments of RNA-seq reads on the genome (Figure 1B).

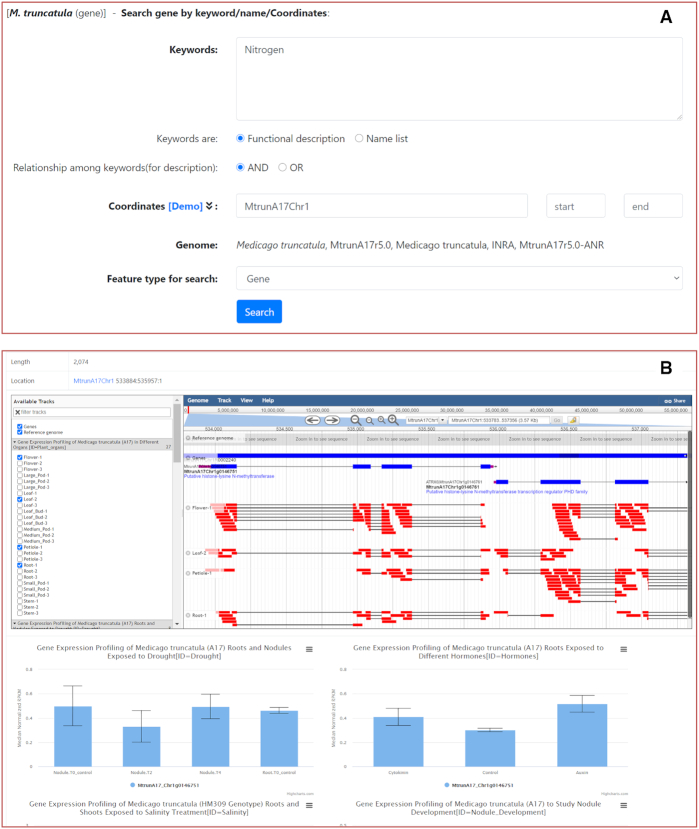
Screenshots of an example gene search interface and detailed result page. (A) Users can search any features, such as gene, transcript, CDS, or protein by keywords, accessions, or coordinates. (B) In the detailed result page, namely the gene card page, users can browse details of gene annotation, structure, RNA-seq read alignments on the reference genome, and bar charts of gene expressions for the predefined RNA-seq datasets.
LegumeIP provides an intuitive interface on the Family page, allowing users to search protein families by accessions or functional keywords of Panther, Homolog, GO and KO terms. Users can filter these families by the number of family members among species. The matched families are listed with links to the detail of family descriptions. In the detail page, the Panther family also include phylogenetic trees and tree model files in both Newick and PhyloXML formats.
Gene expression analysis functions
LegumeIP provides three expression analysis functions under the Expression menu: Expression Profile, Differential Expression and Co-expression. RNA-seq data are categorized into different experiments, conditions and samples as described above. The database provides similar step-by-step directions on the top of three functions (Figure 2A). For example, in the Expression Profile function, users first select experiments, then choose conditions and other options (such as samples) following the guidance. Users subsequently submit the selected RNA-seq dataset to the back-end pipeline for an on-the-fly normalization. The result page shows normalized gene expression values in a table and a line chart or bar chart (Figure 2B). The output also allows users to evaluate the quality of replicated samples through PCA analysis or search genes by their expression patterns.
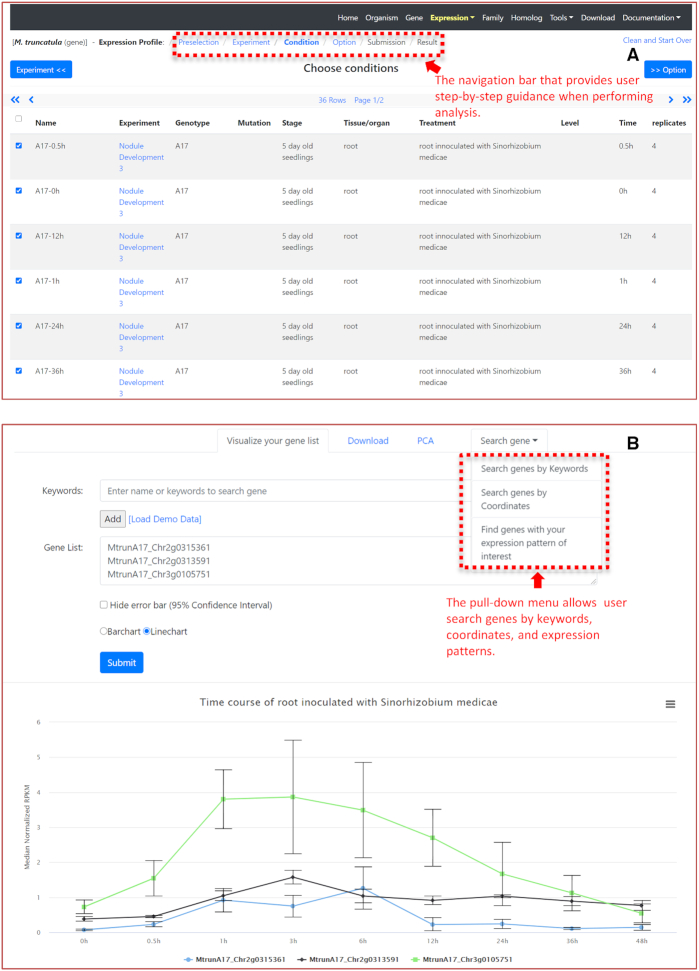
Search gene expression using the Expression Profile function. (A) Users may follow the step-by-step guide to select experiments, conditions and customize other options. (B) The returned Result page allows users to input gene accessions for their normalized expression value and bar/line chart visualization. Users can search genes by keywords, coordinates, and expression patterns. PCA analysis help users to exclude biological replicates with poor repeatability.
To reduce the workload of searching appropriate experiments and conditions from long RNA-seq data lists, we provide predefined datasets through human curation, focusing on the RNA-seq experiments with well-studied treatments and tissues, such as drought treatment, nitrogen-fixing endosymbiosis treatment, nitrogen and phosphorus nutrition deficiency treatment, and root and nodule development. These predefined datasets are readily available through the shortcut links in the right panel of the Home page or the entry page of the Expression Profile function. Users can directly browse the normalized expression values and search genes by expression patterns or keywords in its result pages.
The Differential Expression function allows users to perform DE analysis using DESeq2. Again, the step-by-step guidance helps users select experiment, numerator condition and denominator condition. After submission, the back-end pipeline reports the genes significantly differentially expressed between two conditions by adjusted P-values.
The Co-expression function was designed to identify and cluster genes with similar expression patterns over user-selected conditions. With the assistance of step-by-step guidance, users select experiments and conditions and customize the behavior of co-expression analysis in the Option step. The result page includes a list of gene modules in which all members show similar expression patterns over selected conditions. LegumeIP performs KEGG pathway and GO term enrichment analysis for member genes of each module. The analysis provides valuable biological insights about the mechanisms in which the co-expressed gene module is involved (Figure 3A). Users also can input gene accession of interest and find closely co-expressed genes. Under the Network Visualization tab, the co-expressed modules can be visualized with the embedded Cytoscape web plugin (Figure 3B) or downloaded as a JSON format file that can be opened in the Cytoscape desktop application for further analysis (25). The results, such as raw and normalized expression values, lists of differentially expressed or co-expressed genes from above three functions, are available for batch download.
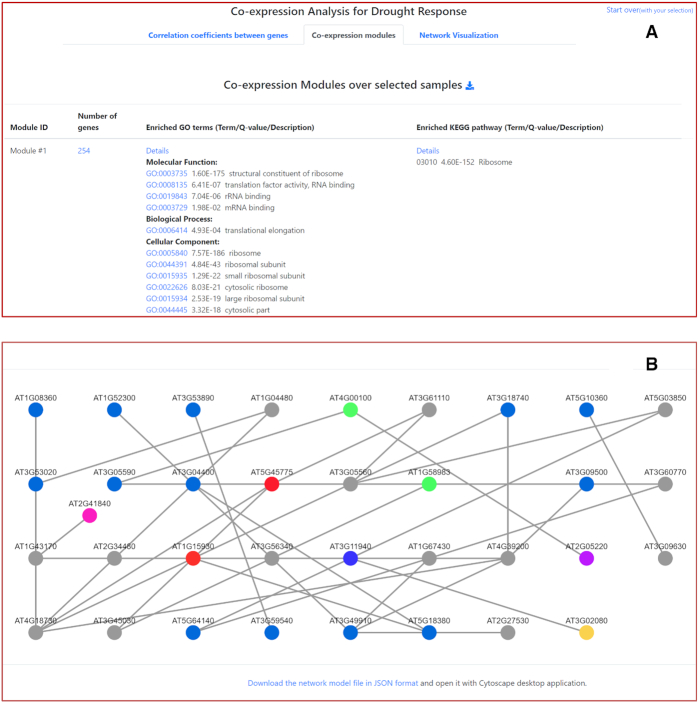
An example results page of co-expression analysis. (A) Users can cluster genes with similar expression patterns into modules, and further perform GO/KEGG enrichment analysis on these gene modules. (B) Users can also visualize the generated co-expression networks through the Cytoscape web plugin or Cytoscape desktop application software.
Other analysis tools
LegumeIP V3 provides a convenient analytic tool under the Homolog item of the top navigation bar, converting gene accessions between species if the genes (transcripts, proteins) share the same Panther or homolog family accessions page (Supplemental Figure S1). The database integrates KEGG pathway and GO term enrichment analysis under the Tools menu. Users may customize the number of top terms to be listed and the cutoff threshold for adjusted P-value, and then upload gene accessions for data analysis, which reports the significant KEGG pathways or GO terms, i.e. their adjusted P-values are less than the user-specified threshold. In addition, LegumeIP offers other valuable tools, including (1) gene model version tracing across versions of genome assemblies and annotations in gene synonyms mapping page, (2) NCBI BLAST tool, (3) Batch download for genome and annotation, and (4) sequence cutter tool allowing users to cut sequences by sequence accessions and coordinate and download the sequence fragments in batch.
DISCUSSIONS
With modest funding, it is possible to generate a high‐quality draft genome assembly for most species, including crop legumes. Most crop legumes' polyploid genomes present challenges in genome sequencing and annotation; scientists keep improving assembly quality using the latest genome assembly approaches. With this progress, however, researchers often must deal with multiple versions of gene models from the same organism. To overcome the issue, LegumeIP refers to each specific version of genome annotation in a species as a different reference genome. Therefore, gene models are associated with its genome at the reference genome level instead of at the species level. Such improvement distinguishes genome annotation versions from the same species and facilitates integrating new versions into the database in the future. Users can trace the gene models and the evolution of genome annotation versions through the gene synonyms mapping tool.
The database includes many search and analysis functions that can be combined and streamlined for complex analysis. For example, the Gene search or three expression analysis functions generate the list of genes, transcripts or proteins. In their result pages, there are links forwarding these accessions to such downstream analysis tools as pathway enrichment analysis, homolog search, gene synonyms mapping or sequence cut and retrieval.
LegumeIP V3 was redesigned to address the emerging challenge of discovering novel key genes that control important biological mechanisms or agronomic traits in less-studied non-model legume crops. The database enables translation of the knowledge of genes and pathways gained in model species to non-model species through a new homolog search tool. Figure 4 illustrates an example workflow that identifies drought response genes in non-model legume crop Phaseolus vulgaris (kidney bean), leveraging the RNA-seq data and prior knowledge from the model legume Glycine max (soybean). Users can flexibly combined and streamline the corresponding analysis tools and perform these analysis steps back and forth to generate the optimized results.
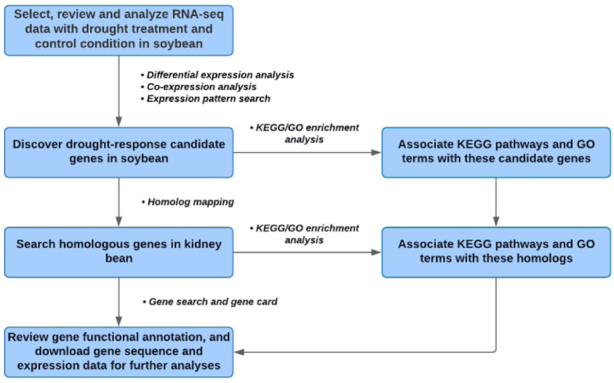
An example workflow identifies drought response genes in non-model legume crop Phaseolus vulgaris (kidney bean), leveraging the RNA-seq data and prior knowledge from the model legume Glycine max (soybean).
We plan to improve the database further to include single nucleotide polymorphism (SNP) markers linked with genes by coordinates and associated with agronomic traits through genome-wide association studies (GWAS). Also, we plan to develop on-the-fly syntenic mapping and visualization functions to provide users evolutionarily conserved relationships among genomic regions of user-specified species. We believe that these planned future enhancements will be valuable additions for identifying trait-associated key genes and genomic sequences in legume breeding programs.
CONCLUSION
The LegumeIP V3 hosts expanded genomics data from model to crop legumes. It was completely re-developed with rich analytical tools, making the integrative gene discovery platform resourceful and powerful for functional and translational genomics in legumes.
DATA AVAILABILITY
All genome sequence and annotation data are available for download under Download page of LegumeIP V3 website once user select corresponding species and genome annotation version. RNA-seq raw data can be downloaded from NCBI SRA database referring to its SRA identifier in RNA-seq experiment detail page under Expression section.
SUPPLEMENTARY DATA
Supplementary Data are available at NAR Online.
FUNDING
National Science Foundation [DBI-0960897, DBI-1458597 to P.X.Z.]; Noble Research Institute. Funding for open access charge: National Science Foundation [DBI-0960897, DBI-1458597 to P.X.Z.]; Noble Research Institute.
Conflict of interest statement. None declared.
REFERENCES
1.
2.
3.
5.
6.
7.
8.
9.
10.
11.
12.
13.
14.
15.
16.
17.
18.
19.
20.
21.
22.
23.
24.