 Plant-ImputeDB: an integrated multiple plant reference panel database for genotype imputation
Nucleic Acids Research


The authors wish it to be known that, in their opinion, the first three authors should be regarded as Joint First Authors.

- Altmetric
Genotype imputation is a process that estimates missing genotypes in terms of the haplotypes and genotypes in a reference panel. It can effectively increase the density of single nucleotide polymorphisms (SNPs), boost the power to identify genetic association and promote the combination of genetic studies. However, there has been a lack of high-quality reference panels for most plants, which greatly hinders the application of genotype imputation. Here, we developed Plant-ImputeDB (http://gong_lab.hzau.edu.cn/Plant_imputeDB/), a comprehensive database with reference panels of 12 plant species for online genotype imputation, SNP and block search and free download. By integrating genotype data and whole-genome resequencing data of plants from various studies and databases, the current Plant-ImputeDB provides high-quality reference panels of 12 plant species, including ∼69.9 million SNPs from 34 244 samples. It also provides an easy-to-use online tool with the option of two popular tools specifically designed for genotype imputation. In addition, Plant-ImputeDB accepts submissions of different types of genomic variations, and provides free and open access to all publicly available data in support of related research worldwide. In general, Plant-ImputeDB may serve as an important resource for plant genotype imputation and greatly facilitate the research on plant genetic research.
INTRODUCTION
Natural variation as a primary resource to study the genetic basis for phenotypic differences among different individuals of the same species, which mainly includes single nucleotide polymorphisms (SNPs) and genomic structural variations (1). In plants, SNPs are major variations widely used in genetic breeding and population evolution research (2–6). In recent years, with the development of sequencing and genotyping technologies, the cost of whole-genome resequencing (WGS) and genotyping has been declining (7), and large amounts of population genotype data from different species have been continuously released, facilitating the wide application of genetic linkage analysis or genome-wide association analysis (GWAS) in the research of different species (2–5). High-density markers of mass samples are conducive to increase statistical power, boost fine mapping of causal variants and facilitate the discovery of relationship between rare variants and traits (8,9). But due to the cost limitations, only a subset of SNPs is directly genotyped by SNP-chips or DNA sequencing in study samples (10). So, genotype imputation was developed to use the haplotypes and genotypes in a reference panel to estimate genotypes that not directly assayed in a sample of individuals and has been one of the key steps in preprocessing genetic data (10).
The basic idea of the genotype imputation methods is to explore and hunt for shared ‘identical by descend’ haplotypes that exhibit high linkage disequilibrium measured in r2 from a high-density typed reference panel of genotypes or haplotypes over a region of tightly linked markers, and use them to fill untyped SNPs (11). According to the idea, several imputation methods have been developed in recent years, such as Beagle (v5.1) (12) and Minimac3 (13) both based on common hidden Markov model framework (14,15), and Impute2 (16) based on a Markov chain Monte Carlo framework. Increasing evidence demonstrated the advantages of genotype imputation and it has become a standard step in GWAS and other genetic research because it is an economic and efficient way to acquire high-density population genotype data from SNP array, genotyping-by-sequencing (GBS) or reduced-representation sequencing commonly used in plant research (17,18). For example, it is clear that the probability of detecting the phenotype associated SNPs with genotype imputation (8.9%) is much greater than that without genotype imputation (5.4%) at the significance level of P < 10−6 in χ2 statistics, indicating that genotype imputation can greatly improve the power of GWAS (19). In an association analysis of the indica population, eight peaks for amylose content on chromosome 6 were detected using the imputed data, including the regions containing Wx and SSII, while three of these associations could not be detected using the original unimputed data (20). However, the challenges for genotype imputation methods will be in preparing large enough, diverse enough set of haplotypes available for constructing reference panel, and the imputation accuracy will decrease when new accessions that are not well-represented in the reference panel (21). In addition, it is still difficult to correctly impute rare variants under the current imputation framework and mainstream imputation methods (22). A high-quality reference panel is not only the essential prerequisite for genotype imputation but also play a crucial role for the imputation quality.
Benefit from the construction of large reference panel for genotype imputation and the development of genotype imputation methods, genotype imputation is widely used in human genetic studies (21,23–26). In human, the commonly used public reference panels mainly include International HapMap Project Phase3 (27), 1000 Genomes Project Phase 3 (1) and Haplotype Reference Consortium (28). International HapMap Project Phase3 comprises 1011 samples and 1.4 million variants (27); 1000 Genomes Project Phase 3 includes 81.7 million variants and 2504 samples of 26 populations (1); and Haplotype Reference Consortium integrates 20 studies to develop a human reference panel that includes 32 470 samples and 40.4 million variants (28). In animals, Animal-ImputeDB comprises 2565 samples of 13 species and over 400 million variants (29). Construction of these large reference panels makes it possible to acquire high-density genetic markers from low-density data, and untyped variants can be accurately imputed at low minor allele frequencies (MAFs), provided that they are first observed in the reference population (30). Recently, an imputation platform has been established for rice, which allows online genotype imputation (20). However, there has been no database that provides reference panels of multiple species for plant genotype imputation to the best of our knowledge.
With the increasing availability of massive genotype data in plants and mature tools, it is possible to construct a comprehensive database with multiple plant reference panels and online imputation tools. Here, we developed the Plant Imputation database (Plant-ImputeDB, http://gong_lab.hzau.edu.cn/Plant_imputeDB/), which comprises a collection of high-quality reference panels derived from publicly available plant genomic sequencing or genotype data, for the browsing, searching and downloading of reference panels and its related information. Through data curation, sample filtering, genotype calling and haplotype phasing, a total of 12 high-quality plant reference panels were finally built using 34 244 resequencing samples. The database includes the plants of arabidopsis, oilseed rape, common bean, cotton, cucumber, zucchini, maize, muskmelon, rice, soybean, watermelon and bread wheat. In addition, the database offers a user-friendly online tool with the option of two popular tools to support the genotype imputation.
DATA COLLECTION AND PROCESSING
Data collection
With the rapid development of sequencing technology in recent years, genomic datasets of a large number of species have been constantly released and updated. In order to include the representative species as many as possible, we collected the high-quality raw sequencing and SNP datasets of 12 species from widely studied plant databases such as 1001genomes (31) (https://www.1001genomes.org/), Rice SNP-seek database (32) (https://snp-seek.irri.org/), Maize HapMap (33) (https://www.panzea.org/), SoyBase (34) (https://soybase.org/snps/), 1000 wheat exomes project (http://wheatgenomics.plantpath.ksu.edu/1000EC/) (35) and Cucurbit Genomics Database (36) (http://www.cucurbitgenomics.org/), as well as the original sequencing data published in recent years (37–39).
For 10 of 12 species, raw genotype files (VCF format) were downloaded from database or research. Among them, samples of five species (arabidopsis, common bean, maize and watermelon) were genotyped using WGS (31–33,37,40); samples of three species (cucumber, muskmelon and zucchini) were genotyped with high-throughput GBS (36,41); for bread wheat, samples were genotyped using exome capture sequencing technology (35); for soybean, samples were genotyped with SoySNP50K Illumina Infinium II BeadChip (34). For the other two species, oilseed rape and cotton, the raw sequencing datasets were downloaded from the NCBI database under accession SRP155312 and SRP115740, respectively (38,39).
Detailed information of the species, such as NCBI taxonomy ID, assembly version and SNP number, is presented in Table 1. The data sources, genotyping methods and population summaries of 12 species are presented in Supplementary Table S1.

| Reference panel | |||||
|---|---|---|---|---|---|
| Species | NCBI taxonomy ID | Assembly version | Number of chromosomes | Number of samples | Number of SNPs |
| Arabidopsis thaliana(Arabidopsis) | 3702 | TAIR10 | 5 | 2029 | 2 963 242 |
| Brassica napus (Oilseed rape) | 3708 | ZS11 v0 | 19 | 991 | 9 141 089 |
| Phaseolus vulgaris (Common bean) | 3885 | PhaVulg1_0 | 11 | 628 | 4 811 097 |
| Gossypium hirsutum (Cotton) | 3635 | TM-1 UTX_v2.0 | 26 | 686 | 3 149 846 |
| Cucumis sativus (Cucumber) | 3659 | Cucumber (Gy14) v2 | 7 | 1234 | 21 154 |
| Cucurbita pepo (Zucchini) | 3664 | Cucurbita pepo v4.1 | 20 | 830 | 41 888 |
| Zea mays (Maize) | 4577 | AGPv3 | 10 | 1210 | 35 073 758 |
| Cucumis melo (Muskmelon) | 3656 | Melon (DHL92) v3.5.1 | 12 | 2084 | 26 011 |
| Oryza sativa Japonica (Rice) | 39 947 | IRGSP-1.0 | 12 | 3240 | 4 897 277 |
| Glycine max (Soybean) | 3847 | Wm82.a2 | 20 | 20 087 | 39 636 |
| Citrullus lanatus (Watermelon) | 3654 | Watermelon (97103) v2 | 11 | 414 | 8 816 591 |
| Triticum aestivum (Bread wheat) | 4565 | IWGSC v1.0 | 21 | 811 | 942 041 |
Data processing
With the raw sequencing data, high-quality SNPs were identified using the Sentieon pipeline (42). First, the raw reads were mapped to the current standard reference genome by the Burrows–Wheeler Alignment mem algorithm (43), and then the BAM files of reads with quality greater than 10 were retained by SAMtools (44). Alignment summary, GC bias, base quality by sequencing cycle, base quality score distribution and insert size metrics were collected, and the duplicate reads were removed with the Sentieon driver. Then, the indels were realigned, and the base quality was recalibrated using the Sentieon driver. The SNP data of each sample were identified using Sentieon's Haplotyper algorithm. Then, the variant data of all samples were merged into VCF files using Sentieon GVCFtyper algorithm. The raw SNPs of all samples were filtered using the GATK VariantFiltration module with the parameter –filterExpression ‘QUAL < 30.0 || MQ < 50.0 || QD < 2’ –clusterSize 3 –clusterWindowSize 10. Subsequently, the SNPs with a call rate < 0.5 or an MAF < 0.01 were removed. Finally, all the high-quality SNPs that had passed the filtering were used to construct the reference panel (Figure 1). The detailed statistics of the genetic variants and sample data of each species in the final dataset are listed in Table 1. In addition, the genomic blocks of each species were also identified using Plink with the parameter –blocks (45).

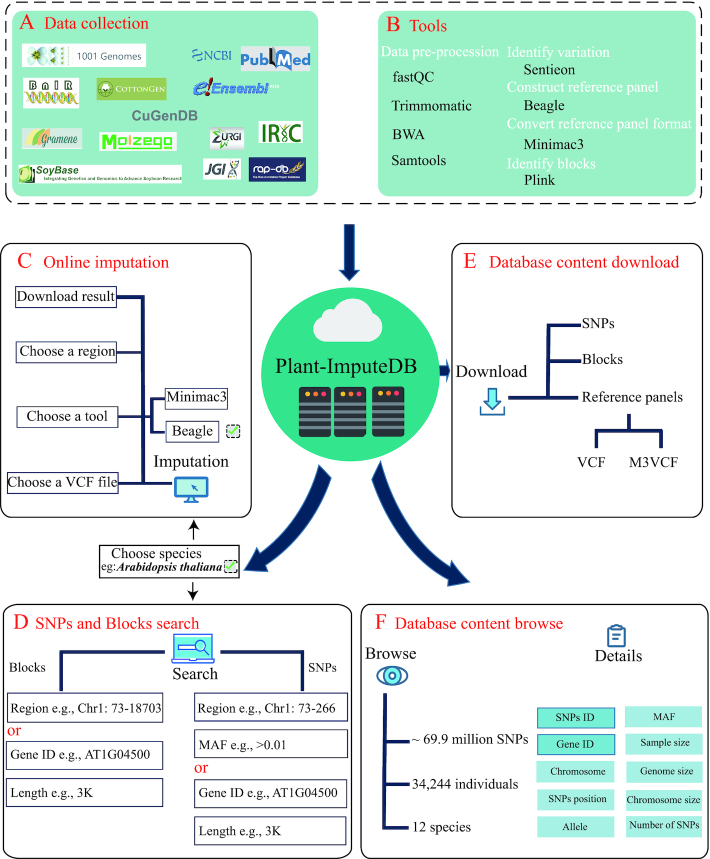
Construction of plant reference panels in Plant-ImputeDB. (A) Data collection. (B) Data processing. (C–F) Database content and web interface.
Reference panel construction
Beagle, Minimac3 and Impute2 are the most popular tools for genotype imputation. A comparison among the three tools shows that despite of the similarity in accuracy, they vary greatly in memory requirements and computation time. Beagle and Minimac3 are superior to Impute2 in computation time and memory efficiency (46), and support the genotype imputation of polyploid plants (47). Therefore, Beagle and Minimac3 were chosen for the construction of reference panels in this study. The reference panels of 12 species were constructed by Beagle using clean SNP data (MAF > 0.01, call rate > 0.5) with the default parameters, and then converted from VCF to M3VCF format by Minimac3.
Evaluation of the reference haplotype libraries
Reliable haplotypes are important for genotype phasing and imputation (48). Therefore, we followed the method of Marchini, J. et al. and applied switch accuracy as an index to evaluate the reliability of haplotypes (49). For simulating haplotype blocks, we referred to the method of Osabe, D. et al. (50). Firstly, we randomly selected 100 contiguous haplotype blocks, and all the SNPs located in them were extracted for the evaluation. Then, 100 genotyping datasets with the same population size were selected by re-sampling with replacement from original samples in reference panels. Their haplotype blocks were identified using Plink (45). The switch accuracies were obtained based on the simulation data. The average switch accuracies of the 12 species ranged from 0.92 for maize to 0.99 for watermelon, indicating the reliability of the haplotypes in our panels (Supplementary Figure S1). In addition, we calculated haplotype blocks and frequency in each species and summarized the block sizes and SNP numbers in blocks (Supplementary Table S2).
Imputation accuracy using reference panels in Plant-ImputeDB
Performance of the reference panels and imputation process were evaluated based on three strategies. First, we calculated the imputation accuracy of all species using a 5-fold cross-validation strategy. For each species, all the samples in the reference panel were randomly divided into five folds, with one fold being selected as the study population, and the remaining folds being used as the reference panels for each time. Since most commercial SNP arrays of plants contain about 50–100 k probes (51), we randomly selected 100 000 SNPs from the whole genome of the study population and masked other SNPs. Considering that four species had a relatively small number of SNPs (≤100 000), we randomly selected 5000 SNPs from the whole genome for these four species (Table 1). Then, Beagle and Minimac3 were used to impute the genotypes with the default parameters.
In this way, both the true and imputed genotypes were obtained, and the imputed SNPs with MAF ≥ 0.01 and estimated squared correlation ≥ 0.3 were retained as properly imputed variants and used for the following evaluation. The concordance rate (CR) and the squared correlation (R2) were used to validate the accuracy of the imputation. CR was calculated through dividing the number of correctly imputed genotypes by the total number of imputed genotypes per species, and R2 was the squared correlation between true and imputed genotypes. The mean of CR or R2 across five folds was taken as the accuracy of the imputation for each species, and the results are summarized in Table 2. Moreover, the corresponding boxplots are shown in Supplementary Figure S2. The number of SNPs increased by an average 34.47 folds in the study population after imputation. The average CR for all test species was greater than 0.88. The average R2 of Beagle ranged from 0.76 for melon to 0.96 for cotton, and that of Minimac3 ranged from 0.76 for melon to 0.97 for common bean.
| Beagle imputation results | Minimac3 imputation results | |||||||
|---|---|---|---|---|---|---|---|---|
| Number of imputed SNP (mean ± SD) | Increased fold | CR (mean ± SD) | R2 (mean ± SD) | Number of imputed SNPs (mean ± SD) | Increased fold | CR (mean ± SD) | R2 (mean ± SD) | |
| Arabidopsis | 2 792 659 ± 5127 | 27.93 | 0.9906 ± 0.0002 | 0.9411 ± 0.0014 | 2 884 385 ± 5631 | 28.84 | 0.9912 ± 0.0002 | 0.9448 ± 0.0010 |
| Oilseed rape | 4 604 327 ± 69 131 | 46.04 | 0.8857 ± 0.0016 | 0.7717 ± 0.0037 | 1 412 928 ± 58 660 | 14.31 | 0.9286 ± 0.0022 | 0.8135 ± 0.0023 |
| Common bean | 3 289 257 ± 13 766 | 32.89 | 0.9584 ± 0.0012 | 0.8973 ± 0.0017 | 4 152 965 ± 76 476 | 41.53 | 0.9798 ± 0.0017 | 0.9717 ± 0.0018 |
| Cotton | 2 927 154 ± 76 601 | 29.27 | 0.9810 ± 0.0032 | 0.9615 ± 0.0057 | 2 935 382 ± 751 456 | 29.35 | 0.9848 ± 0.0084 | 0.9588 ± 0.0095 |
| Maize | 21 336 638 ± 142 290 | 213.37 | 0.9396 ± 0.0017 | 0.7996 ± 0.0069 | 7 827 635 ± 266 095 | 78.28 | 0.9502 ± 0.0015 | 0.8363 ± 0.0077 |
| Rice | 4 996 975 ± 1960 | 49.97 | 0.9538 ± 0.0009 | 0.9416 ± 0.0011 | 3 570 124 ± 64 495 | 35.70 | 0.9655 ± 0.0010 | 0.9420 ± 0.0016 |
| Watermelon | 8 058 314 ± 510 335 | 80.58 | 0.9861 ± 0.0040 | 0.8675 ± 0.0398 | 7 628 587 ± 468 864 | 76.29 | 0.9903 ± 0.0032 | 0.9102 ± 0.0375 |
| Bread wheat | 496 703 ± 121 523 | 4.97 | 0.9890 ± 0.0019 | 0.9534 ± 0.0036 | 580 923 ± 129 173 | 5.81 | 0.9878 ± 0.0019 | 0.9560 ± 0.0034 |
| Cucumber | 6090 ± 59 | 1.52 | 0.9332 ± 0.0021 | 0.8099 ± 0.0045 | 13 350 ± 193 | 3.34 | 0.9413 ± 0.0010 | 0.8210 ± 0.0066 |
| Zucchini | 17 729 ± 326 | 3.55 | 0.9081 ± 0.0027 | 0.7588 ± 0.0025 | 27 853 ± 458 | 5.57 | 0.9171 ± 0.0026 | 0.7712 ± 0.0030 |
| Muskmelon | 6856 ± 48 | 1.37 | 0.9043 ± 0.0007 | 0.7582 ± 0.0030 | 10 387 ± 86 | 2.08 | 0.9277 ± 0.0003 | 0.7602 ± 0.0014 |
| Soybean | 33 808 ± 15 | 6.76 | 0.9697 ± 0.0008 | 0.9099 ± 0.0024 | 39 453 ± 37 | 7.89 | 0.9788 ± 0.0007 | 0.9419 ± 0.0023 |
CR: concordance rate between true and imputed genotypes.
R2: squared correlation between true and imputed genotypes.
In addition, imputation accuracies with the reference panels were assessed using simulated datasets with different densities and independent datasets respectively. First, as for 12 species in our database, we randomly selected 100 samples with 10 different percentages of masked SNPs from 50 to 95% following the simulation method of Friedrich, J. et al. (52). Imputation accuracy was calculated by comparing imputation results and raw genotypes. As for two imputation tools Beagle and Minimac3, the average accuracy of all simulation datasets ranged from 0.83 to 0.99 (Supplementary Figures S3 and 4). Second, nine independent validation sets for the corresponding species in our database, including rice (53), arabidopsis (54), maize (Maize 282) (55), oilseed rape (56), cotton (57), soybean (58), cucumber (59), muskmelon (60) and bread wheat (61) were collected for assessment of imputation accuracy. These raw sequencing datasets were processed following the same Sentieon pipeline and parameters, and the missing genotypes were imputed by Beagle with default parameters. Then, the common SNPs in independent populations and our reference panels were retained to validate imputation accuracy. The validation datasets were constructed with 10 different percentages of masked SNPs from 50 to 95%. Finally, these independent datasets were imputed using Beagle and Minimac3 with default the parameters respectively. Imputation accuracies were achieved with the true and imputed genotypes. Similarly, the average accuracy ranged from 0.77 to 0.99, and the detailed results are interpreted in Supplementary Figures S5 and 6. All of these validation results indicate that the reference panels and the imputation tools can be used for genotype imputation from different population with relatively high accuracy.
IMPLEMENTATION
Plant-ImputeDB (http://gong_lab.hzau.edu.cn/Plant_imputeDB/) was built based on the Flask (version 1.1.1) framework with AngularJS (version 1.6.1) as the JavaScript library, and runs on the Apache 2 web server (version 2.4.18) with MongoDB (version 3.4.2) as its database engine. The database is available online without registration and optimized for Chrome (recommended), Internet Explorer, Opera, Firefox, Windows Edge and macOS Safari.
DATABASE CONTENT AND THE WEB INTERFACE
Samples of 12 species in Plant-ImputeDB
The current version of Plant-ImputeDB contains a total of ∼69.9 million SNPs from 12 species covering 34 244 individuals. The detailed statistics of the number of samples per species, the number of chromosomes, genome version, NCBI taxonomy ID and the number of SNPs are displayed and maintained online at the home page of Plant-ImputeDB and summarized in Table 1. Besides, the basic introduction, genome size and chromosome number of each species are presented in the ‘Species information’ module, and users can access to this module by clicking the plant photo on the ‘Home’. The detailed sample information of each species is provided in the ‘Sample information’ module. The introduction of samples, population structure and the list of accessions are provided. In addition, we have provided two advanced search boxes for different species. The users can browse the information of accessions for each species according to the sub-population or country and obtain the specific accession of interest. Finally, the sample information, including the PubMed ID, publication journal, publication year of the article, the sample number, material, technology, platform, data type and coverage of the sequencing of the project, was listed as supplemental information (Supplementary Table S1).
Web interface
A user-friendly web interface for Plant-ImputeDB was constructed, and users can access to three main modules, including Module1: ‘Imputation’ for online genotype imputation, Module2: ‘Reference Panel’ for SNP and block search based on genomic region information or gene ID, and sample information of the reference panels, and Module3: ‘Download’ for reference panel download in two formats (VCF and M3VCF). Specifically, users can access to the three modules by clicking the corresponding buttons in the navigation menu on the ‘Home’ page or by clicking the corresponding plant photo (Figure 2A). These modules provide species information as well as realize online genotype imputation, SNP search, and genomic block search (Figure 2B–E). Plant-ImputeDB provides detailed supporting documentation on the ‘Help’ page, and is open to any feedback with email address listed on the ‘Contact’ page.
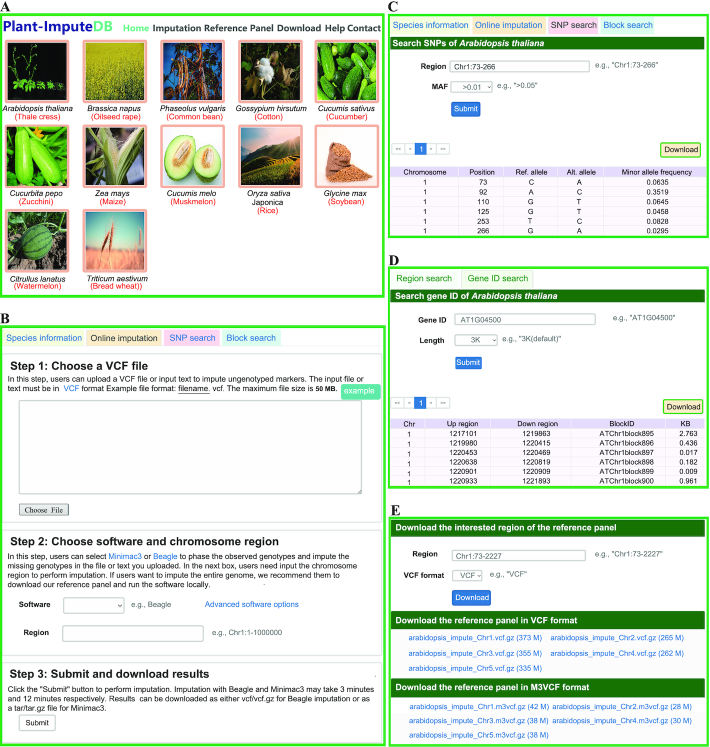
Overview of the Plant-ImputeDB database. (A) Main modules in Plant-ImputeDB, including ‘Imputation’, ‘Reference Panel’ and ‘Download’ modules. (B) Online genotype imputation in the Plant-ImputeDB database. (C) Browsing of SNPs based on genomic region. (D) Browsing of genomic blocks based on gene ID. (E) ‘Download’ function of Plant-ImputeDB.
Online genotype imputation in Plant-ImputeDB
Plant-ImputeDB supports two popular imputation tools (Beagle and Minimac3). The users can access the ‘Imputation’ module by either clicking ‘Imputation’ in the ‘Home’ page navigation menu or clicking the hyperlink in the corresponding species photo on the ‘Home’ page. Then, the genotype data of normal VCF format are entered into the text box or uploaded directly through the ‘Choose File’ button. Besides, an example of genotype data in the VCF format is provided and can be accessed by clicking the ‘Example’ button above the input box. After uploading of the candidate genotype data, users should select one of the two tools, enter the chromosome region and click the ‘Submit’ button to finish the query (Figure 2B).
Searching and browsing of SNPs and genomic blocks in Plant-ImputeDB
The ‘Reference Panel’ module provides an advanced search box for different species, and users can search and browse SNPs based on the genomic region or gene ID. SNPs can be browsed by inputting the specific chromosomal region (e.g. Chr1:73–266) and MAF (e.g. >0.01). In addition, users can also input the gene ID (e.g. AT1G04500) and choose different lengths of upstream and downstream regions (e.g. 3K) to search for SNPs. Fuzzy queries are applied in the search procedure, and the query results are displayed in a table with the basic SNP information, including the chromosome position, allele and MAF. For example, when users select ‘A. thaliana’ and enter ‘Chr1:73–266 in the ‘Region’ box, the query results will be returned as shown in Figure 2C. The returned tables can be sorted by clicking a specific column header. In addition, the query results can be exported as a tab-separated file and saved by clicking the ‘Download’ button.
Similarly, Plant-ImputeDB also supports the searching and browsing of genomic blocks based on genomic region or gene ID. The query results are displayed in a table with the basic genomic block information, including the chromosome, upstream region, downstream region, block ID and the length of block region. For example, when users select ‘A. thaliana’ and enter ‘AT1G04500’ in the ‘Gene ID’ box, the query results will be returned as shown in Figure 2D. The returned tables can be sorted by clicking a specific column header. In addition, the query results can also be exported as a tab-separated file and saved by clicking the ‘Download’ button.
Free download of reference panels in Plant-ImputeDB
The reference panels for 12 species are publicly available on the ‘Download’ page of Plant-ImputeDB (Figure 2E). Users can enter the genomic region of interest in the ‘Region’ box to obtain the corresponding VCF file. In addition, users can also download the reference panels of different chromosomes and carry out genotype imputation on the local server for GWAS or meta-GWAS analysis. These 12 reference panels support both VCF and M3VCF file formats (text and binary). Thus, users can download a reference panel in either VCF format or M3VCF format according to their own tool requirements. The database provides a total of ∼538 G data for users to download.
SUMMARY AND FUTURE DIRECTIONS
Recent decades have witnessed rapid progress in plant genetic research. Some plant-related databases including PMDBase (62) and PlantTFDB (63) have been widely used in plant research. However, they are mostly related to plant transcription factors and microsatellite DNA. Reference panels play an important role in genotype imputation for plant genetic research and breeding programs. In animal studies, Animal-ImputeDB (29) is a database that integrates high-quality reference panels from 13 species, while there is no high-quality reference panel database for plant genotype imputation. Therefore, we developed the Plant-ImputeDB database by collecting publicly available data, constructing reference panels of 12 selected species and offering an easy-to-use online genotype imputation tool with the option of two popular tools. Different from the existing related databases, Plant-ImputeDB is characterized by the comprehensive integration of genotype data for a wide range of species and supports two ways of search for SNPs and genomic blocks. It accepts submissions of plant genotype data, and provides free open access to all publicly available data to support the related research all over the world. Moreover, it is equipped with friendly web interfaces for data browse, search, imputation and download. Taken together, Plant-ImputeDB may achieve the archiving of plant genotype data at a global scale, and help the full capture of population genetic diversity and a better understanding of the complex mechanisms associated with different phenotypes.
It can be expected that the advancement of the next-generation sequencing technology and imputation algorithms will greatly facilitate the wide applications of genotype imputation. With the continually collecting available data in the field of plant population studies, we will update the database annually by incorporating more reference panels of new species (e.g. tomato, sorghum, foxtail millet, etc.) and increasing the number of representative accessions for existing species. Overall, we will maintain Plant-ImputeDB as an informative and valuable resource for plant genetic research.
SUPPLEMENTARY DATA
Supplementary Data are available at NAR Online.
FUNDING
Fundamental Research Funds for the Central University (Huazhong Agricultural University) [2662018PY068 to Q.Y.Y.]; National Key Research and Development Plan, China [2017YFE0104800 to Q.Y.Y.]; Huazhong Agricultural University Scientific & Technological Self - innovation Foundation [11041810351 to J.G.]. Funding for open access charge: Huazhong Agricultural University Scientific & Technological Self - innovation Foundation [11041810351].
Conflict of interest statement. None declared.
REFERENCES
1.
2.
3.
4.
5.
6.
7.
8.
9.
10.
11.
12.
13.
14.
15.
16.
17.
18.
20.
21.
22.
23.
24.
25.
26.
27.
28.
29.
30.
31.
32.
33.
34.
35.
36.
37.
38.
39.
40.
41.
42.
43.
44.
45.
46.
47.
48.
49.
50.
51.
52.
53.
54.
55.
56.
57.
58.
59.
60.
61.
62.