 MeDAS: a Metazoan Developmental Alternative Splicing database
Nucleic Acids Research


The authors wish it to be known that, in their opinion, the first three authors should be regarded as joint First Authors.

- Altmetric
Alternative splicing is widespread throughout eukaryotic genomes and greatly increases transcriptomic diversity. Many alternative isoforms have functional roles in developmental processes and are precisely temporally regulated. To facilitate the study of alternative splicing in a developmental context, we created MeDAS, a Metazoan Developmental Alternative Splicing database. MeDAS is an added-value resource that re-analyses publicly archived RNA-seq libraries to provide quantitative data on alternative splicing events as they vary across the time course of development. It has broad temporal and taxonomic scope and is intended to assist the user in identifying trends in alternative splicing throughout development. To create MeDAS, we re-analysed a curated set of 2232 Illumina polyA+ RNA-seq libraries that chart detailed time courses of embryonic and post-natal development across 18 species with a taxonomic range spanning the major metazoan lineages from Caenorhabditis elegans to human. MeDAS is freely available at https://das.chenlulab.com both as raw data tables and as an interactive browser allowing searches by species, tissue, or genomic feature (gene, transcript or exon ID and sequence). Results will provide details on alternative splicing events identified for the queried feature and can be visualised at the gene-, transcript- and exon-level as time courses of expression and inclusion levels, respectively.
INTRODUCTION
Alternative splicing, whereby multiple distinct functional transcripts are produced from a single gene, is a widespread process present in most eukaryotic genomes (1). Alternative splicing increases transcriptomic diversity and is an important mechanism of functional innovation (see (2–4) for reviews) that may underlie changes in organismal complexity over evolutionary time (5,6), morphological differentiation (7), and speciation (8). Many alternatively spliced isoforms have restricted transcriptional profiles, for instance being sex- (9–11), tissue- (12,13) or cell type-specific (14–16). Numerous studies have highlighted the critical role alternative splicing plays in developmental processes (see reviews (17,18)). Accordingly, many alternative isoforms are also precisely temporally regulated (19) and so would only be found within particular developmental stages (as demonstrated, for example, in pre-implantation embryos, where the division between stages is a matter of hours (20)).
To facilitate the study of alternative splicing in a developmental context, here we present MeDAS, a Metazoan Developmental Alternative Splicing database. MeDAS is an added-value database presenting quantitative data on alternative splicing events as they vary across developmental stages. MeDAS was constructed by re-analysing a curated set of 2232 Illumina polyA+ RNA-seq libraries that chart detailed time courses of embryonic and post-natal development across 18 species with a broad taxonomic range spanning the major metazoan lineages from Caenorhabditis elegans to human.
There are several alternative splicing databases available, although these typically represent either the in-depth functional characterization of a small number of model species or are otherwise more specialised in scope, primarily concerned with specific splicing event types or tissues. Databases in the first category include APPRIS (21), which annotates the principal spliced isoforms of vertebrates, fly and worm, and VastDB (22), which offers detailed profiling of human, mouse, and chicken genes across multiple cell and tissue types. More specialized databases include FasterDB (23,24), which focuses on splicing events as they relate to the phenotypic plasticity of cancer cells, and HEXEvent (25) and ExonSkipDB (26), both of which are dedicated solely to human exon-skipping events, with the latter further specialising in cancer tissues.
MeDAS is structured around the temporal aspects of alternative splicing and is freely available at https://das.chenlulab.com with an interface that allows searches by species, tissue and feature (gene, transcript, or exon ID and sequence). Results will provide details on alternative splicing events identified in the queried region and can be visualised at the gene-, transcript- and exon-level as time courses of expression level and inclusion level, respectively.
MATERIALS AND METHODS
Database creation and content
MeDAS currently comprises data on alternative splicing events for 18 species, each sampled from nine to 24 distinct developmental stages (Supplementary Table S1). For each species, developmental stage and individual library, MeDAS provides a genome-wide survey of alternative splicing events in the form of exon inclusion estimates for every internal exon of each multi-exonic gene. To allow the user to identify significant variability and temporal trends in alternative exon usage along with development, MeDAS provides Spearman's correlation coefficients for each exon's percent spliced-in (PSI) value—a measure of its level of inclusion—with the temporal rank order of developmental stages per tissue. We also provide the Kruskal-Wallis statistic of the PSI distribution as it varies among discrete developmental stages, and stage specificity index Tau (27). The contents of MeDAS are described in Table 1, in the form of an annotated example entry for Kdm1a, an exon which is precisely temporally regulated and functionally associated with neurite outgrowth (19).

| Col No. | Col name | Example | Description |
|---|---|---|---|
| 1 | GeneID | ENSMUSG00000036940 | Reference annotation gene ID, commonly Ensembl. |
| 2 | GeneSymbol | Kdm1a | HGNC gene symbol, if available, otherwise ‘NA’. |
| 3 | Chr | 4 | Reference genome chromosome name. |
| 4 | GeneStart | 136550540 | First position of the gene (1-based). |
| 5 | GeneEnd | 136602723 | Last position of the gene (1-based). |
| 6 | Strand | - | Given as + or − |
| 7 | Biotype | protein_coding | Gene biotype. |
| 8 | ExPartName | ENSMUSG00000036940:017 | Name of the exon part. Takes the format ‘gene_id:rank’, where ‘rank’ is the order in which this exon part appears in the gene, based on its start coordinate. ‘Exon parts’ are subsets of exonic regions defined according to their overlap among isoforms and act as counting bins for the PSI calculation (see Figure 1). |
| 9 | ExPartStart | 136563438 | First position of the exon part (1-based). |
| 10 | ExPartEnd | 136563449 | Last position of the exon part (1-based). |
| 11 | ExPartLen | 12 | Length of exon part, in nucleotides. |
| 12 | ASlvl | alternatively spliced | Categorical description of the extent to which this exon part is alternatively spliced, based on data across all samples. Takes one of four values: ‘not expressed’ (no PSI data available), ‘low inclusion’ (PSI < 5), ‘alternatively spliced’ (5 ≤ PSI ≤ 95), or ‘constitutive’ (PSI > 95). |
| 13 | AStype | SE | SUPPA2 classification of each splicing event. Can be one or more of exon skipping (ES), intron retention (RI), alternative 5’ splice site (A5), alternative 3’ splice site (A3), mutually exclusive exons (MX), alternative first exon (AF), and alternative last exon (AL). |
| 14 | MatchExID | ENSMUSE00001017339 | Reference annotation exon ID, given only if an exon in the reference annotation exactly matches the coordinates of this exon part, else ‘NA’. To restrict MeDAS only to discrete exons, filter on this column to remove all ‘NA’ entries. If doing so, each ‘exon part’ will be a specific exon. |
| 15 | CoveredByExID | ENSMUSE00001017339 | All reference annotation exon IDs whose coordinates are contained this exon part. |
| 16 | CoveredByTx | ENSMUST00000170979 | All reference annotation transcript IDs whose coordinates cover this exon part. |
| 17 | Species | MusMus | Binomial species name, reported with three-letter abbreviations. |
| 18 | Tissue | Forebrain | Cell or tissue sampled which may, if not specific, be reported as ‘whole organism’. |
| 19 | PctZeroCov | 0.00% | Percentage of samples across all developmental stages of this tissue that have 0 coverage across this exon part, i.e. no inclusion and no exclusion reads. |
| 20 | Spearman.cor | 0.8105 | Correlation of this exon part's set of PSI values with the rank order of developmental stages of this tissue. Reported as Spearman's rho and interpreted to identify trends in (alternative) exon usage across the temporal range of samples. Calculated only if PctZeroCov ≤ 30. |
| 21 | Spearman.p | 6.50E−14 | P-value for the above correlation. Significant P-values imply this exon may be differentially regulated throughout the course of development of this tissue. |
| 22 | KW.p | 1.49E−06 | P-value for a Kruskal-Wallis test of (continuous) PSI values as they differ across (categorical) developmental stages. If a splicing event is developmentally-associated, its PSI will likely vary between one or more stages, although we have no prior expectation of which stage(s), or in which direction PSI will differ. The Kruskal−Wallis tests the null that PSI estimates are drawn from the same continuous distribution. A rejection of that null suggests this exon may be differentially spliced at some point in the developmental time course. Calculated only if PctZeroCov ≤ 30. |
| 23 | KW.padj | 3.06E-04 | Adjusted P-value (Benjamini & Hochberg) for the above KW test. |
| 24 | Tau | 0.50 | Stage specificity index of mean PSI as it varies across the time course of development for all tissues of this species. Bound between 0 (ubiquitously expressed, i.e. in every developmental stage) and 1 (stage-specific). Calculated as in Yanai, et al. (2005). |
| D: 1 | Stage | P 3 days | Developmental stage, briefly summarised. |
| D: 2 | TotalSamples | 4 | Number of samples (RNA-seq libraries) available for this species, tissue and stage. |
| D: 3 | InclReadsMin | 44 | Minimum number of inclusion reads across all samples of this tissue and stage, i.e. those overlapping this exon part and supporting its inclusion in a transcript. |
| D: 4 | InclReadsMean | 85.75 | Mean number of inclusion reads across all samples of this tissue and stage. |
| D: 5 | InclReadsMax | 127 | Maximum number of inclusion reads across all samples of this tissue and stage. |
| D: 6 | InclReadsSD | 36.62 | Standard deviation of the number of inclusion reads. |
| D: 7 | ExclReadsMin | 18 | Minimum number of exclusion reads across all samples of this tissue and stage, i.e. those deriving from split alignments and thereby originating from transcripts which do not contain this exon part. |
| D: 8 | ExclReadsMean | 25 | Mean number of exclusion reads across all samples of this tissue and stage. |
| D: 9 | ExclReadsMax | 35 | Maximum number of exclusion reads across all samples of this tissue and stage. |
| D: 10 | ExclReadsSD | 7.44 | Standard deviation of the number of exclusion reads. |
| D: 11 | PSImin | 68.48 | Minimum inclusion ratio of this exon part, reported as the percent of transcripts in which it is spliced-in (PSI) across all samples of this issue and stage. Calculated using length-normalised counts of inclusion and exclusion reads, as detailed in Schafer, et al. (2015). |
| D: 12 | PSImean | 74.3 | Mean PSI of this exon part across all samples of this tissue and stage. |
| D: 13 | PSImax | 77.88 | Maximum PSI of this exon part across all samples of this tissue and stage. |
| D: 14 | PSIsd | 4.12 | Standard deviation of PSI across all samples of this tissue and stage. |
The alternative splicing events in MeDAS were identified by analysing a curated set of 2232 RNA-seq libraries (detailed in Supplementary Table S2), all sourced from the NCBI Sequence Read Archive (28). For inclusion into MeDAS, we required all libraries to be polyA+ enriched, in order to analyse fully spliced mature RNAs, and to be sequenced using an Illumina platform at a minimum read length of 50 bp (2126 libraries, 95% of the total, were sequenced with average read lengths of 100 or 101 bp, and 2181 libraries, 97% of the total, were sequenced using either an Illumina HiSeq 2000 or HiSeq 2500). We also selected only those species associated with a BioProject comprising multiple developmental stages (ranging from nine in chicken to 24 in human). Specifically, MeDAS contains data from whole organism RNA-seq libraries for eight chordates: the anole lizard (29), Ciona intestinalis (30), two species of amphioxus (Branchiostoma floridae (30) and Branchiostoma lanceolatum (31)), two species of frog (Xenopus laevis (30) and Xenopus tropicalis (30)), turtle (30) and zebrafish (30); six of these species were sequenced by the EXPANDE (EXpression Profiling AloNg Development and Evolution) consortium (30). MeDAS also contains data from seven major organs (forebrain, hindbrain, heart, liver, kidney, testis and ovary) in developmental stages spanning from organogenesis to (where possible) adulthood in seven other chordates (chicken, human, macaque, mouse, possum, rat and rabbit) (32). Note that for early embryonic stages comprising few cells, replicates in the original studies often represent pooled samples from multiple individuals. Libraries with multiple biological replicates per tissue and developmental stage were used for most species except C. elegans (33), the fruitfly (33), and the sea urchin (34), where replicates were not available. These three non-chordates were added to ensure a more comprehensive taxonomic coverage of metazoans. The specific developmental stages covered by MeDAS are summarised in Supplementary Table S3.
Developmentally-associated gene expression, isoform abundance and alternative splicing events
All RNA-seq libraries were processed for alternative splicing event identification and quantification using standard pipelines (Figure 1). All scripts are available at https://github.com/LuChenLab/MeDAS and can be applied to other datasets and species. Briefly, low-quality reads were trimmed using Trimmomatic v0.38 (35) with parameters ILLUMINACLIP:adapters.fa:2:30:10 LEADING:3 TRAILING:3 SLIDINGWINDOW:4:15 MINLEN:25. Trimmed reads were aligned to their respective reference genomes (Supplementary Table S1) using STAR v2.6.1a (36) with default parameters plus –quantMode TranscriptomeSAM, with the resulting BAM files input into RSEM v1.3.1 (37) to quantify gene expression and isoform abundance both as raw counts and as transcripts per million (TPM). When not otherwise available from the experimental information, the strand specificity of each library was inferred using RSeQC v3.0.0 (38), and RSEM used with the –strandedness option. To identify dynamically regulated genes and isoforms (those where the expression profile for a given tissue varies significantly over the time course), we followed a method previously described (32,39). For genes and transcripts expressed (TPM ≥ 1) in at least 15% of the samples, we first normalized raw counts per million (CPM) using the ‘trimmed mean of M’ (TMM) method implemented in the R/Bioconductor package edgeR v3.30.3 (40). For each organ and species, we then calculated the goodness-of-fit (r2) between these values and the rank order of developmental stages, using the R/Bioconductor package maSigPro v1.60.0 (41).

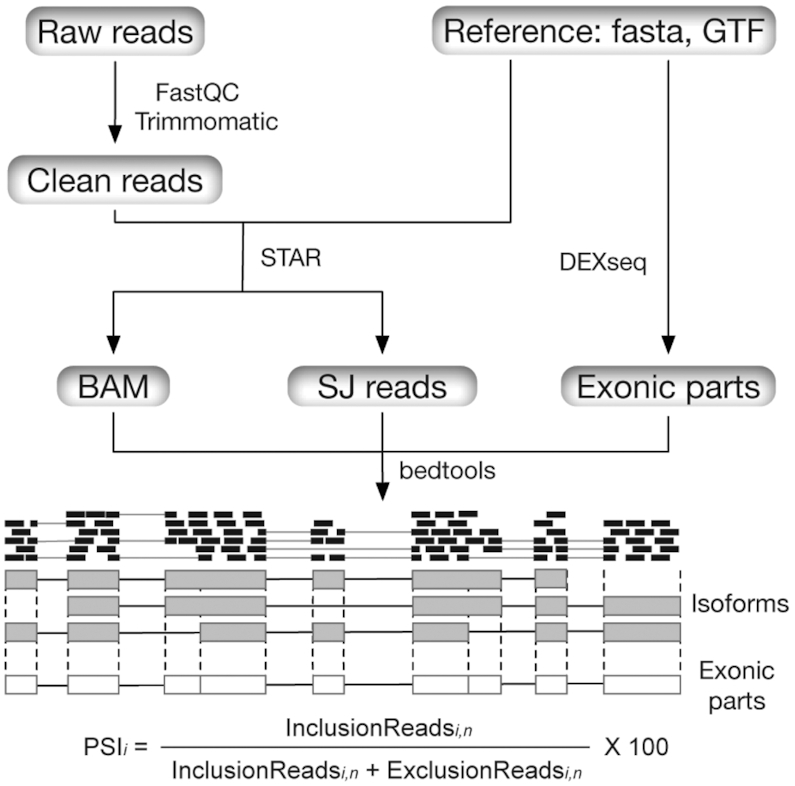
Overview of the pipelines underlying MeDAS. All RNA-seq libraries included in MeDAS were quality-checked (FastQC) and cleaned (Trimmomatic) then aligned to their respective reference genome using STAR. This produces a BAM file and an associated set of reads aligned to each splice junction (SJ) in each isoform. By combining alignment data across splice junctions with a set of exon parts (subsets of exonic regions according to their overlap among isoforms), we could obtain counts of inclusion and exclusion reads. These are, respectively, reads which overlap a given exon (or part) and support its inclusion in a transcript, and those which derive from split alignments and hence originate from transcripts which do not contain it. Finally, we calculated the percent-spliced in (PSI) value for each exon i based on the normalised counts n for both sets.
Identification of AS type
To identify splicing events, we required that each splice junction could be independently detected by 10 uniquely-mapped reads in at least two samples, and that it was supported by ≥ 100 uniquely-mapped reads, counted across all samples. We required that novel splice junctions also had one of three intron motifs (GT/AG, GC/AG, AT/AC, each considered relative to the forward strand; the total counts of each motif are summarised in Supplementary Table S4, with the vast majority of splice junctions having the canonical GT/AG motif). While in principle this approach also allows us to identify novel splice junctions, we considered the primary purpose of MeDAS to be to support existing annotations. As such, while we only report data for known exons at present, by virtue of inclusion in MeDAS this may be considered independent experimental corroboration of their boundaries (this is useful because the annotations of lesser-studied species are more likely to be automatically assigned).
As an index of alternative splicing, we calculated the percent spliced-in (PSI) value for each exon as well as each ‘exon part’, as described in a previous study (42) and recapitulated here. To calculate PSI values, we first need to define counting bins: intervals that correspond to exons or parts thereof (as the same exonic region can have different boundaries in different transcripts). An exon's PSI estimate is ultimately derived from the set of all its parts. These ‘exon parts’ are derived from each species’ reference annotation of coding-transcripts using the R/Bioconductor package DEXSeq (43) and represent subsets of exonic regions according to their overlap among isoforms (Figure 1). To calculate PSI, we counted the number of inclusion reads (IR), those which overlap a given exon (or part) and support its inclusion in a transcript, and exclusion reads (ER), those which derive from split alignments and so originate from transcripts which do not contain it, by using BEDtools v2.23 (44). We then normalized both IRs and ERs to account for differential coverage, as longer exons (or exon parts) would otherwise have higher read counts than shorter ones:
where i indicates the exon (part) number and n the normalized read count.Finally, the PSI of exon i was calculated according to the equation:
Using this measure, constitutive exons will (assuming no transcriptomic noise) have 100 PSI and alternative exons will have 0 < PSI < 100. We further classified exonic parts into four categories according to their AS level across all samples: ‘not expressed’ (no PSI data available), ‘low inclusion’ (PSI < 5), ‘alternatively spliced’ (5 ≤ PSI ≤ 95), or ‘constitutive’ (PSI > 95).
Using SUPPA2 in ‘local AS events’ mode (45), we compared the coordinates of each exon part in each protein-coding transcript to the reference annotation, and classified each splicing event according to one or more AS types: skipping exon (SE), retained intron (RI), alternative 5’ splice site (A5), alternative 3′ splice site (A3), mutually exclusive exons (MX), alternative first exon (AF), in which alternative first-exon use results in mRNA isoforms with distinct 5′ UTRs, and alternative last exon (AL), in which alternative use of multiple polyadenylation sites results in distinct terminal exons.
To ensure comprehensive coverage of each species’ splicing landscape, MeDAS provides PSI estimates for every internal exon of each multi-exonic gene, as well as the raw data underlying these calculations: the inclusion and exclusion reads within each counting interval, i.e. ‘exon part’. This is because exon parts may themselves be of interest, many representing regions co-ordinately spliced within multiple transcripts (that is, protein domains).
USAGE AND EXAMPLES
Database interface and querying
The user interface of MeDAS is shown in Figure 2. To maximise utility and allow the user to set their own thresholds, we present all data in MeDAS in an unfiltered form, except for the results of the Spearman's correlation and Kruskal–Wallis test for which certain criteria were required prior to their calculation (Table 1). Consequently, we recommend that users cross-validate results from MeDAS as exon inclusion ratios—which determine whether an exon is considered alternatively spliced or not—are calculated based on pre-existing genome annotations, which may be of variable quality. We also recommend that users screen records for quality and filter on the basis of, for example, a minimum number of inclusion and exclusion reads per exon. Bulk downloads of alternative splice events, with their associated PSI values, gene expression, and isoform abundance, are available in tab-separated text, with PSI values for each tissue and stage also available in bigWig format.
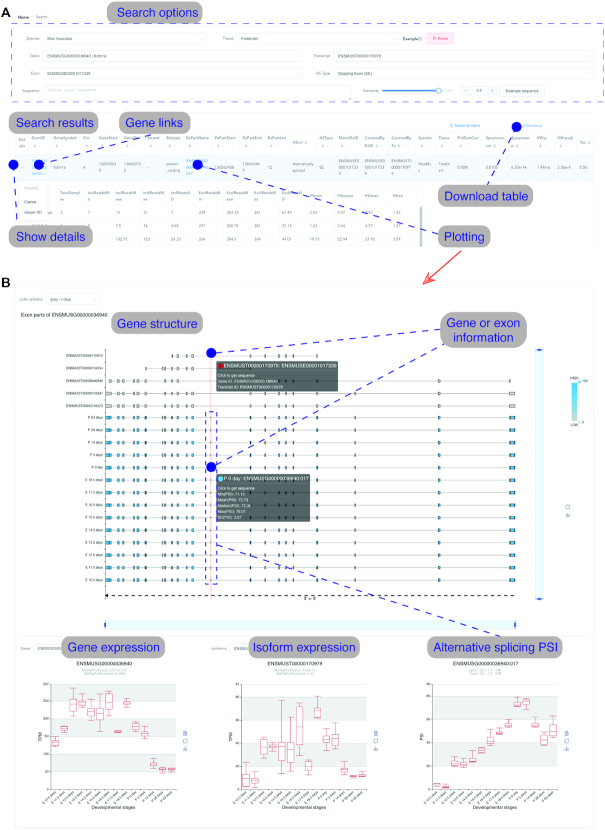
MeDAS user interface. Users can search for alternatively spliced exons by gene, transcript, and exon ID or sequence after selecting a species and tissue, producing results as detailed in Table 1 (A). These tables can be downloaded directly. The results, including the sequence, can be visualised by selecting the exon (B). MeDAS shows a heatmap of PSI plotted across each isoform and developmental stage, as well as boxplots of gene and transcript expression, and PSI per exon.
Example
MeDAS has a hierarchical structure according to (i) the species name, (ii) organ, if available, (iii) gene ID, (iv) transcript ID, (v) exon ID and (vi) exon sequence. Once a specific gene, transcript or exon ID is selected, results tables are shown and the genomic structure can be visualized. The contents of MeDAS are shown in Table 1 and illustrated in Figure 3 using the example of a 12 nucleotide microexon in the mouse Kdm1a gene (which in MeDAS has the ID ‘ENSMUSG00000036940:017’). The distribution of PSI over time shows an inclusion peak between 0 and 3 days post-birth, as shown in (19), consistent with its previously reported role in modulating neurite outgrowth by altering the availability of a phosphorylation site (46,47). Similar patterns were observed in orthologous exons in human (ENSG00000004487:012) and opossum (ENSMODG00000016138:012), both of which show an inclusion peak around the ‘newborn’ and ‘28 days postnatal’ developmental stages, respectively.
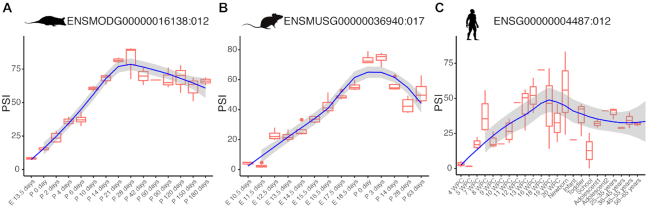
Inclusion level of a conserved 12nt microexon within the developmentally-associated gene Kdm1a. The distribution of PSI over time shows an inclusion peak around 28 days postnatal in opossum (A), between 0 and 3 days post-birth in mouse (B) and around the ‘newborn’ in human (C), respectively.
CONCLUSIONS
MeDAS provides a comprehensive survey of the temporal landscape of metazoan alternative splicing events, facilitating the identification of their putative regulatory roles throughout development. The pipelines used to process the data are available at https://github.com/LuChenLab/MeDAS and can be applied to any other RNA-seq dataset.
SUPPLEMENTARY DATA
Supplementary Data are available at NAR Online.
FUNDING
National Key Research and Development Program of China, Stem Cell and Translational Research [2017YFA0106800 to L.C., J-w.L., 2017YFA0106500 to L.C.]; National Science Fund for Excellent Young Scholars [81722004 to L.C.]; Santander and Newton fund UK-China PhD placement travel grants; PAPPIT-DGAPA-UNAM grant [IN200920]; NERC grant [NE/P004121/1]; Royal Society funding [DH071902, RG0870644, RG080272 to A.O.U.]. Funding for open access charge: National Key Research and Development Program of China, Stem Cell and Translational Research [2017YFA0106800].
Conflict of interest statement. None declared.
REFERENCES
1.
2.
3.
4.
5.
6.
7.
8.
9.
10.
11.
12.
13.
14.
15.
16.
17.
18.
19.
20.
21.
22.
23.
24.
25.
26.
27.
28.
29.
30.
31.
32.
33.
34.
35.
36.
37.
38.
39.
40.
41.
42.
43.
44.
45.
46.
47.