 TCRdb: a comprehensive database for T-cell receptor sequences with powerful search function
Nucleic Acids Research


The authors wish it to be known that, in their opinion, the first two authors should be regarded as joint First Authors.

- Altmetric
T cells and the T-cell receptor (TCR) repertoire play pivotal roles in immune response and immunotherapy. TCR sequencing (TCR-Seq) technology has enabled accurate profiling TCR repertoire and currently a large number of TCR-Seq data are available in public. Based on the urgent need to effectively re-use these data, we developed TCRdb, a comprehensive human TCR sequences database, by a uniform pipeline to characterize TCR sequences on TCR-Seq data. TCRdb contains more than 277 million highly reliable TCR sequences from over 8265 TCR-Seq samples across hundreds of tissues/clinical conditions/cell types. The unique features of TCRdb include: (i) comprehensive and reliable sequences for TCR repertoire in different samples generated by a strict and uniform pipeline of TCRdb; (ii) powerful search function, allowing users to identify their interested TCR sequences in different conditions; (iii) categorized sample metadata, enabling comparison of TCRs in different sample types; (iv) interactive data visualization charts, describing the TCR repertoire in TCR diversity, length distribution and V-J gene utilization. The TCRdb database is freely available at http://bioinfo.life.hust.edu.cn/TCRdb/ and will be a useful resource in the research and application community of T cell immunology.
INTRODUCTION
The T-cell receptor (TCR), which is located on the surface of T cells and responsible for antigen recognition, is a core component in the adaptive immune system (1). The TCR is formed by V(D)J recombination, a mechanism of somatic recombination during the T cell maturation and resulting in a high diversity of TCR repertoire (2). The high diversity of TCRs is mainly due to the complementarity determining regions 3 (CDR3) on the beta chain (3). TCR repertoire reflects the immune status of an individual and is associated with human diseases and health. Identifying TCR CDR3 sequences and exploring the TCR repertoire are pivotal for understanding the adaptive immune response and immunotherapy. For example, profiling TCR repertoire is valuable for quantitatively evaluating immune diversity and further to assist cancer early-stage diagnosis (4), treatment selection (5) and prognosis prediction (6). As TCR repertoire could determine the immunological status and abnormality, TCR repertoire analysis has been used to detect the malignant clone in some blood disorders and demonstrated better sensitivity and accuracy than conventional methods (7). It is also helpful for understanding the dynamics of immune response, such as to monitor the repertoire change during/after virus infection (8). Furthermore, TCR repertoire analysis could benefit to the immunotherapy, while detecting tumor-specific or neoantigen-specific TCR is a critical step that directly impacts the curative effect (9).
Characterizing TCR repertoire is challenged by the enormous scope of TCR diversity. With the development of the high-throughput TCR sequencing (TCR-Seq) technology, TCR repertoire analysis is feasible and is rapidly deepening our understanding of T cell biology and immunology. A prodigious number of TCR-Seq datasets are publicly available, which have not been efficiently exploited and only a small part of them is collected by existing databases. Most existing TCR databases only focus on a specific aspect and data are collected from low-throughout experimentally validated essays. For example, STCRDab (10) and TCR3d (11) provide TCR structural information from PDB database and each database contains only ∼1000 records. VDJdb (12), IEDB (13) and McPAS-TCR (14) provide manually curated TCR sequences associated with pathogen or antigen, and just consist of ∼100 000 TCR sequences. These databases are valuable resources. However, compared with that in TCR-Seq data, one sample usually contains 100 000–200 000 unique TCR sequences, these databases are limited by their small data volume and lack of information in the repertoire level. Another three databases VDJServer (15), iRecetpor (16) and PIRD (17) provide TCR sequences extracted from TCR-Seq datasets with limitations on containing only 10–20 TCR-Seq datasets, lack of characteristic information of TCR repertoires, and unfriendly web interfaces.
With more and more TCR-Seq data are produced, it is desirable to collect these comprehensive data and analyse them in a uniform pipeline to provide the TCR repertoire. There is also a rising demand for integrated analysis of immune repertoire data (18). To meet the emerging demands, we hereby present the TCRdb, a comprehensive TCR sequence database (http://bioinfo.life.hust.edu.cn/TCRdb), aiming to provide human TCR beta chain sequences associated with specific tissue/clinical condition/cell type with powerful search, and visualization functions. TCRdb has collected over 130 projects and 8000 samples from public databases, which is the most comprehensive TCR sequence resources to date. Strict quality control was performed on TCR-Seq data and TCR sequences were extracted through multiple computational methods, ensuring their high-reliability and unbiasedness.
MATERIALS AND METHODS
Data collection and processing
To collect comprehensive data in TCRdb, as shown in Figure 1A, we collected and curated TCR-Seq data and TCR sequences from (i) public TCR-Seq datasets from NCBI Sequence Read Archive (SRA); (ii) other TCR sequences databases, including iReceptor, VDJServer and immuneACCESS (https://clients.adaptivebiotech.com/immuneaccess). We only used those sequences/repositories with known sample attribute of disease/cell type/clinical condition and discarded those from unknown samples. At present, TCRdb contains 277 million highly reliable TCR sequences from a total of 130 studies, 8265 samples from 41 tissues, 54 cell types and 113 clinical conditions.

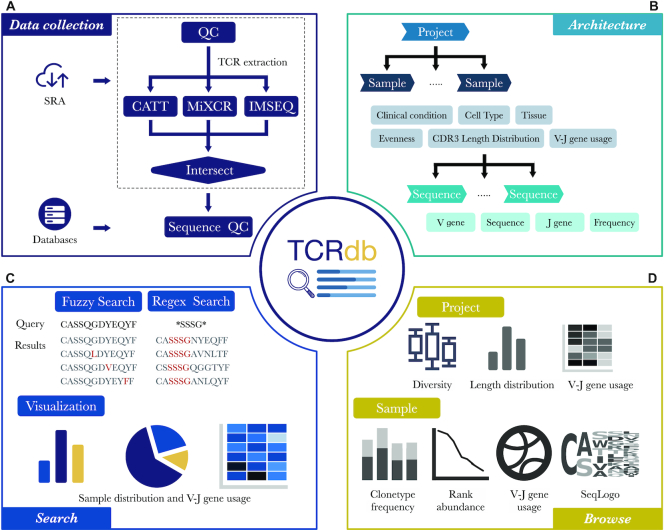
Overview of TCRdb. (A) The pipeline of data collection and processing. The TCR-Seq raw data from SRA after quality control were performed by three methods to extract TCR sequences and then intersected. TCR sequences from other TCR databases were also imported. (B) The data architecture of TCRdb, all data were formed a three-layer structure, comprised of project, sample, and sequence. (C) The search function of TCRdb. TCRdb provides two kinds of search method: ‘Fuzzy search’ and ‘Regex search’, allowing the search for similar sequences or sequences with a specific pattern. The search results are listed and visualized in interactive statistical plots by sample distribution and V-J gene usage. (D) The browse function of TCRdb. Users could browse specific projects or samples in TCRdb for their TCR repertoire.
All public TCR-Seq datasets were uniformly quality controlled and processed from raw sequencing data by our homemade scripts. Briefly, all TCR-Seq data were downloaded through SRA-toolkit, quality controlled by fastp (19) with Q25 standard, and removed the first and last 5 bp for each read if their quality is less than 25. We used PEAR (20) with the default setting to merge paired-end TCR-Seq reads to a single-end read, unmerged paired-end reads were treated as single-end reads. UMI labelled data were treated with UMI-tools (21) to remove barcodes and then corrected reads with the same barcode. In case the UMI information could not be found from the study description, we inferred the potential UMI region according to the conservation of reads and directly deleted it from each read, treating the sample as a non-UMI labelled sample. For TCR sequences from other TCR databases, we manually downloaded them and re-organized the data to fit the structure of TCRdb.
TCR sequences extraction
To increase the reliability of processed TCR sequences, multiple TCR extraction methods were used: CATT (22), MiXCR (23) and IMSEQ (24). These methods had demonstrated precise and sensitive performance on previous benchmarks (22,25). To reduce false positives, we used the intersection sets of TCR repertoire retrieved by three methods as the final result of a sample. In case for some samples that one method failed to output results due to the program reason or the number of output TCR sequences is less than one-third of other methods, the method would be excluded in those samples. Because CATT showed better repertoire precision and MiXCR showed better V and J gene identification capability (22,26), each TCR sequence record adopted the ratio from CATT output and V/D/J gene from MiXCR output. The details of the parameters used by these methods can be found in https://github.com/GuoBioinfoLab/TCRdb.
Sequence quality control
All TCR sequences extracted from raw TCR-Seq data and other TCR databases were further processed to ensure the credibility and the quality of sequences. Only complete TCR sequences will be retained which should contain identical V gene, J gene and in-frame CDR3 sequences. The amino sequence of CDR3 should begin with cysteine (C) and end with phenylalanine (F), to meet the definition of the international ImMunoGeneTics information system (IMGT) (27), and should not contain any stop codon. The same CDR3 sequences with different V/J gene were merged and only keep the most frequent V/J gene. Different alleles of the same TRBV/J family were also merged to only keep the family information of TRBV/J gene. After the merging, we required the ratio of a TCR sequence in the repertoire should be larger than 0.00001% and discarded those with a ratio less than that.
Metadata extraction
The metadata of TCR-Seq datasets (including but not limited to tissue, cell type and clinical conditions) was manually curated based on the description from their source websites or publications. When there is a conflict between the metadata from publication and database description, the literature information was prior accepted. Uncertain description and unknown information would be labelled as ‘unknown’.
Clonality
We adopt the clonality to quantify the TCR repertoire diversity and make it comparable between different samples. The clonality is a measure of oligoclonality of the sample and is calculated from Shannon's Entropy, which has been widely accepted (4). The clonality is defined as equation 1, in which the parameter n represents the number of unique TCR sequences in the repertoire and represents the frequency of TCR sequence i. The clonality value range from 0 (polyclonal distribution) to 1 (monoclonal distribution).
Data organization
All sequences were organized into a three-layer structure comprised of project, sample, and sequence (Figure 1B). The sequence level only contains information of TCR sequence, including CDR3 amino acid sequence, V gene, D gene, J gene, and its ratio in the corresponding repertoire. The sample level further integrates the statistical information of all CDR3 sequences in the sample, such as CDR3 sequence length distribution. Metadata is also described in this level, such as clinical conditions and cell types. The project level is the collection of samples. Besides the regular statistical information, users could also compare samples within a project with different conditions, like comparing the diversity of TCR repertoire of different cell types or CDR3 length distribution between cancer patients and healthy donors.
WEBSITE FUNCTION AND CONTENT
The TCRdb was developed using Vue (version 2.6.1), a JavaScript-based web interface framework and Flask (version 1.0.3), a python-based web application framework. The current version of TCRdb runs on an Apache web server deployed on an Ubuntu Linux Server. All datasets were documented and managed in MongoDB (version 4.2.1). We exploited G2 (version 4.0.0) and ECharts (version 4.6.0) for interactive visualizations.
Search
Due to the high diversity of TCR sequences and similar sequences are likely to have similar properties (28), the search function in TCRdb allows users to search their interested TCR sequence through the database and obtain samples with a similar TCR sequence (Figure 2A). In this page, TCRdb provides two kinds of search methods: ‘Fuzzy search’ and ‘Regex search’ to meet different needs. ‘Fuzzy search’ could find TCR sequences in the database with less than two mismatch amino acids between the query sequence and object sequence. ‘Fuzzy search’ could be used to find sequences similar to the query sequence, as it could provide extra information from similar TCR sequences, even the query sequence is not existing in the database. Previous studies demonstrated that only a part of CDR3 sequence would contact specific peptide (29), which form a part of TCR specificity. ‘Regex search’ allows users to search sequences satisfying the input regular expression, which could easily search sequences with a specific substring/motif and find TCR sequence group that may have sample specificity within/across samples. The search results are displayed in a dynamic table with sorting and filtering functions (Figure 2A). The table is ranked in decreasing order of sequence fraction in the repertoire. Each row in the resulting table represents an eligible sequence; each column contains the project ID, sample ID, CDR3 sequences, fraction, and metadata of the sample, including tissue, cell type, and clinical condition. Users could filter the results by selecting different options, like clinical conditions and used V gene. TCRdb also provides several figures to visualize the search results, where users could view the V or/and J gene usage, the distribution of resulting sequences in clinical conditions, tissues and cell types. Though only the top 1000 results would be displayed in the table, the figures are drawn with the total records.
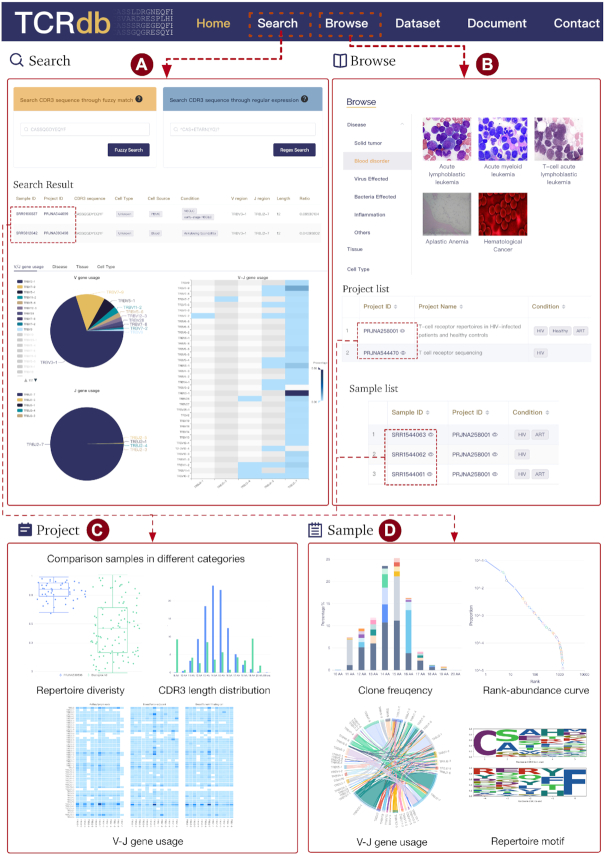
The functional web pages of TCRdb. TCRdb provides two main functions: search (A) and browse (B). (A) Users could search their interested TCR sequences in flexible ways and view the results in user-friendly interactive pages and plots. (B) Users could browse TCR-Seq datasets in specific diseases, tissues, and cell types. (C, D) By clicking the project/sample link on the search/browse result page, detailed information will be displayed on a new page for the project/sample. (C) The project page contains the project details, as well as comparison results of samples in different groups (cell type, tissue, and clinical condition) within the project. (D) In the sample page, TCRdb provides characterizations of TCR repertoire and all TCR sequences extracted from the sample.
Browse
TCRdb allows users to browse the database in flexible ways. The ‘Browse’ page provides a catalog of projects/samples according to different categories (Figure 2B). By clicking a category (e.g. Solid Tumor → Breast Cancer), TCRdb will list all projects/samples in the category. The overall CDR3 length distribution and TCR repertoire diversity are also displayed in which TCRdb adds the healthy samples as controls for better comparison. We also built a ‘Dataset’ page, on which users can browse all datasets and filter them by cell type (e.g. Treg cell), tissue type (e.g. blood), and clinical condition (e.g. breast cancer). Clicking the project ID/sample ID in these pages will open a detailed page of the corresponding project/sample. On a project page, users can view the basic information of the project and we have visualized the TCR repertoire features in user-friendly interactive graphics. For facilitating sample-sample comparison within a project, TCRdb provides dynamic figures to visualize the TCR repertoire diversity of samples in a project, total CDR3 length distribution, and average V–J gene utilization heatmap (Figure 2C). Users can browse these dynamic views of comparisons in four aspects, including ‘Overview’, ‘Cell Source’, ‘Cell Type’ and ‘Condition’, which classify samples into different categories. For example, on the page of project PRJNA301507, users could compare the TCR repertoire difference between samples of lymph node, peripheral blood and breast tumor under the ‘Cell Source’ option. While clicking the ‘Cell Type’ option, the figures will be changed to display the TCR repertoire of T naive cell, T memory cell, and Treg cell. Aiming to better compare and characterize the TCR repertoire, in these figures, TCRdb also provides the background TCR repertoire. The repertoire consists of 200 randomly selected TCR repertoires from healthy individuals in TCRdb, which could be used as a benchmark to measure the TCR repertoire bias.
By clicking a sample ID on the project page, users can further view the details of the sample. In the sample level, TCRdb provides intrinsic features of the TCR repertoire (Figure 2D): (i) the frequency of the top five most common CDR3 sequences in each CDR3 length. Users could find the clonal expansion of TCR with a specific CDR3 length. (ii) the diversity of TCR repertoire is shown in the rank-abundance curve. A steep gradient indicates low evenness, as the high-ranking TCR sequences have much higher abundances than the low-ranking sequences and vice versa. (iii) Average V–J gene utilization of TCR sequences. The width of the chord represents the frequency of V–J gene in the repertoire. (iv) The sequence logo of TCR repertoire, in which we show the position weight matrix of the first and last 5 amino acids, reflecting the TCR repertoire conservation.
Download
TCRdb allows users to download the TCR data they queried or browsed. By clicking the ‘Export to TSV’ button above the data table in search results or sample display page, users could download data in ‘.tsv’ format and open it in excel. The downloaded data contain the TCR sequences information as well as the metadata of the sample which the sequences belong to.
CONCLUSIONS AND FUTURE EXTENSION
T cells are key components in the immune system and tumor immunology. The discovery and understanding of T cell biology have led to new insights in their application, such as predicting prognosis by the T cell subtypes (30) and selecting appropriate treatment according to the T cell status (31). The highly active of TCR-Seq technology in the past 10 years have enabled high-throughput and accurate identification of TCR repertoire, which is important with the advent of precision medicine (32) and immunotherapies (33). To utilize the rapidly accumulating TCR-Seq data, we developed a comprehensive TCR sequence database, TCRdb, which collected TCR sequences with annotated metadata by manually curated from public TCR-Seq data and databases. TCRdb has collected 130 TCR-Seq studies including over 8000 samples, which are associated with various diseases, cell types, and tissues. All TCR-Seq data collected by TCRdb are processed by standard pipelines making sure the comparability and reliability of extracted TCR sequences. To the best of our knowledge, TCRdb is the first database with comprehensive TCR sequences and providing powerful search function in flexible ways. TCRdb also extracted and analyzed the features of TCR repertoire data and visualized them in user-friendly interactive plots, facilitating browsing, characterizing, and comparing samples (Figure 1D, 2C, D).
TCRdb could be applied to many situations. For example, in some immunotherapies like tumor-infiltrating lymphocyte therapy and TCR-T therapy (34), it is critical to identify T cell clones that are specific to the tumor. Users could use TCRdb to query the candidate TCR sequences and determine the degree of TCR specificity. Besides, public TCR sequences that are common in people have shown being related to autoimmunity (35). Quantifying the public sequences in the TCR repertoire by TCRdb may assist in predicting the autoimmune disease prognosis (36) and help treatment selection (37). Moreover, TCRdb provides a benchmark for the relevant researches. Comparing to the features (CDR3 length distribution, repertoire diversity, etc.) of TCR repertoire in TCRdb would benefit users to identify the skewness in the TCR repertoire like clonal expansion, which could be a biomarker for disease diagnosis (38).
As the number of TCR studies will continue to increase rapidly in the future. we will continually maintain and improve by adding more kinds of TCR data including but not limit to (i) TCR sequences from other chains such as alpha, gamma and delta; (ii) TCR sequences from other species like Mus musculus and Sus scrofa; (iii) TCR sequences from other kinds of sequencing data like RNA-Seq data or single-cell sequencing data. We hope this elaborate database, including comprehensive TCR sequences and metadata, can serve as an important catalyst for the future of immunology research.
FUNDING
National Key Research and Development Program of China [2017YFA0700403]; National Natural Science Foundation of China (NSFC) [31822030, 31801154, 31771458]; China Postdoctoral Science Foundation [2017M622455, 2019T120664]. Funding for open access charge: National Natural Science Foundation of China [31822030].
Conflict of interest statement. None declared
REFERENCES
1.
2.
3.
4.
5.
6.
7.
8.
9.
10.
11.
12.
13.
14.
15.
16.
17.
18.
19.
20.
21.
22.
23.
24.
25.
26.
27.
28.
29.
30.
31.
32.
33.
34.
35.
36.
37.
38.