 Animal-APAdb: a comprehensive animal alternative polyadenylation database
Nucleic Acids Research


The authors wish it to be known that, in their opinion, the first two authors should be regarded as Joint First Authors.

- Altmetric
Alternative polyadenylation (APA) is an important post-transcriptional regulatory mechanism that recognizes different polyadenylation signals on transcripts, resulting in transcripts with different lengths of 3′ untranslated regions and thereby influencing a series of biological processes. Recent studies have highlighted the important roles of APA in human. However, APA profiles in other animals have not been fully recognized, and there is no database that provides comprehensive APA information for other animals except human. Here, by using the RNA sequencing data collected from public databases, we systematically characterized the APA profiles in 9244 samples of 18 species. In total, we identified 342 952 APA events with a median of 17 020 per species using the DaPars2 algorithm, and 315 691 APA events with a median of 17 953 per species using the QAPA algorithm in these 18 species, respectively. In addition, we predicted the polyadenylation sites (PAS) and motifs near PAS of these species. We further developed Animal-APAdb, a user-friendly database (http://gong_lab.hzau.edu.cn/Animal-APAdb/) for data searching, browsing and downloading. With comprehensive information of APA events in different tissues of different species, Animal-APAdb may greatly facilitate the exploration of animal APA patterns and novel mechanisms, gene expression regulation and APA evolution across tissues and species.
INTRODUCTION
Alternative polyadenylation (APA) is a widespread mechanism that contributes to the generation of transcript isoforms with different lengths of 3′ untranslated regions (3′UTR) by recognizing different polyadenylation signals (1), which may cause the alteration of some important regulatory elements, such as miRNA binding sites and RNA protein binding sites, thus affecting mRNA stability, localization and translation (2,3). It has been revealed that approximately 70% of eukaryotic genes possess multiple functional polyadenylation sites (PAS) (3–6) and nearly half of genes in fruitfly (7), worm (8) and zebrafish (9) undergo APA. APA-mediated gene regulation functions in a tissue-specific (3,10), and cell-specific manner (11,12). For example, brain and neuronal cells tend to have longer 3′UTRs than testis and ovary cells (13,14). Global 3′UTR shortening has been found in proliferating cells, cancer cells and tumor samples (13,15–17), whereas 3′UTR lengthening is associated with embryonic differentiation (16) and animal neurogenesis (18). Recent studies have highlighted the important roles of APA in human. Several APA dysregulations have been identified in human diseases (6–9), such as diabetic nephropathy, systemic lupus erythematosus and muscular dystrophy (19). However, the scope for gene regulation at the level of cleavage and polyadenylation in other animals except human has not been well recognized.
Several methods have been developed to identify PAS and quantify APA events (1,20–23). Compared with early APA identification methods based on complementary DNAs, expressed sequence tags and 3′-sequencing data, which can only detect limited APA events, RNA sequencing (RNA-seq) has become an alternative technology for detecting APA events at the genome level (24–26). Accordingly, several algorithms have been developed for the identification of APA events from RNA-seq data, either based on de novo identification algorithms including IsoSCM (27), DaPars (15,28), APAtrap (29) and TAPAS (30) or annotation-based algorithms such as MISO (31), roar (32) and QAPA (33). In human, TC3A (34) and APAatlas (24) databases systematically characterize APA events in different tissues using a large amount of RNA-seq data from The Cancer Genome Atlas and Genotype-Tissue Expression project, respectively. However, there is no database that provides comprehensive APA information for other animals except human in a large number of tissues.
In this study, we systematically characterized APA profiles in 9244 samples of 18 species using the RNA-seq data collected from public databases. These species include baboon, chicken, chimp, clawed frog, cow, crab-eating macaque, dog, fruitfly, green monkey, horse, mouse, pig, rabbit, rat, rhesus, sheep, worm and zebrafish. In addition, we predicted the PAS and motifs near PAS (APA motifs) of these species. Finally, we further developed Animal-APAdb (http://gong_lab.hzau.edu.cn/Animal-APAdb/), a user-friendly database for the browsing, searching and downloading of APA-related information.
MATERIALS AND METHODS
Collection and processing of RNA-seq data
To obtain a complete list of RNA-seq data of other animals except human, we conducted a comprehensive search from the Sequence Read Archive (SRA, https://www.ncbi.nlm.nih.gov/sra) (35,36) of the National Center for Biotechnology Information. The following search terms were used for SRA searching on 10 December 2019: (‘cdna’[Selection]) AND ‘transcriptomic’[Source]) AND (‘rna seq’[Strategy]) NOT (‘human’[Organism]) NOT (‘single cell’[Text Word]), and a total of 443 318 records were obtained. Because certain files are required in the quantification of APA events, including gene_bed.file, gene_symbol_file, ensembl_identifiers.txt, gencode.basic.txt, genome.fa and genome.annotation.gtf from UCSC (https://genome.ucsc.edu/) (37) and Ensembl (http://www.ensembl.org) (38), the candidate species were screened based on the availability of the required files and the ranking of their sample sizes. As a result, a total of 18 species were selected for further study. Then, we extracted all BioProjects from the sample list and checked each description manually. Finally, 106 BioProjects of normal tissues were retained. The non-repetitive raw RNA-seq data from these BioProjects were downloaded, converted into standard fastq, subjected to quality control using FastQC (version: v0.11.8), cleaned with Trim Galore (version: 0.6.4_dev) and then aligned to the corresponding reference genome using HISAT2 (39). Subsequently, samples and BioProjects with low mapping rates were discarded, and finally 9244 samples of 97 BioProjects were retained (Figure 1A).

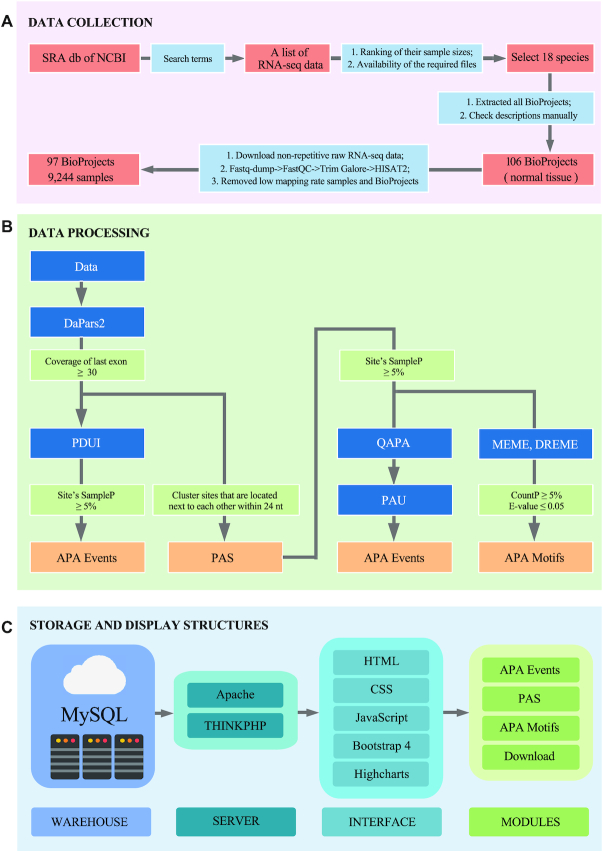
Flow chart of Animal-APAdb. (A) Data collection. (B) Data processing. (C) Storage and display structures of Animal-APAdb.
Identification of PAS and PAS cluster
Recent studies have demonstrated the possibility of using denovo algorithms to identify novel PAS based on RNA-seq data (15,28). Here, we used the well-established de novo algorithm DaPars2 (15) to identify the alternative proximal PAS within each sample. Based on the two-PAS model, DaPars2 applies a linear regression model to infer the location of the APA site within the 3′UTR region. Considering that the position of PAS predicted by DaPars2 might be inconsistent among different samples, the sites were grouped into a cluster based on the principle of the site position distance ≤24 nt (Figure 1B) (40,41). For a gene, the median position of a PAS cluster is usually the most representative site among samples, so the median site was defined as the PAS.
Identification of alternative polyadenylation
In this study, we utilized two popular algorithms, DaPars2 and QAPA, to quantify APA events from standard RNA-seq data. DaPars2 only predicts single proximal site, and the end of 3′UTR was taken as the distal site by default, so we used the percentage of the distal poly(A) site usage index (PDUI) to quantify APA events. PDUI value was a novel, intuitive ratio for quantifying APA events based on RNA-seq data (28), which was calculated by the expression level of isoform with the distal poly(A) site, divided by the total expression level of isoforms with both distal and proximal poly(A) sites. To reduce false positives, we discarded the PDUIs of certain transcripts for which the coverage of the last exon <30× or the percentage of samples supporting this PAS cluster (SampleP) < 5% (Figure 1B) (24,28). For QAPA, which is based on transcript-level abundance, it can calculate the relative proportion of each isoform in a gene using the PAS annotation files from GENCODE basic poly(A) annotation track, PolyASite (42) and/or custom file, so we used Poly(A) Usage (PAU) to quantify APA events. Due to the lack of PAS annotation files for most animals, we first created PAS annotation files based on the PAS extracted from DaPars2 results with the SampleP ≥ 5% (Figure 1B). Since mouse and worm have PAS annotation files in PolyASite database, these PAS annotation files were merged with our PAS annotation files for QAPA calculation.
Identification of APA motifs
Polyadenylation is the result of an RNA processing reaction. In the polyadenylation process, a multiprotein complex assembles on specific sequences of the pre-mRNAs, which are called the cleavage and polyadenylation signals (pA signals) (43). pA signals are composed of sequences that flank either side of where the pre-mRNA is endonucleolytically cleaved and subsequently polyadenylated (43). The classic pA signal is a bipartite sequence element that usually consists of a PAS hexamer, as well as upstream and downstream motifs of the cleavage site. In this study, we scanned the 50 nt (1,26) upstream sequence of the PAS to find PAS hexamers by DREME (44). In addition, for each PAS, motifs respectively at 200 nt upstream and downstream (1) from the PAS were obtained using MEME (45). Motifs were further filtered based on the following conditions: the statistical significance of the motif (E-value) > 0.05, the percentage of sites contributing to the construction of the motif (CountP) < 5% for MEME, or the percentage of sequences matching the motif (CountP) < 5% for DREME (Figure 1B).
IMPLEMENTATION
Animal-APAdb (http://gong_lab.hzau.edu.cn/Animal-APAdb/) was built based on the THINKPHP (version 5.0.24) framework and Bootstrap 4, and runs on the Apache 2 web server with MySQL (version 5.7.29) as its database engine and Highcharts for graph drawing (Figure 1C). Animal-APAdb is available online without registration and optimized for Chrome (recommended), Internet Explorer, Opera, Firefox, Windows Edge and macOS Safari.
DATABASE CONTENT AND USAGE
Samples of 18 species in Animal-APAdb
In total, 9244 samples of 18 species were analyzed in Animal-APAdb, ranging from 87 samples in Crab-eating macaque to 1235 samples in mouse (Table 1). The detailed information, including the number of samples per species, reference genome versions and the number of APA events, is available on the ‘Document’ page. The sample information of each species is presented in the ‘BioProjects of each species’ module on the ‘Document’ page, including species, the ID of BioProject, library layout, sample size and breed.

| Species | No. of samples | APA events identified by DaPars2 | APA events identified by QAPA | Identified PAS | Genes with multiple PAS (%) |
|---|---|---|---|---|---|
| Papio anubis (Baboon) | 766 | 2657 | 2401 | 11 694 | 21.73 |
| Gallus gallus (Chicken) | 656 | 25 600 | 20 680 | 72 508 | 60.06 |
| Pan troglodytes (Chimp) | 262 | 11 524 | 14 447 | 41 063 | 31.66 |
| Xenopus tropicalis (Clawed frog) | 284 | 19 782 | 18 164 | 49 648 | 59.07 |
| Bos taurus (Cow) | 838 | 17 203 | 17 741 | 68 535 | 55.41 |
| Macaca fascicularis (Crab-eating macaque) | 87 | 29 269 | 26 956 | 60 990 | 54.83 |
| Canis lupus familiaris (Dog) | 292 | 16 837 | 14 066 | 55 969 | 47.21 |
| Drosophila melanogaster (Fruitfly) | 774 | 7332 | 8572 | 34 261 | 52.12 |
| Chlorocebus sabaeus (Green monkey) | 327 | 13 922 | 14 645 | 43 972 | 41.18 |
| Equus caballus (Horse) | 160 | 11 149 | 7186 | 36 641 | 44.59 |
| Mus musculus (Mouse) | 1235 | 54 448 | 53 710 | 166 132 | 43.26 |
| Sus scrofa (Pig) | 819 | 36 280 | 24 441 | 160 005 | 61.41 |
| Oryctolagus cuniculus (Rabbit) | 338 | 7687 | 7442 | 22 165 | 40.88 |
| Rattus norvegicus (Rat) | 901 | 19 605 | 20 378 | 74 092 | 47.71 |
| Macaca mulatta (Rhesus) | 257 | 29 138 | 20 625 | 82 352 | 39.65 |
| Ovis aries (Sheep) | 730 | 7029 | 4189 | 26 652 | 32.27 |
| Caenorhabditis elegans (Worm) | 319 | 17 218 | 18 459 | 28 830 | 24.79 |
| Danio rerio (Zebrafish) | 199 | 16 272 | 21 589 | 46 991 | 40.31 |
| Sum | 9244 | 342 952 | 315 691 | 1 082 500 | - |
| Max | 1235 | 54 448 | 53 710 | 166 132 | 61.41 |
| Min | 87 | 2657 | 2401 | 11 694 | 21.73 |
| Median | 333 | 17 020 | 17 953 | 48 320 | 43.93 |
APA events in Animal-APAdb
Considering that de novo identification may introduce some false positives, part of the results was filtered as aforementioned. Finally, we identified a total of 342 952 APA events (median: 17 020 per species) using the DaPars2 algorithm, and 315 691 APA events (median: 17 953 per species) using the QAPA algorithm in these 18 species, respectively. The summary of these APA events is shown in ‘APA event summary’ module on the ‘Document’ page and Table 1.
PAS in Animal-APAdb
By using DaPars2, we identified a total of 1 082 500 PAS in these species, ranging from 11 694 in baboon to 166 132 in mouse. About 44% genes have multiple PAS, ranging from 22% in baboon to 61% in pig. We found that the 3′UTR length of genes (median: 773 nt) with multiple PAS is obviously longer than that of genes (median: 149 nt) with single PAS among all species (Figure 2A). We then calculated the number of occurrences of classic polyadenylation signal AATAAA and its 1 nt variants at upstream 50 nt from PAS (1,26,46), and found that about 18% PAS having these signals, which is similar to the percentage of 15% reported in another study (26).
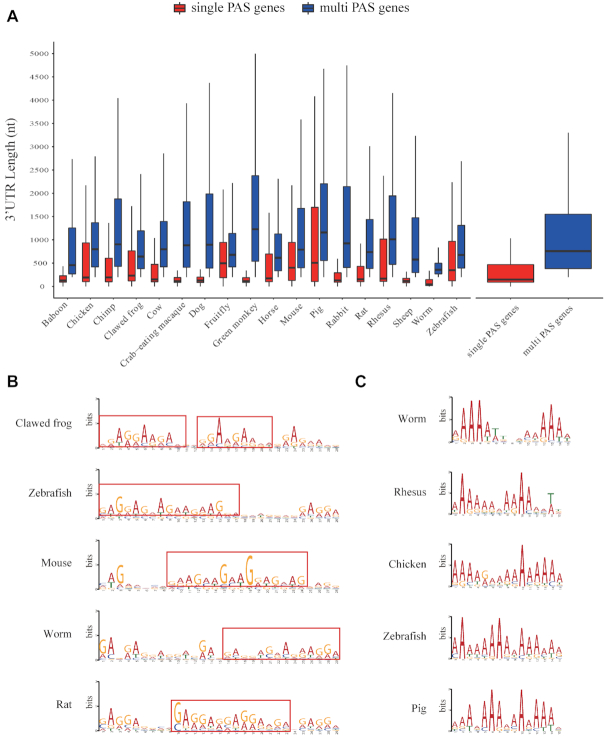
Some results of PAS and APA motifs. (A) 3′UTR length differences between single PAS genes and multi PAS genes. (B) A case of motifs at upstream 200 nt. (C) A case of motifs at downstream 200 nt.
APA motifs in Animal-APAdb
By using the MEME, DREME tool and the threshold value mentioned above, we obtained a total of 336 valid motifs, including 154 PAS hexamers, 90 motifs at 200 nt upstream, 92 motifs at 200 nt downstream. Among these PAS hexamers, the most frequent motifs are GGAGGA and TGTAAA, which are presented in 11 species, followed by GGAAGA, TGTATA and AGAAGA. It is actually difficult to determine the differences or similarities between motifs generated from MEME tool due to their different lengths. However, some similar short sequences could still be found from motifs in different species here, such as GAGGAAGA, CTGCTG and their variants at upstream 200 nt (Figure 2B), and A-rich sequence, CTGCAG and their variants at downstream 200 nt (Figure 2C).
Web interface
Animal-APAdb provides a user-friendly web interface. Four main modules, including ‘APA Events’, ‘PAS’, ‘APA Motifs’ and ‘Download’ (Figure 3A), are provided for the users to query APA events of genes in the tissues of certain species, retrieve PAS in the gene/genomic region of interests, browse probable APA motifs and download corresponding datasets.
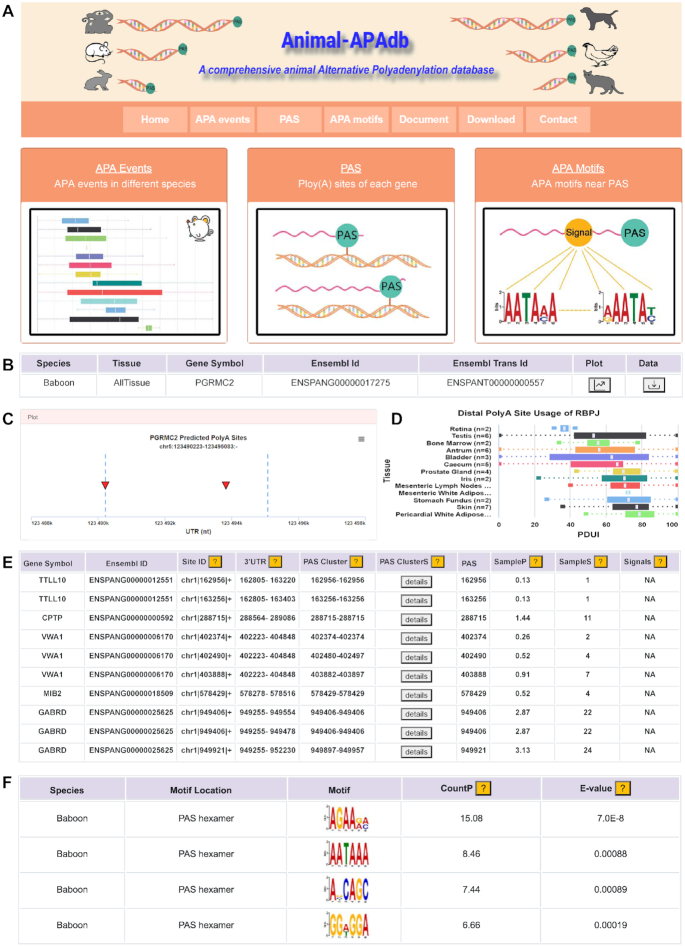
Overview of the Animal-APAdb. (A) The main functions in Animal-APAdb, including ‘APA Events’, ‘PAS’, ‘APA Motifs’ and ‘Download’ modules. (B) A table with species, tissue, gene symbol, Ensembl ID and Ensembl Trans ID of queried APA events. (C) The PAS graph of the queried gene. (D) The box-plot graph of APA events of the queried gene. (E) An example of search results in the ‘PAS’ module. (F) A case in the ‘APA Motifs’ module.
On the ‘APA Events’ page, the users can query APA events by selecting an algorithm, species and tissue and typing a gene symbol or Ensembl gene ID in the search box. A table with the species, tissue, gene symbol, Ensembl ID and Ensembl Transcript ID of the queried APA events will be shown (Figure 3B). Then, by clicking the ‘Plot’ button, the users can view the position graph (Figure 3C) including the range of 3′UTR of the gene, the position of PAS and a box-plot graph of APA events (Figure 3D). It is worth noting that QAPA can calculate the usage of multiple sites (the distal site may be different from the end of 3′UTR) by PAS annotation file. Hence the users need to click the point on the position graph to retrieve the box-plot graph if they selected QAPA algorithm.
On the ‘PAS’ page, the users can select a species and input a genomic region (e.g. chr1:1–2000000:+), gene symbol or Ensembl ID to query the PAS clusters. Then, a table will be presented to provide details of the cluster with gene symbol, Ensembl ID, site ID, 3′UTR, PAS cluster, all PAS in the cluster (PAS ClusterS), PAS, the percentage (SampleP) and number (SampleS) of samples that support this PAS cluster and signals (Figure 3E). The users can click the ‘Download’ button to download the queried data, or click the ‘?’ button for more information.
On the ‘APA Motifs’ page, when the users select the species and motif location, a table with species, motif location, motif, CountP and E-value will be provided, and more detailed reports can be obtained by clicking the ‘More Detail’ button (Figure 3F).
In Animal-APAdb, the main datasets of tissues for each species can be freely available from the ‘Download’ page. The ‘Document’ page provides the sample information, reference genome versions, APA event summary, pipeline of database construction and some other information. Besides, Animal-APAdb welcomes any feedback with email address provided on the ‘Contact’ page.
SUMMARY AND FUTURE DIRECTIONS
Great progress has been achieved in animal genome research in recent decades. Several animal-related databases, such as AnimalQTLdb (47) and Animal-ImputeDB (48), have been widely used by researchers. However, there are still big gaps in the research on the mechanisms and functions of APA in other animals except human. In this study, we developed the Animal-APAdb by collecting public available data, and provided comprehensive APA information of different tissues in 18 species. To the best of our knowledge, Animal-APAdb is the largest and most comprehensive animal APA database to date. In this version of Animal-APAdb, by using the data of 9244 samples, numerous PAS in multiple species are provided, and large amounts of APA events in different tissues and probable APA motifs are identified. In the future, we will integrate more samples and species into Animal-APAdb and continue to update the database. With comprehensive APA information in various tissues of different species, we believe that Animal-APAdb will be useful for uncovering animal APA patterns and novel mechanisms, gene expression regulation and APA evolution across tissues and species.
FUNDING
National Natural Science Foundation of China [31970644 to J.G.]; Huazhong Agricultural University Scientific & Technological Self-innovation Foundation [11041810351 to J.G.]; Jiangsu Agricultural Science and Technology Independent Innovation Fund [CX (17) 3014 to D.B.Y.]; Fundamental Research Funds for the Central University (Huazhong Agricultural University) [2662017JC048 to X.H.N.]. Funding for open access charge: Jiangsu Agricultural Science and Technology Independent Innovation Fund [CX (17) 3014 to D.B.Y.].
Conflict of interest statement. None declared.
REFERENCES
1.
2.
3.
4.
5.
7.
8.
9.
10.
11.
12.
13.
14.
15.
16.
17.
18.
19.
20.
21.
22.
23.
24.
25.
26.
27.
28.
29.
30.
31.
32.
33.
34.
35.
36.
37.
38.
39.
40.
41.
42.
43.
44.
45.
46.
47.