 STAB: a spatio-temporal cell atlas of the human brain
Nucleic Acids Research


- Altmetric
The human brain is the most complex organ consisting of billions of neuronal and non-neuronal cells that are organized into distinct anatomical and functional regions. Elucidating the cellular and transcriptome architecture underlying the brain is crucial for understanding brain functions and brain disorders. Thanks to the single-cell RNA sequencing technologies, it is becoming possible to dissect the cellular compositions of the brain. Although great effort has been made to explore the transcriptome architecture of the human brain, a comprehensive database with dynamic cellular compositions and molecular characteristics of the human brain during the lifespan is still not available. Here, we present STAB (a Spatio-Temporal cell Atlas of the human Brain), a database consists of single-cell transcriptomes across multiple brain regions and developmental periods. Right now, STAB contains single-cell gene expression profiling of 42 cell subtypes across 20 brain regions and 11 developmental periods. With STAB, the landscape of cell types and their regional heterogeneity and temporal dynamics across the human brain can be clearly seen, which can help to understand both the development of the normal human brain and the etiology of neuropsychiatric disorders. STAB is available at http://stab.comp-sysbio.org.
INTRODUCTION
The brain is functionally divided into distinct regions that are composed of diverse molecularly defined cell types (1), where different regions are found to have specific cellular compositions (2,3). It has also been found that throughout the lifespan, the brain demonstrates dynamic cellular compositions and transcriptomic states (4–7). For example, during the development of human neocortex, the inter-area and inter-stage differentially expressed genes exhibit hourglass and twin-peak patterns, respectively (7,8). The abnormal transcriptional regulations within certain cells or cellular compositions have been implicated in neuropsychiatric diseases (9–11). For example, genes in upper layer excitatory neurons and microglia are recurrently affected in autism (12), and the ratio between excitation and inhibition neurons is increased as well (10,13). Therefore, the spatiotemporal landscape of cellular compositions as well as the underlying transcriptional regulations across the brain development will facilitate the understanding of brain functions and cellular mechanisms that underlie brain diseases (14).
Recently, with the advance in single-cell RNA sequencing (scRNA-seq) (15–19), it is becoming possible to explore the cellular compositions and characterize the gene expression dynamics of the human brain at single-cell resolution (3,20–25). For instance, Darmanis et al. identified major cell types of the human brain and characterized subtypes of neuronal cells, and observed dynamic transcriptomic changes between fetal and adult neurons (26). Lake et al. performed single-nucleus sequencing on cells from six brain areas of an adult human, and defined neuronal subtypes and found different cellular compositions within distinct regions (3). Accordingly, several public scRNA-seq databases have been constructed for the brain. For example, Polioudakis et al. have built a single-cell catalog of cell types for the mid-gestation human neocortex (14). The Allen Brain Cell Types Database contains single-nucleus sequencing data for middle temporal gyrus (MTG), anterior cingulate cortex (ACC) and primary visual cortex (V1C) of the adult human brain from 24 to 66 years (27). Despite those efforts for dissecting the cellular compositions of the human brain, most studies only focus on certain brain regions at specific stages during the lifespan (28). Considering the dynamic procedure of brain development and the heterogeneity of brain regions, a comprehensive spatio-temporal cell atlas of the human brain is highly demanded, which is important for better understanding the dynamic cellular compositions and molecular characteristics of the human brain during the lifespan.
Here, we present STAB, a Spatio-Temporal cell Atlas of the human Brain. By collecting single-cell transcriptome data from publicly available human scRNA-seq datasets and performing analyses with a unified protocol, STAB defines 42 cell subtypes across 20 brain regions and 11 developmental periods. With a user-friendly interface of STAB, the users could easily explore the cell subtype distributions across brain regions, the dynamic cellular compositions with development and the gene expression profiling in each cell subtype. The associations among certain genes, cell subtypes and brain disorders are also presented in STAB. This cell atlas presents a comprehensive cellular landscape of the human brain and provides insights into regional cellular heterogeneity and transcriptome dynamics along with development as well as cellular mechanisms underlying neuropsychiatric diseases.
MATERIALS AND METHODS
Data collection
We collected publicly available human scRNA-seq data as well as their metadata by searching PubMed and public databases, such as Gene Expression Omnibus (GEO) (29,30), Single Cell Portal of Broad Institute (https://singlecell.broadinstitute.org/single_cell) and scRNASeqDB (31). The single-cell or single-nucleus RNA sequencing datasets were retrieved with the following keywords: (i) scRNA, scRNA-seq, single-cell RNA seq, single-cell transcriptome and single-nucleus seq, in combination with (ii) brain, neural system and the name of specific brain regions. The datasets were further required to be generated from normal brain tissues without considering cell lines or brain organoids. As a result, 154 938 cells of 13 scRNA-seq datasets (4,7,21–23,26,27,32–36) were considered as shown in Table 1. To investigate the dynamics of brain cellular compositions and gene expression from embryonic to aging, we further assigned samples to distinct developmental periods (Supplementary Table S1) as described by Kang et al. (6). As a result, 20 human brain regions and 11 developmental periods (Supplementary Figure S1) were considered in STAB.

| Dataset | #Cells | #Filtered cells | Brain region | Age | Developmental period | Sequencing platform | Reference |
|---|---|---|---|---|---|---|---|
| h1 | 4261 | 1611 | PFC, MGE | PCW11–37 | P3, P4, P5, P6, P7 | Fluidigm C1 | Nowakowski et al., 2017 (23) |
| h2 | 466 | 416 | ITC, CTX | PCW16–18, 21–63Y | P5, P13, P14, P15 | Fluidigm C1 | Darmanis et al., 2015 (26) |
| h3 | 2394 | 2005 | PFC | PCW8–26 | P2, P3, P4, P5, P6, P7 | Smartseq2 | Zhong et al., 2018 (4) |
| h4 | 4664 | 3916 | TC, FC, IG, PC, OC, MDL, pons | PCW22, 23 | P6 | STRT-seq | Fan et al., 2018 (32) |
| h5 | 1512 | 701 | DFC, CTX, NCX | PCW5–20 | P1, P2, P5, P6 | Fluidigm C1 | Li et al., 2018 (7) |
| h5_a | 17093 | 16840 | DFC | 19–64Y | P12, P13, P15 | 10X | Li et al., 2018 (7) |
| h7 | 36166 | 33862 | CBC, FC, V1C | 20–49Y | P13, P14 | SNdrop-seq | Lake et al., 2017 (21) |
| h8 | 1977 | 1869 | VMB | PCW6–11 | P1, P2, P3 | Fluidigm C1 | La Manno et al., 2016 (33) |
| h10 | 11859 | 10747 | HIP, PFC | 40–65Y | P14 | DroNc-seq | Habib et al., 2017 (34) |
| h11 | 40453 | 39447 | SN | Adult | P14 | 10X | Welch et al., (35) |
| h12 | 276 | 252 | NCX | PCW16–23.5 | P5, P6 | Fluidigm C1 | Liu et al., 2016 (22) |
| h13 | 1608 | 476 | DFC | PCW16–20 | P5, P6 | Fluidigm C1 | Onorati et al., 2016 (36) |
| h14 | 32209 | 31905 | ACC, MTG, V1C | 22–66Y | P13, P14, P15 | Smartseq | Hodge et al., 2019 (27) |
ACC, anterior cingulate cortex; CBC, cerebellar cortex; CTX, cortex; DFC, dorsolateral prefrontal cortex; FC, frontal cortex; HIP, hippocampus; IG, insular gyris; ITC, inferior temporal cortex; MDL, medulla; MGE, medial ganglionic eminence; MTG, middle temporal gyrus; NCX, neocortex; OC, occipital cortex; PC, parietal cortex; PFC, prefrontal cortex; SN, substantia nigra; TC, temporal cortex; V1C, primary visual cortex; VMB, ventral midbrain; PCW, postconceptional weeks; Y, years; P1, 4 < = Age < 8 PCW; P2, 8 < = Age < 10 PCW; P3, 10 < = Age < 13 PCW; P4, 13 < = Age < 16 PCW; P5, 16 < = Age < 19 PCW; P6, 19 < = Age < 24 PCW; P7, 24 < = Age < 38 PCW; P12, 12 < = Age < 20 Years; P13, 20 < = Age < 40 Years; P14, 40 < = Age < 60 Years; P15, > 60 Years.
Processing of scRNA-seq datasets
To integrate the 13 scRNA-seq datasets collected above and remove batch effects of multiple datasets, the R package Seurat (v3.0.1) was employed here (37). In each dataset, we first removed cells without information about brain regions or developmental periods. To remove low-quality cells, empty droplets, cell doublets and multiplets, we checked the number of unique genes detected in each cell (Supplementary Figure S2) and discarded those cells that have extremely higher or lower unique gene counts (details can be found in Supplementary Table S2). For each gene in a cell, its expression level was normalized and defined as the ratio between its counts and the total counts of genes expressed in the cell, which was then multiplied by a scale factor (10 000 by default) and log-transformed. Given a dataset, the top 2000 genes with the highest expression variance across cells were determined for downstream analysis. Then, the anchors representing pairwise cell correspondences between single cells across datasets were identified, which enabled us to transform distinct datasets into a shared space and construct a harmoniously integrated scRNA-seq dataset.
Definition of cell subtypes
For each cell of the integrated scRNA-seq dataset, the expression level of highly variable genes in the cell was scaled along each gene, and principal component analysis (PCA) was then used for dimensionality reduction. Subsequently, the cells were grouped into 56 clusters with ‘FindCluster’ function using the first 30 PCs with a resolution of 2.
With the utilization of classical marker genes (i.e. SOX2, SLC17A7, GAD1, MBP, PCDH15, APBB1IP, AQP4, FLT1 and PDGFRB) (21,38), the 56 clusters were first assigned to major cell types, including neural progenitor cells (NPC), excitatory neurons (ExN), inhibitory neurons (InN), oligodendrocytes (Olig), oligodendrocyte progenitor cells (OPC), microglia (Micro), astrocytes (Astro), endothelial cells (Endo) and pericytes (Perc) (Supplementary Figure S3A and S3B). In particular, the clusters with high expression of both neuronal and non-neuronal marker genes were excluded from consideration. Compared with the cell type labels described in the original studies from which the datasets were retrieved, the cell types defined by our cellular clusters had a concordance rate of 92.3% (Supplementary Figure S3C), indicating the confidence of our cell types defined here. With differentially expressed genes (DEGs) detected with the Wilcoxon test (adjusted P value < 0.05), two clusters were merged if the number of DEGs between the two clusters was <3 with >2-fold change and <10 with >1.5-fold change. Finally, 42 cellular clusters (subtypes) of 144 047 cells were kept for further analysis and deposited in STAB (Figure 2A and Table 1).
Identification of marker genes for cell subtypes
Given the list of DEGs (adjusted P value < 0.05) in a cell subtype, the genes that were expressed at least 1.5-fold higher than the average of their expression in other subtypes were considered as marker genes of the cell subtype, where the genes were required to be expressed at least in 10% cells of the subtype. In addition, the marker genes defined for >4 subtypes were filtered out.
Database construction and implementation
STAB was implemented in Java with SpringBoot, Ngnix, Tomcat, Mybatis and MySQL for back-end data interaction, and React for the front-end display. Both visualization and statistical analyses were performed with R, where the gene expression profiles were visualized with the R-package ‘plotly’. The association of a query gene list with a certain cell subtype was performed with enrichment analysis of the cell type marker genes over the query gene set, where one-tailed Fisher’s exact test was adopted here with genes expressed in >10% cells as background. The interactive browser of individual cell subtypes was accomplished with the UCSC cell browser (https://cells.ucsc.edu). With a user-friendly interactive interface, the users can easily browse and query cell subtypes and their gene expression profiling across brain regions and developmental periods.
RESULTS
Overview of STAB
STAB is built to present the distribution of cell subtypes across brain regions and their temporal dynamics during the lifespan. Figure 1 shows the functionalities provided by STAB. The ‘Cell subtype’ page presents the spatial and temporal distribution as well as the expression profiles of representative marker genes of a certain cell subtype. The relative composition proportion of distinct cellular subtypes is approximately obtained by assuming the same number of cells in each brain region and each period. The marker genes include classical marker genes of major cell types and those defined above. The ‘Brain region’ and ‘Developmental period’ pages show the compositions of different cell subtypes across periods/brain regions for the selected brain region/period. Moreover, given a gene, the expression dynamics of the gene for each cell subtype across brain regions in a certain developmental period and that across distinct developmental periods in a selected brain region will be shown. The ‘Cell browser’ page shows the metadata of each individual cell and marker genes of the clusters with the utility of the UCSC Cell Browser. For better visualization, at most 500 cells are randomly shown for each combination of a period and a region. Given a list of genes of interest, the ‘Query’ page can present the expression levels of those genes across cell subtypes and help identify which cell subtypes these genes are most enriched in.

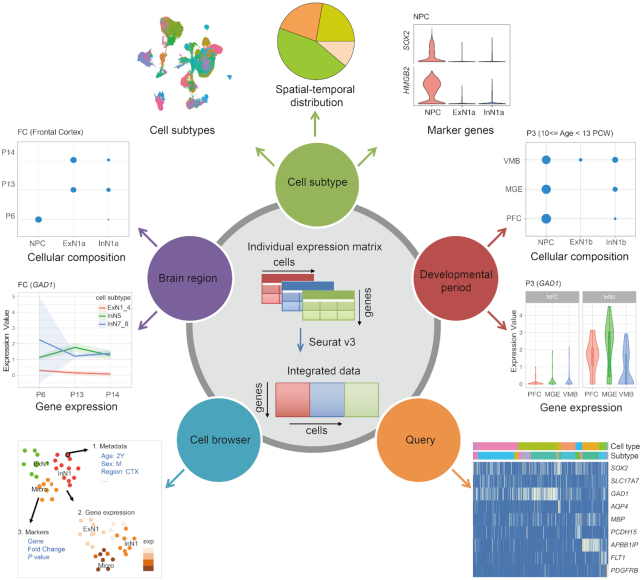
Schematic overview of functionalities provided by STAB.
Landscape of cell subtypes across the human brain
With the integrative analysis of 13 scRNA-seq datasets, 42 cell subtypes were identified as shown in Figure 2A, including 1 neural progenitor cell cluster, 15 excitatory neuron subtypes, 10 inhibitory neuron subtypes, 1 granule, 1 Purkinje cell type and 14 non-neuronal subtypes. We noticed that the majority of our defined cell subtypes were evenly distributed among developmental periods, brain regions and datasets (Supplementary Figures S4 and S5), indicating that the batch effects and bias have been well controlled.
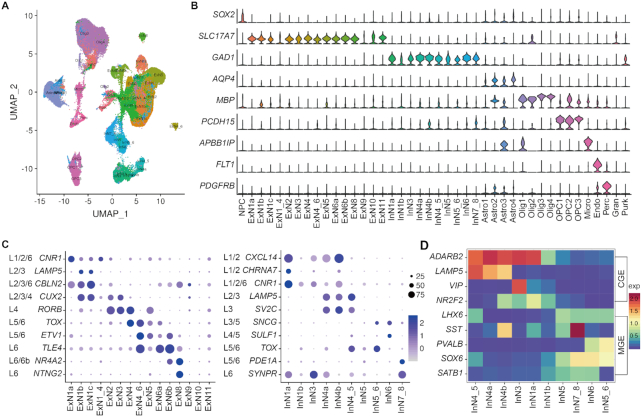
Landscape of cell subtypes with their marker genes. (A) The identified cell subtypes. (B) The expression of classical marker genes for major cell types. (C) Expression of layer-specific marker genes in excitatory (left) and inhibitory (right) neuron subtypes. The size and color of the dot denote the percentage of cells expressing corresponding layer-specific marker genes and the expression value of the gene averaged over a certain cell subtype, respectively. (D) Heatmap of expression levels for marker genes associated with sub-pallial origins (MGE, CGE) and neurotransmitter for inhibitory neuron cell subtypes.
We resolved neuronal cells into 15 ExN and 10 InN neuronal subtypes with the utility of classical marker genes SLC17A7 and GAD, respectively (Figure 2B). The neuronal subtypes were further annotated based on the expression of subtype marker genes identified from a previous single-nucleus RNA-seq dataset of six cortical regions (39) (Supplementary Figure S6). Among the 25 neuronal subtypes, 22 subtypes were consistent with previously defined ones. In addition to the high correspondence, STAB provides a finer resolution of these into subpopulations (e.g., ExN1 subtype was resolved into ExN1a, 1b and 1c). Besides, 3 novel subtypes (e.g., ExNs 9–11) showing lower expression levels of all those marker genes were identified.
It has been found that most neurons can be categorized by their cortical layer position (3,40). Consistent with these findings, we noticed that most of our defined neuronal subtypes showed layer-specific patterns with higher expression of layer-specific marker genes (Figure 2C). For example, ExNs 1–3 and InNs 1–3 mainly located in the upper layer, ExNs 4–6 and InNs 4–6 in the middle layer, and ExNs 7–8 and InNs 7–8 in layer 6. The cell subtypes of ExNs 9–11 without showing any layer specificity, mainly consisted of cells from embryonic or a mixture of embryonic and adult samples (Supplementary Figure S7), indicating layer-specific transcriptional patterns might emerge at the later maturing stage. We further explored the developmental origin and the expressed neurotransmitter of neurons with the markers. For example, the somatostatin-expressing (SST+) neurons (InN4b, InN7_8) and parvalbumin-positive (PVALB+) subtypes (InN5_6, InN6) mainly originated from medial ganglionic eminence (MGE), while vasoactive intestinal peptide-expressing (VIP+) cells (InN3) originated from caudal ganglionic eminence (CGE). The composition and developmental origin of inhibitory neurons cell subtypes coincide with previously reported GABAergic cell type taxonomy (38).
Except for neuronal cells, STAB also provides a comprehensive cellular landscape of non-neuronal cell subtypes. Here, we resolved 14 non-neuronal subtypes, including 4 astrocytes and 4 oligodendrocytes (Supplementary Figures S8 and S9) and 3 oligodendrocyte progenitor cells subtypes, and microglia, endothelial and pericytes cell-subtypes. These cell subtypes showed significant regional specificity. For instance, we noticed that Astro1 and Astro2 had higher abundance in the cerebellar cortex and dorsolateral prefrontal cortex, Astro3 and Astro4 were mainly distributed in the pons (Supplementary Figure S8B–E), and Olig2 cells were more specific in the cerebellar cortex (Supplementary Figure S9C).
Spatial specificity and heterogeneity of cell subtypes
With STAB, one can easily explore the distribution of cell subtypes within each brain region and the heterogeneity of cell subtypes across brain regions for a certain development period (Supplementary Figure S10). For example, at the late mid-fetal period (P6), the four cortex regions (FC, TC, OC and PC) had more neurons, whereas regions in the inferior surface (IG, MDL and pons) contained more glial cells (OPC, Olig, Micro and Astro) (Figure 3A and Supplementary Figure S11). Noted that cortex regions tended to have more cellular diversity and higher neuronal proportion compared with inferior surface regions, which may help explain the more complex neural circuits underlying the functions of the cerebral cortex. Especially, Olig4 and Olig3 were more abundant in the cerebral cortex and inferior surface, while astrocytes were more abundant in the pons, separately. Consistent with the cellular distribution differences of the cerebral cortex (3), we also noticed more inhibitory neurons in the temporal cortex and more excitatory neurons in the other three cortex regions. Those emphasized the heterogeneity of cellular compositions in various brain regions.
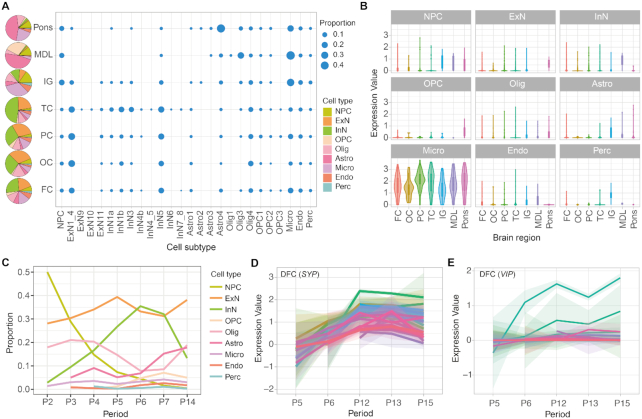
Spatiotemporal heterogeneity of cell (sub)types. (A) The cell type (left) and subtype (right) composition of each brain region at period 6 (late mid-fetal). (B) Expression of CD68 in different cell types across brain regions at P6. (C) The dynamic cellular compositions with the development of PFC. (D–E) The expression trajectories of SYP and VIP genes within different cell subtypes along the development of DFC. The shaded bands denote 95% confidence intervals.
Given cell subtypes showing region-specific expression patterns (32), the spatially functional specificity could be reflected by the different expression levels of related genes in cells. For example, CD68, a classical gene related to the activation state of microglia (41), presented varied expression levels in brain regions (Figure 3B), suggesting distinct activated or primed states of microglia among regions. Above all, the composition and expression data in STAB could help to explore the anatomical and functional heterogeneity of cell types in distinct brain regions.
Temporal dynamics of cellular compositions and transcriptome
With STAB, one can observe the dynamic cellular compositions of certain brain regions across the development of human brains. For example, in the PFC region (Figure 3C and Supplementary Figure S12), higher cellular diversity could be observed in adult than fetal periods. The progenitor cells decreased rapidly during the early to middle fetal period (P2-P6), while the proportion and diversity of excitatory and inhibitory neurons increased as expected during those periods. Astrocytes increased from late mid-fetal (P6) and late fetal (P7) period, and Olig3 gradually replaced Olig4 in the fetal development (P2-P7) and became the major oligodendrocyte subtype of adulthood (P14). On the other hand, the non-neural cells were less dynamic compared with neural cells.
In addition to exploring the dynamics of cellular compositions during brain development, one can also gain insight into neurodevelopment by investigating the expression trajectories of certain genes via STAB. For instance, the expression of SYP, a synapse development associated gene (42), increased from middle to late fetal (P5-P6) until adolescence (P12) and then declined with aging (Figure 3D). Likewise, the developmental trajectory of cell (sub)types could be tracked by their marker genes. We noticed that the expression of VIP, the marker gene of interneuron 3, increased from fetal period to adolescence in InN3, but the gene kept steady low expression levels in other cell subtypes during the same periods. With the temporal dynamics of cellular compositions and transcriptome states across development, we can better understand brain development.
The aberrant cell subtypes in brain disorders
It has been found that some brain disorders are related to certain cell types, which can help understand the cellular mechanisms underlying neurodegenerative and neuropsychiatric diseases. For example, autism spectrum disorder (ASD) is at least partially due to disorders affecting glial cells or neuron–glial interaction (43–45). With STAB, one can explore which cells are related to certain brain disorders, including Parkinson’s disease (PD), Alzheimer’s disease (AD), amyotrophic lateral sclerosis (ALS), ASD, Huntington’s disease (HD) and bipolar disorder (BP). The genes associated with these disorders (46–51) can be found in Supplementary Table S3. As a control, the height phenotype was considered here and the associated genes were obtained from a previous genome-wide association study (52).
As a negative control, we found that the genes associated with human height were not enriched in any of the 42 cell subtypes. On the other hand, the genes associated with brain disorders tend to be enriched in neuronal cells. We noticed that the adult-onset neurological diseases (PD, AD, ALS and HD) were more enriched in ExN11 cells, while the early-onset psychiatric disorders ASD and BP were more enriched in ExN9 cells, agreed with the expression profiles among diseases with the same phenotype are more similar (53). Besides, specific enriched cell subtypes were also identified, such as InN5 in ALS, Astro3 and Micro in MS. The shared and distinct enriched patterns might reflect the common and specific cellular and developmental context and etiology of brain disorders underlying phenotypes.
Take ASD as an example, we checked the expression of highly confident (i.e., category 1) ASD (hcASD) risk genes from SFARI (https://gene.sfari.org) in STAB (Figure 4B). Consistent with previous reports that ASD risk genes were enriched in early glutamatergic neurons (53,54), several hcASD risk genes were highly expressed in the developing excitatory neurons (i.e., ExN9 and ExN10). We found some risk genes (e.g., DSCAM, NRXN1, TRIO and SETD5) were enriched and showed higher expression in OPCs, suggesting cell types involved in the maintenance of the perineural environment may also mediate ASD. Moreover, we further explored the expression of DSCAM, one of the most highly expressed hcASD risk genes and is known involved in human central and peripheral nervous system development (55), across cell subtypes along with development in the neocortex regions (Figure 4C and D for PFC and DFC, respectively). DSCAM had a higher expression level in the ASD enriched subtypes (i.e., ExNs9–10 and OPCs), and increased during early to middle fetal development, which was concordant with the expression trend found in bulk RNA-seq for neocortex (6). This suggested that middle fetal may be a key developmental period associated with the etiology of ASD, consistent with the conclusion from a previous study (56).
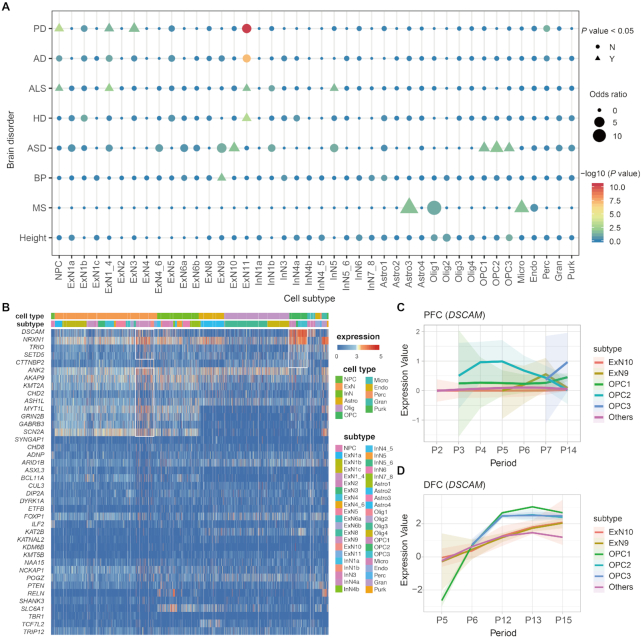
Cell subtypes associated with brain disorders. (A) The distribution of cell types associated with neurodegenerative and neuropsychiatric diseases. (B) The heatmap of expression of high confident ASD genes across various cell (sub)types. (C andD) The expression dynamics of DSCAM within different cell subtypes in PFC and DFC along with development.
In summary, STAB could capture both the enriched (associated) cell types and the gene expression profiles of the risk genes for neurodegenerative and neuropsychiatric diseases, highlighting the significance of our brain cell atlas.
DISCUSSION
STAB is a comprehensive cell atlas resource for the human brain, covering multiple brain regions from early fetal to adolescence and aging. With cell subtypes and their marker genes defined by a unified-pipeline, STAB resolves cell types at a finer resolution and enables one to explore the cellular compositions and transcriptome states of distinct brain regions across the development in an objective way. Furthermore, the marker genes associated with each cell subtype and the functional enrichment analysis provided by STAB make it possible to investigate the associations between cell subtypes and phenotypes of interest, e.g., neuropsychiatric disorders.
We also notice that there is much room for STAB to improve. First, only part of the developmental periods or brain regions is covered due to the difficulties to obtain brain tissues. With brain organoids available, it is possible to cover more regions and periods in the future. Second, the big difference between the number of cells (from 200+ to 30,000+) and the sequencing depth of distinct datasets makes it challenging to remove batch effects. Despite the high concordance between cell types defined in STAB with those reported in literatures, it is not guaranteed that all cell types are correctly defined. Finally, the limited quantity and sampling inhomogeneity of cells make it hard to estimate the exact proportions among various types of cells.
DATA AVAILABILITY
STAB is publicly available at http://stab.comp-sysbio.org. The curated expression and metadata and data grouped by developmental periods, brain regions, and datasets are available at STAB.
The raw datasets were obtained with the following links:
h1: https://cells.ucsc.edu/cortex-dev/exprMatrix.tsv.gz
h2: https://www.ncbi.nlm.nih.gov/geo/query/acc.cgi?acc=GSE67835
h3: https://www.ncbi.nlm.nih.gov/geo/query/acc.cgi?acc=GSE104276
h4: https://www.ncbi.nlm.nih.gov/geo/query/acc.cgi?acc=GSE103723
h5: http://development.psychencode.org/#
h5_a: http://development.psychencode.org/#
h7: https://www.ncbi.nlm.nih.gov/geo/query/acc.cgi?acc=GSE97942
h8: https://www.ncbi.nlm.nih.gov/geo/query/acc.cgi?acc=GSE76381
h10: http://www.gtexportal.org/home/
h11: https://www.ncbi.nlm.nih.gov/geo/query/acc.cgi?acc=GSE126836
h12: https://www.ncbi.nlm.nih.gov/geo/query/acc.cgi?acc=GSE71315
h13: https://www.ncbi.nlm.nih.gov/geo/query/acc.cgi?acc=GSE81475
SUPPLEMENTARY DATA
Supplementary Data are available at NAR Online.
FUNDING
National Natural Science Foundation of China [61932008, 61772368]; Shanghai Municipal Science and Technology Commission [2018SHZDZX01]; Shanghai Science and Technology Innovation Fund [19511101404].
Conflict of interest statement. None declared.
REFERENCES
1.
2.
3.
4.
6.
7.
8.
9.
10.
11.
12.
13.
14.
15.
16.
17.
18.
19.
20.
21.
22.
23.
24.
25.
26.
27.
28.
29.
30.
31.
32.
33.
34.
35.
36.
37.
38.
39.
40.
41.
42.
43.
44.
45.
46.
47.
48.
49.
50.
51.
52.
53.
54.
55.