 m6A-Atlas: a comprehensive knowledgebase for unraveling the N6-methyladenosine (m6A) epitranscriptome
Nucleic Acids Research


The authors wish it to be known that, in their opinion, the first five authors should be regarded as Joint First Authors.

- Altmetric
N 6-Methyladenosine (m6A) is the most prevalent RNA modification on mRNAs and lncRNAs. It plays a pivotal role during various biological processes and disease pathogenesis. We present here a comprehensive knowledgebase, m6A-Atlas, for unraveling the m6A epitranscriptome. Compared to existing databases, m6A-Atlas features a high-confidence collection of 442 162 reliable m6A sites identified from seven base-resolution technologies and the quantitative (rather than binary) epitranscriptome profiles estimated from 1363 high-throughput sequencing samples. It also offers novel features, such as; the conservation of m6A sites among seven vertebrate species (including human, mouse and chimp), the m6A epitranscriptomes of 10 virus species (including HIV, KSHV and DENV), the putative biological functions of individual m6A sites predicted from epitranscriptome data, and the potential pathogenesis of m6A sites inferred from disease-associated genetic mutations that can directly destroy m6A directing sequence motifs. A user-friendly graphical user interface was constructed to support the query, visualization and sharing of the m6A epitranscriptomes annotated with sites specifying their interaction with post-transcriptional machinery (RBP-binding, microRNA interaction and splicing sites) and interactively display the landscape of multiple RNA modifications. These resources provide fresh opportunities for unraveling the m6A epitranscriptomes. m6A-Atlas is freely accessible at: www.xjtlu.edu.cn/biologicalsciences/atlas.
INTRODUCTION
A variety of chemical modifications are naturally decorated on cellular RNAs, modulating their biogenesis, stability and functions (1). To date, >150 types of RNA modifications have been identified (2), among which, N6-methyladenosine (m6A) is the most pervasive and the most intensively studied non-cap reversible marker present on eukaryotic messenger RNAs (mRNAs) and long non-coding RNAs (lncRNAs) (3). Recent studies suggest that m6A plays a pivotal role during various biological processes including virus infection (4), stress (5), heat shock (6) and DNA damage (7), and regulates molecular functions such as RNA–protein interaction (8), RNA stability (9) and translation efficiency (10). Additionally, dysregulation of m6A has been linked to a number of diseases including multiple cancers, such as leukemia and glioma (11).
A number of high-throughput experimental approaches have been developed for profiling the transcriptome-wide distribution of m6A RNA modification, including, most notably, the antibody-based approach m6A-seq (or MeRIP-seq) (12,13). With m6A-seq, it is possible to identify condition-specific m6A sites (14–16), quantify the m6A methylation levels (17,18), or compare between experimental conditions (17–19). Despite the limits of m6A-seq regarding the reproducibility, data quality and mediocre resolution (around 100bp) (20,21), this technology has been widely applied to characterize the m6A epitranscriptome under various biological contexts in more than 30 organisms since its invention in 2012. Besides m6A-seq, there are also recent techniques such as PA-m6A-seq (22), miCLIP (23) and m6A-CLIP (24), that offer improved or even base-resolution epitranscriptome determination. However, these approaches report primarily the precise location of m6A sites in physical, and are unsuitable for quantification of m6A methylation levels.
To date, several bioinformatics websites and databases have been constructed aiming to properly collect, annotate, share and interpret the rapidly growing knowledge in RNA modifications (2,25–29). Among them, MODOMICS (2) is an RNA modification database concerning primarily the RNA chemical structure, corresponding biosynthetic pathways and RNA-modifying enzymes. RNAmod (29) can be used for visualizing, annotating and comparing RNA modification profiles in 21 species. MetDB (25) is the first epitranscriptome database collecting m6A sites on mRNAs and lncRNAs (rather than small RNAs) reported from high-throughput sequencing approaches. The most recent release (version 2.0) of MetDB hosted m6A sites in seven species collected from 185 m6A-seq experiments. RMBase (26) is currently the most comprehensive epitranscriptome database containing ∼1 397 000 RNA modification sites among 13 species including m6A and other RNA modifications such as m5C and m1A. Additionally, m6AVar collected disease-associated genetic mutations that may functions through their impact on reversible m6A RNA methylation (30). These works addressed various aspects of RNA modifications, and together greatly improved our understanding of the epitranscriptome. Nevertheless, the m6A site collections in existing epitranscriptome databases (MetDB and RMBase) suffer from the following two major limitations:
Limited reliability: m6A-seq is today the most widely adopted experimental approach to profiling the m6A epitranscriptome, and is responsible for most available m6A data. Although m6A-seq offers only a mediocre resolution (∼100 bp), the precise location of the m6A sites may be narrowed down to base-resolution by searching for the m6A forming motif DRACH within the regions enriched with m6A signal (or m6A peaks). Most existing epitranscriptome databases, including MeTDB and RMBase, relied on this very simple strategy to enhance the resolution of m6A-seq. However, this strategy cannot differentiate random-occurring motifs from real m6A-containing ones, resulting in false positive predictions. For this reason, it is not surprising that both MeT-DB (426,544sites) and RMBase (477,452 sites) reported a very large number of transcriptome m6A sites in human, many of which may be false positive due to the possibility of the RRACH motif (where R = G or A, H = A, C or U, and the A stands for adenosine being modified to m6A) (31) being located close to a real m6A site (or within an m6A peak). In a previous study (32), we systematically evaluated the positional information in existing m6A databases highlighting major concerns regarding its reliability, with only limited AUROC (Area under Receiver Operating Characteristic) between 0.736 and 0.798. This is even less reliable than the classic sequence-based m6A site predictor SRAMP (33).
Binary profiles: Condition-specific epitranscriptome profiles are available in MetDB (25) and REPIC (28). However, they collected only binary profiles, i.e. whether an m6A methylation site exists or not under a specific biological condition, but did not provide quantitative measurements with regards to the degree of methylation levels. Although prone to various artifacts and noise such as batch effect, GC content bias and varying efficiency of immunoprecipitation (18,20,21), the most abundant epitranscriptome m6A-seq data does contain the necessary information for a rough quantification of the methylation levels for m6A sites. This is often presented as the fold enrichment of reads in the IP samples compared to the input control samples. A number of statistical models have been developed based on the quantitative information contained in m6A-seq for detecting and assessing the significance of m6A sites (peaks) (15,16,34), or for comparing the changes in terms of the methylation levels in a case-control study (17,35,36). Clearly, a quantitative epitranscriptome profile with robust estimates of the methylation levels for every single m6A site would provide more insights than the binary profiles hosted by existing epitranscriptome databases.
To address these limitations, we constructed m6A-Altas, a comprehensive knowledgebase for unraveling the N6-methyladenosine (m6A) epitranscriptome. Compared to existing databases, m6A-Atlas features a high-confidence collection of reliable m6A sites identified from base-resolution technologies only (rather than non-base-resolution technique combined with motif analysis) and the quantitative (rather than binary) condition-specific epitranscriptome profiles estimated from a large number of high-throughput sequencing samples covering various tissues and cell lines. It also offers novel features, such as, the conservation of m6A sites among seven vertebrate species (including human, mouse and chimp), the epitranscriptomes of 10 virus species (including HIV, KSHV and DENV) and their host cells, the putative biological functions of individual m6A sites predicted from epitranscriptome data with the guilt-by-association principle, and the potential pathogenesis of human m6A sites inferred from disease-associated genetic mutations that can destroy m6A specifying sequence motif. A user-friendly graphical user interface was constructed to support the query, visualization and sharing of the m6A epitranscriptomes annotated with potential sites relating to downstream processes (TF binding, RBP-binding, microRNA interaction and splicing sites) and the positions of other known RNA modifications. These resources provide researchers with new tools for unraveling the m6A epitranscriptomes. The design of m6A-Atlas is shown in Figure 1.

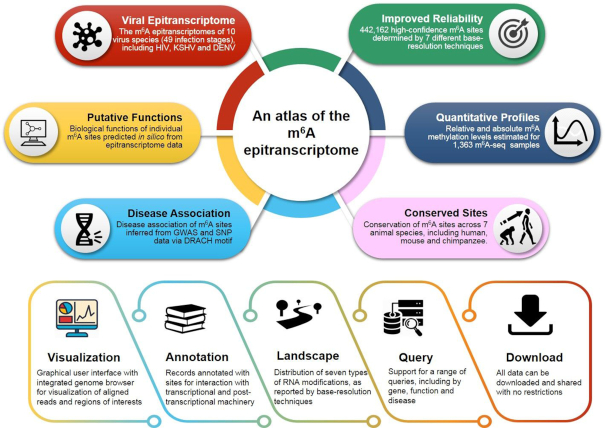
The overall design of m6A-Atlas. m6A-Atlas features a high-confidence collection of reliable m6A sites and quantitative epitranscriptome profiles. It also provides the conservation, sites for post-transcriptional machinery, putative biological functions and disease-association of individual m6A sites, and the epitranscriptomes of host and virus during infection.
MATERIALS AND METHODS
High-confidence collection of m6A sites
High-confidence m6A sites were collected from 67 datasets generated by seven different base-resolution technologies, covering seven species, including human, mouse, rat, zebrafish, fly, Arabidopsis and yeast. The positional information was directly obtained from the original papers or relevant NCBI GEO datasets (37) (Supplementary Table S1).
Quantification of m6A methylation levels
A total of 1363 m6A-seq samples profiling the epitranscriptomes in seven species were collected (Supplementary Tables S2–S4), and used to quantify the methylation levels of the high-confidence m6A sites detected from base-resolution techniques. The raw m6A-seq datasets were directly downloaded from NCBI GEO (37) and Genome Sequence Archive in BIG Data Center (38). Adaptors and low quality nucleotides were removed by Trim Galore, and the processed reads were aligned to the reference genome by HISAT2 (39). The m6A level is calculated by the fold enrichment of reads in the IP samples compared with the input control samples within the 200 bp window of a given m6
A site. It has been the most widely adopted way to quantify the methylation status, and is closely related to the peak calling process that usually seeks genomic regions with fold enrichment of >1 at a pre-defined significance level. Besides m6A methylation levels, the matched transcriptional expression profiles (gene RNA expression levels in FPKM) were also estimated from the input control samples of m6A-seq data with Cufflinks (40) to facilitate comparative analysis.
Viral and host epitranscriptomes
Recent studies suggested critical roles of m6A on viral transcripts such as escaping from recognition by the RNA sensor RIG-I (41); unfortunately, this information has not been available in existing epitranscriptome databases. A total of 278 m6A-seq samples profiling the epitranscriptomes during virus infection were collected (Supplementary Table S4). The data covered different infection stages of 10 virus species. The m6A sites located on viral transcripts were detected by exomePeak2 (16) from m6A-seq data, and are thus not at base-resolution as previously explained.
Conservation of m6A sites in vertebrate
Conservation analysis is a powerful way for identifying the functionally important m6A sites (42,43). By integrating and comparing a large number of m6A sites across different species, we provided the first comprehensive profile of the conserved epitranscriptome in vertebrates at single-base resolution. During the cross-species comparison, the m6A sites of one species were mapped to the homologous coordinates of a target organism using the LiftOver tool from the UCSC genome browser (44). Where the converted sites are also m6A sites or located within the peaks enriched with m6A signal in the target organism (for pig, monkey and chimpanzee, where only m6A-seq data is available), these sites were considered conserved between the two species. Besides, the phastCons score (45) of the queried locus was also returned, showing the conservation of the corresponding genome region of the RNA methylation site.
Putative functions of individual m6A sites
The putative biological functions of individual m6A sites were predicted for the conserved sites between human and mouse according to the guilt-by-association principle, as previously described (46). This method is based on the association of methylation patterns (or co-methylation) among functionally related m6A sites inferred from the collected quantitative epitranscriptome data (detailed in Supplementary Materials: Functional Prediction of Individual m6A Sites and Supplementary Figure S2). The predicted biological functions of the m6A sites may help generate hypotheses for subsequent experimental validation. Please note that GO prediction was made from the epitranscriptome profiles of individual m6A site (rather than entire gene), and thus can only predict site-specific GO functions.
Potential involvement of individual m6A sites in pathogenesis
Inspired by m6AVar (30), the potential involvement of individual m6A sites in pathogenesis was inferred from disease-associated genetic mutations that directly destroy the m6A forming motif DRACH. For such mutations pathogenesis may result from the impact on epitranscriptome regulation of elimination of an m6A site. The germline and the somatic mutations required for this analysis were downloaded from dbSNP (47) and The Cancer Genome Atlas (TCGA) (48), respectively; while the disease-association of mutations were obtained from the GWAS catalog (49) and ClinVar (50).
Basic annotation for m6A sites
The splicing sites, miRNA target sites, RBP-binding sites and subcellular location were integrated to help understand the regulatory roles of m6A. The splicing sites and subcellular location were obtained from the UCSC database (51) and RNALocate, respectively. The miRNA target sites and RBP-binding sites in human were obtained from starBase (52) and POSTAR (53). Transcriptional regulation data (ChIP-seq and DNase-seq) were obtained from the GTRD database (54) and TRlnc (55), respectively.
Landscape of m6A and other RNA modifications
Existing databases only focus on individual sites. To help understand the clustering effects (56–58) and the synergy (59,60) of m6A and other RNA modifications, we provide the landscape of multiple RNA modifications on the same gene so as to provide a more comprehensive overview. To do so, a total of 96 datasets generated from base-resolution technologies were collected (Supplementary Table S5), covering six other RNA modifications in human, including 5-Methylcytosine (m5C), Pseudouridine (Ψ), N6,2-O-dimethyladenosine (m6Am), N1-methyladenine (m1A), N7-methylguanosine (m7G) and 2′-O-methylation (Nm). For mouse, we integrated m5C, m1A and Ψ with m6A modification; and we integrated m1A and Ψ for yeast epitranscriptomes.
Database and web interface implementation
MySQL tables were exploited for the storage and management of the metadata in m6A-Atlas. Hyper Text Markup Language (HTML), Cascading Style Sheets (CSS) and Hypertext Preprocessor (PHP) were used to construct the web interface. The multiple statistical diagrams were presented by EChars, and the Jbrowse genome browser (61) was implemented for interactive exploration and visualization of relevant records.
RESULT
A high-confidence collection of 442,162 unique m6A sites identified from seven base-resolution technologies were collected, covering seven organisms, including human (178,049 sites), mouse (110 959 sites), rat (6348 sites), zebrafish (63 998 sites), fly (36 913 sites), Arabidopsis (35 332 sites) and yeast (10 563). Please see Supplementary Table S6 for a pair-wise comparison of data generated from seven base-resolution technologies. For the epitranscriptome landscape view, we integrated 96 profiles generated from base-resolution technologies only, covering six other RNA modifications, including m5C (95 391 sites), m1A (16 346 sites), Ψ (3137 sites), m6Am (2447 sites), m7G (2525 sites) and Nm (1835 sites). This is, to date, the most comprehensive collection of high-confidence transcriptome modification sites generated from base-resolution technologies. We also collected the m6A sites on viral transcripts from 10 virus species during 8 infection stages, including, hMPV, KSHV, HCV, RSV, HIV-1, DENV, WNV, ZIKV, HCMV and YFV. Analysis revealed a total of 5388 genetic mutations, linked to pathogenesis, which can destroy the m6A forming motif DRACH of these reliable m6A sites, potentially indirectly linking m6A function to 134 different types of disease.
Quantitative m6A profiles (methylation levels of every single m6A sites) were provided for 109 experimental conditions (different cell line/tissue or treatments) in human, covering 46 human cell lines, 28 adult tissues and 8 fetal tissues. For mouse, there are a total of 80 epitranscriptome profiles covering 25 cell lines and 10 mouse tissues. The matched gene expression profiles are also available for comparative analysis, as it is often beneficial to focus on the methylation sites located on readily expressed genes.
Conservation analysis was performed among human, mouse, rat, zebrafish, pig, monkey and chimpanzee to identify the conserved m6A sites between two vertebrate species (see Table 1). Around 22 000 m6A sites (located on 6193 human genes) were found to be conserved between human and mouse, representing 12.45% and 20.15% of the m6A sites in human and mouse, respectively, and are strongly enriched near the stop codons on mRNAs (Supplementary Figure S1). Putative GO (62) functions were predicted as previously described (46) for the conserved m6A sites, which are presumably functionally more important (detailed in Supplementary Materials).

| Human (178 049 sites) | Mouse (110 959 sites) | Rat (6348 sites) | Zebrafish (63 998 sites) | Chimpanzee (37 456 peaks) | Monkey (38 838 peaks) | Pig (121 409 peaks) | |
|---|---|---|---|---|---|---|---|
| Human | 22 359 (20.15%) | 1117 (17.60%) | 2823 (4.411%) | 20 757 (55.41%) | 16 832 (43.33%) | 22 245 (18.32%) | |
| Mouse | 22170 (12.45%) | 1709 (26.92%) | 1725 (2.695%) | 8749 (23.35%) | 7864 (20.24%) | 15 636 (12.87%) | |
| Rat | 1132 (0.635%) | 1729 (1.558%) | 76 (0.119%) | 245 (0.654%) | 256 (0.659%) | N/A | |
| Zebrafish | 2922 (1.641%) | 2063 (1.859%) | 86 (1.354%) | N/A | N/A | N/A |
Note: Base-resolution epitranscriptome datasets are available only for human, mouse, rat and zebrafish. For pig, monkey and chimpanzee, only m6A peaks called from m6A-seq data are available. N/A means that the UCSC LiftOver tool does not support the conversion of the homologous coordinates between the two species, and conservation analysis was not performed.
An atlas of m6A epitranscriptome (m6A-Atlas)
We constructed m6A-Atlas, a comprehensive knowledgebase for unraveling the N6-methyladenosine (m6A) epitranscriptome. The user-friendly web interfaces provided in m6A-Atlas enable users to search, browse, visualize and download the comprehensively annotated m6A data (see Table 2) by gene, disease, function, genomic location and specie. A genome browser was integrated for an interactive exploration of genome regions of interest. All data provided in the m6A-Atlas database can be freely downloaded or shared. We also integrated two powerful tools: the m6A-conservation-finder, which is used to identify the conserved m6A sites among a user-provided list of candidate sites, and the differential-m6A-finder, which returns the differentially methylated m6A sites between two experimental conditions. For the convenience of the users, detailed instructions on how to use m6A-Atlas were placed in the ‘help’ page. m6A-Atlas is freely accessible online at: www.xjtlu.edu.cn/biologicalsciences/atlas.
| Reliable m6A sites | Quantitative profiles | Basic annotation | Conservation in vertebrates | Putative functions | Landscape with six other RNA modifications | Disease association | |
|---|---|---|---|---|---|---|---|
| Human | Yes | Yes | Yes | Yes | Yes | Yes | Yes |
| Mouse | Yes | Yes | Yes | Yes | Yes | Yes | - |
| Rat | Yes | Yes | Yes | Yes | - | - | - |
| Zebrafish | Yes | Yes | Yes | Yes | - | - | - |
| Fly | Yes | Yes | Yes | - | - | - | - |
| Arabidopsis | Yes | Yes | Yes | - | - | - | - |
| Yeast | Yes | Yes | Yes | - | - | Yes | - |
Case study on lncRNA: MALAT1
Of interests here are the m6A RNA methylation sites on MALAT1, which encodes a 7.9 kb long non-coding RNA and is located at chromosome 11q13. Searching by gene ‘MALAT1’ at the front page of m6A-Atlas database returns a total of 142 m6A records related to MALAT1. This is consistent with our knowledge that MALAT1 is highly m6A-modified (63–66). It is possible to filter these records by technology (Figure 2A) or cell line/tissue (Figure 2B). After clicking an MALAT1 m6A site, more information is provided including the source of the record such as PubMed ID, GEO accession number, technology, cell line and treatment. The overall distribution of all the m6A sites located on MALAT1 together with their annotations is visualized in the ‘landscape’ section (Figure 2C), and can be downloaded when switching to its ‘Table’ view. It is clear from there that four MALAT1 m6A sites (located on chr11: 65267646, 65267843, 65267952 and 65270276, respectively, hg19 assembly) were repetitively detected by more than 10 base-resolution experiments, and all the four of them are conserved between human and monkey, suggesting their prevalence and potentially important functions. Specifically, the MALAT1 m6A site located at chr11:65257646 (supported by 13 experiments) were conserved between monkey (supported by one m6A-seq experiment) and mouse (supported by six base-resolution experiments) (Figure 2D). The biological functions of this site was predicted in silico and shown in the GO prediction panel. We can see that the m6A site exhibits co-methylation pattern with the m6A sites located on USP10, AGO2, TRAF7, etc. (Figure 2E), and network-based analysis predicts, according to the guilt-by-association principle, that it may be associated with a number of functions, such as, DNA synthesis involved in DNA repair (P-value = 0.01297), cell fate determination (p-value = 0.0454) and negative regulation of cell development (P-value = 0.00366) (Figure 2F). This is consistent with recent finding that m6A regulation of MALAT1 regulates tumorigenesis (67) and embryonic development (68). The methylation profiles of individual m6A site under >100 different biological contexts (cell line, tissue, treatment, virus infection, etc.) can be found under the ‘methylation level’ panel. It is possible to filter for a specific cell line or tissue of interests. The highest methylation level was found in iSLK.219 cell line. It is worth noting that the methylation level of this site is higher than 0 on almost all conditions covered, suggesting its prevalent existence and functionality. (Figure 2G). The matched RNA expression profiles of MALAT1 are also available in the gene expression panel for comparative analysis (Figure 2H). Additionally, post-transcriptional annotation suggests that the m6A site is in proximity to the binding position of microRNA hsa-miR-670-3p and 21 RNA binding proteins, including HRNPC, which may be immediately regulated through the m6A site. Interestingly, the regulation of interaction between MATLAT1 and HNRNPC via m6A methylation has been previously confirmed (69).
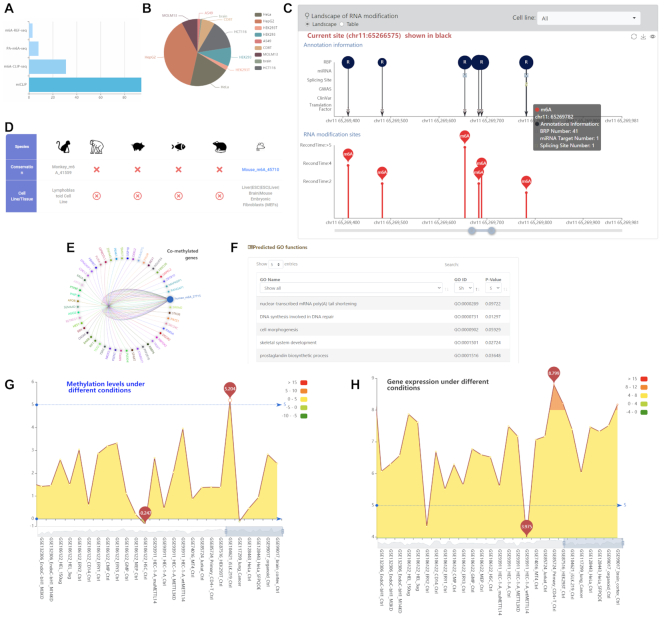
The m6A sites of MALAT1 and related information. (A and B) More than 100 m6A records of MALAT1 were detected from different technologies and in different cell lines/tissues. (C) The overall distribution pattern of m6A sites on MALAT1 transcript is illustrated together with their annotations. (D) An m6A site is conserved between human and mouse. (E) The m6A site is co-methylated with sites located on a few genes, which may suggest their functional relevance. (F) The predicted GO functions of an individual m6A site. (G) The methylation levels of an m6A site under different biological conditions. (H) The matched gene expression profiles of the m6A-carrying gene.
Case study on protein coding gene: SMAD3
SMAD3 (SMAD Family Member 3) has been shown previously shown to promote binding of the m6A methyltransferase complex to a subset of transcripts involved in early cell fate decisions (70). Of interests here is to check the m6A methylation status of this gene. Searching by gene ‘SMAD3’ at the front page of m6A-Atlas database returns a total of 44 m6A records related to MALAT1. It is possible to further filter these records by technology (Figure 3A) or cell line/tissue (Figure 3B). After clicking an MALAT1 m6A site, more information is provided including the source of the record such as PubMed ID, GEO accession number, technology, cell line and treatment. The overall distribution of all the m6A (and other RNA modification) sites located on MALAT1 together with their annotations can be visualized in the ‘landscape’ section (Figure 3C), and can be downloaded when switching to its ‘Table’ view. It is clear from there that four MALAT1 RNA modification sites (located on chr15: 67483526, 67358454, 67358455 and 67358461, respectively, hg19 assembly) were repetitively detected by more than 5 base-resolution experiments. However, only the first one (chr15: 67483526) is m6A RNA methylation site; the others three are all m5C sites. The m6A site located at chr15: 67483526 (supported by seven experiments) is conserved in monkey and chimp (both supported by one m6A-seq experiment) (Figure 3D). We can see from the ‘methylation level’ panel that, the methylation level (log2 fold enrichment) of this site is above 0 for almost all experimental conditions (Figure 3E), showing its prevalent existence and functionality. The highest methylation level was observed under A549 cell lines, and a strong demethylation of the site was observed after METTL3 is knocked down, suggesting the methylation of this site is likely to be METTL3-dependent. Importantly, the m6A-forming motif of this site DRACH may be destroyed by a known synonymous mutation (chr15: 67483526) relevant to Thoracic aortic aneurysm and aortic dissection (RCV000292705) and Loeys-Dietz syndrome (RCV000384686), which may indicate a disease-relevant mechanism that functions at the epitranscriptome layer (Figure 3F).
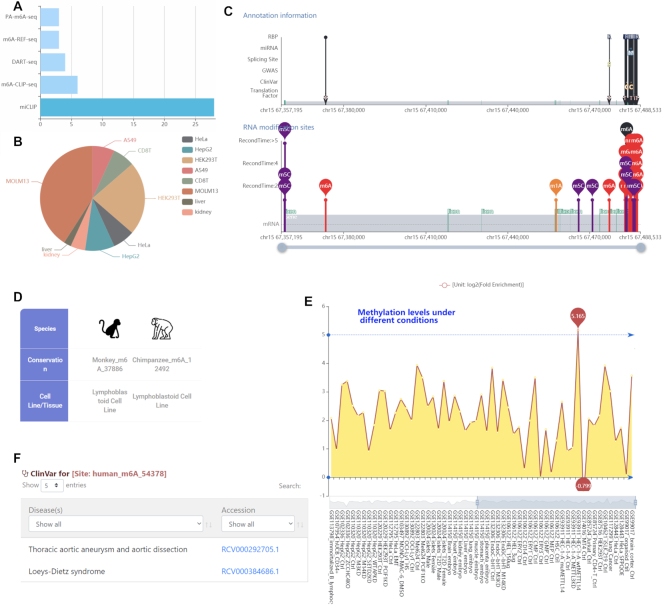
The m6A sites of SMAD3 and related information. (A and B) More than 40 m6A records of SMAD3 were detected from different technologies and in different cell lines/tissues. (C) The overall distribution pattern of m6A sites on MALAT1 transcript is illustrated together with their annotations. (D) An m6A site is conserved between human, mouse and Chimp. (E) The m6A site shows stable m6A signal (with log2 fold enrichment greater than 0) under different experimental conditions, suggesting its universal existence and prevalence. The highest methylation level was detected under A549 cell lines, and a strong demethylation of the site was observed after METTL3 is knocked down, suggesting the methylation of this site is likely to be METTL3-dependent. (F) A known disease-relevant germline mutation (chr15: 67483526) can destroy the m6A forming motif of this m6A site, linking it to epitranscriptome disease pathogenesis.
Case study: KSHV viral m6A
The ‘Virus’ page of m6A-Atlas provides the m6A sites located on the viral transcripts. Of interests here is the m6A methylation sites located on KSHV viral transcripts. After selecting KSHV at the ‘Virus’ page, a total 356 m6A sites were returned. Various information related to those sites were provided, including the position, source, strain, gene, width, etc., and it is possible to further narrow down the results by the infected cell line (Figure 4).
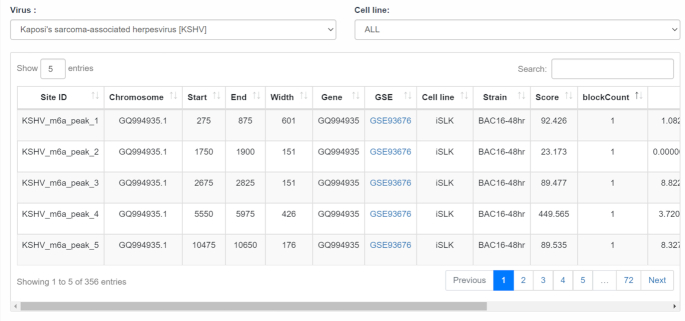
Viral m6A sites on KSHV transcripts. The 356 m6A sites located on KSHV viral transcripts detected under various conditions and infection stages.
CONCLUSION
As the most abundant and most intensively studied RNA modification, N6-methyladenosine (m6A) has been regarded as an important epigenetic mark regulating various stages of various aspects of RNA function. Centralized bioinformatics platforms are sorely needed to take advantage of the rapid accumulation of large amounts of epitranscriptome data. We present here m6A-Atlas, a comprehensive knowledgebase for the m6A epitranscriptome. Compared to existing epitranscriptome databases, m6A-Atlas features a high-confidence collection of reliable m6A sites and condition-specific quantitative (rather than binary) epitranscriptome profiles. It also offers novel features, such as, the conservation of m6A sites among seven vertebrate species (including human, mouse and chimp), the viral epitranscriptomes of 10 virus species (including HIV, KSHV and DENV), the putative biological functions of individual m6A sites predicted from epitranscriptome data, and the potential involvement in disease of individual m6A sites inferred from disease-associated genetic mutations that can destroy m6A specifying sequence motif. Please refer to Supplementary Table S7 for a brief comparison of m6A-Atlas with existing epitranscriptome databases focusing on RNA modification site collection. A user-friendly graphical user interface was constructed to support the query, visualization and sharing of the m6A epitranscriptomes annotated with potential interaction sites with the transcriptional and post-transcriptional machineries (TF binding, RBP-binding, microRNA interaction and splicing sites). The m6A data are also presented in the context of sites of six other RNA modifications, enabling an overview of the RNA modification landscape. These resources together provide fresh opportunities for studying the complexities of m6A epitranscriptomes.
ACKNOWLEDGEMENTS
Author contributions: K. Chen conceived the idea and initialized the project; K. Chen and J. Ma collected and processed the epitranscriptome data of eukaryotes and viruses, respectively; B. Song generated post-transcriptional annotations, conducted disease-association analysis and conservation analysis; X. Wu performed GO function prediction; Y. Tang designed and built the m6A-Atlas website; K. Chen drafted the manuscript. All authors read, critically revised and approved the final manuscript.
SUPPLEMENTARY DATA
Supplementary Data are available at NAR Online.
FUNDING
National Natural Science Foundation of China [31671373]; XJTLU Key Program Special Fund [KSF-T-01, KSF-E-51, KSF-P-02]. Funding for open access charge: National Natural Science Foundation of China [31671373]; XJTLU Key Program Special Fund [KSF-T-01, KSF-E-51, KSF-P-02]
Conflict of interest statement. Daniel J. Rigden is Executive Editor of NAR.
REFERENCES
1.
2.
3.
4.
5.
6.
7.
8.
9.
10.
11.
12.
13.
14.
15.
16.
17.
18.
19.
20.
21.
22.
23.
24.
25.
26.
27.
28.
29.
30.
31.
32.
33.
34.
35.
36.
37.
39.
40.
41.
42.
43.
44.
45.
46.
47.
48.
49.
50.
51.
52.
53.
54.
55.
56.
57.
58.
59.
60.
61.
62.
63.
64.
65.
66.
67.
68.
69.