 Multiple competing RNA structures dynamically control alternative splicing in the human ATE1 gene
Nucleic Acids Research


- Altmetric
The mammalian Ate1 gene encodes an arginyl transferase enzyme with tumor suppressor function that depends on the inclusion of one of the two mutually exclusive exons (MXE), exons 7a and 7b. We report that the molecular mechanism underlying MXE splicing in Ate1 involves five conserved regulatory intronic elements R1–R5, of which R1 and R4 compete for base pairing with R3, while R2 and R5 form an ultra-long-range RNA structure spanning 30 Kb. In minigenes, single and double mutations that disrupt base pairings in R1R3 and R3R4 lead to the loss of MXE splicing, while compensatory triple mutations that restore RNA structure revert splicing to that of the wild type. In the endogenous Ate1 pre-mRNA, blocking the competing base pairings by LNA/DNA mixmers complementary to R3 leads to the loss of MXE splicing, while the disruption of R2R5 interaction changes the ratio of MXE. That is, Ate1 splicing is controlled by two independent, dynamically interacting, and functionally distinct RNA structure modules. Exon 7a becomes more included in response to RNA Pol II slowdown, however it fails to do so when the ultra-long-range R2R5 interaction is disrupted, indicating that exon 7a/7b ratio depends on co-transcriptional RNA folding. In sum, these results demonstrate that splicing is coordinated both in time and in space over very long distances, and that the interaction of these components is mediated by RNA structure.
INTRODUCTION
Arginylation is a widespread post-translational protein modification that transfers an l-arginyl residue from the Arg-tRNA onto the polypeptide chain (1). It is mediated by the arginyl transferase encoded within Ate1 gene (2). Ate1 is essential in most eukaryotic systems and is implicated in the regulation of physiological pathways including proteolysis (3,4), response to stress and heat shock (5–7), embryogenesis (8–10), regenerative processes (11–13), and aging (14,15). Ate1 has recently been identified as a master regulator affecting disease-associated pathways (16–18), and its knockout results in embryonic lethality and severe developmental defects in mice (9,10,19,20).
Like many other eukaryotic genes, Ate1 generates several mRNA isoforms through alternative splicing (21). In mammals, they differ by mutually exclusive choice of two adjacent, homologous 129-bp exons (7a or 7b) and by alternative choice of the initial exon (1a or 1b) (22). The two major mRNA isoforms of Ate1 are Ate1-1 (1b7a) and Ate1-2 (1b7b), while the isoforms that contain both exon 7a and 7b are suppressed by mutually exclusive splicing (18). In mice, Ate1-1 and Ate1-2 are expressed stably in all tissues, but their ratio varies from 0.1 in the skeletal muscle to 10 in the testis (21,23,24). While Ate1-2 is almost completely cytosolic, Ate1-1 localizes in both cytosol and nucleus (21) and can specifically interact with Liat1, a testis-specific molecule (25). Furthermore, Ate1-knockout cells can form tumors in subcutaneous murine xenograft assays, in which the tumor growth can be partially rescued by the reintroduction of stably expressed Ate1-1, but not Ate1-2 (16). The isoforms Ate1-3 (1a7a) and Ate1-4 (1a7b) encode a variant of arginyl transferase that is specific for N-terminal cysteine with tissue-specific expression, cellular localization, and carcinogenic potential similar to those of Ate1-1 and Ate1-2, respectively (22). The ratio of Ate1 isoforms containing exons 7a and 7b switches substantially during male meiosis in mice suggesting a role in the mitotic-to-meiotic transition of the germ cell cycle (24). All these observations suggest that the sequences of amino acids encoded by exons 7a and 7b result in functionally distinct arginyl transferases.
To date, the mechanism underlying mutually exclusive splicing of exons 7a and 7b in Ate1 has not been studied in detail (18). Generally, MXE clusters are believed to evolve through tandem genomic duplications (26–28), and many of them implement mutually exclusive splicing through a mechanism that depends on competing RNA structures (29). Transcripts of such genes, of which Dscam (30) is the most fascinating example, contain multiple sites called the selector sequences that are all complementary to a regulatory element called the docking site. Only one of the competing base pairings can form at a time, which exposes only one exon in a cluster to the spliceosome and eventually leads to mutually exclusive splicing (29). In complex cases, several groups of docking and selector sequences can operate on a single gene creating a bidirectional control mechanism (31). A recent genome-wide study of MXE clusters conjectured that docking/selector systems may evolve spontaneously as a natural byproduct of tandem duplications, in which only one of the two arms of an ancestral stem–loop is duplicated (32,33).
Since exons 7a and 7b of Ate1 are homologous (nucleotide sequence identity 45%) and similar in length, and thus most likely have originated through a tandem genomic duplication, we questioned here whether their splicing is also controlled by competing RNA structures. Using comparative sequence analysis, we identified regulatory intronic elements in Ate1 pre-mRNA and examined their function in alternative splicing by means of site-directed mutagenesis and locked nucleic acid (LNA)/DNA mixmers as antisense oligonucleotides (AONs) that interfere with RNA secondary structure.
MATERIALS AND METHODS
Minigene construction and mutagenesis
Whole genomic DNA was isolated using Quick-gDNA MiniPrep kit (Zymo Research). Ate1 minigene was assembled from three fragments: the first one was inserted into pRK5 vector (kindly gifted by Prof. Petr M. Rubtsov (34)) using restriction-free cloning (protocol from (35)), and the next two fragments were inserted into the resulting plasmid using NEBuilder®HiFi DNA Assembly Cloning Kit (New England Biolabs). Fragments were amplified with primers (Supplementary Table S1) and Q5 High-Fidelity DNA polymerase (New England Biolab). The minigene construct was deposited to Addgene under the accession number 162514. Minigene mutagenesis was performed using either protocol from (36) or using phosphorylated primers that introduced the desired changes with subsequent ligation using Rapid DNA ligation kit (Thermo Scientific). All primers for mutagenesis are listed in Supplementary Table S1; all PCR reactions were performed using Phusion High-Fidelity PCR Master Mix (Thermo Scientific). All mutants were verified by sequencing.
Antisense oligonucleotides
LNA/DNA mixmers were designed based on (37). Synthesis of LNA/DNA mixmers was carried out by Syntol JSC (Moscow, Russia). The sequences of used AONs are listed in (Supplementary Table S2).
Cell culture, transfections and treatments
Human A549 lung adenocarcinoma cell line was maintained in DMEM/F-12 medium containing 10% fetal bovine serum, 50 U/ml penicillin, and 0.05 mg/ml streptomycin (all products from Thermo Fisher Scientific) at 37°C in 5% .
Minigene plasmids were transfected using Lipofectamine 3000 (Invitrogen) with reverse transfection protocol for 24 h followed by cell harvesting by trypsin-EDTA (Thermo Fisher Scientific). AONs treatment was performed using Lipofectamine RNAiMAX (Invitrogen) on 50–70% confluent cells. Cells were harvested after 48 h of treatment. α-amanitin (Sigma) was added at concentrations 1 or 2 ug/ml to 50–70% confluent cells. After 24 h of treatment, cells were harvested.
In the experiments when cells were transfected with minigenes and AONs together, the conditions were as follows. Plasmids and AONs were mixed together prior to the transfection, and then these mixtures were transfected using Lipofectamine 3000 (Invitrogen) to 50–70% confluent cells. After 24 h of treatment, cells were harvested.
The experiments with α-amanitin and AONs/minigenes treatments were performed as follows. Cells were transfected with AONs/minigenes using reverse transfection. After 12–14 h of transfection, the media was changed and α-amanitin was added. After 24 h of α-amanitin treatment, cells were harvested.
The experiments with overexpression of NELFE were performed using pCMV3-NELFE plasmid (Cat: HG15217-UT, Sino Biological). Cells were transfected with a plasmid using Lipofectamine 3000 (Invitrogen) and harvested after 24 hours. Cells without transfected plasmid were used as a control.
RT-PCR experiments
Total RNA was extracted using PureLink RNA mini kit (Invitrogen) and treated with RNase-Free DNase I (Thermo Scientific) at 37°C for 60 min, followed by inactivation at 75°C for 10 min. First-strand cDNA was synthesized using Maxima First Strand cDNA Synthesis Kit for RT-qPCR (Thermo Scientific) according to the manufacturer’s instructions. All primers for PCR analysis are listed in Supplementary Tables S3 and S4.
We used competitive RT-PCR analysis for the assessment of the ratio between different splice isoforms in one PCR tube. For each PCR reaction, 20–30 ng of cDNA was used. Reactions were carried out using PCR Master Mix (2×) (Thermo Scientific). RT-PCR was carried out under the following conditions: denaturing at 95°C for 3 min, 35 cycles of denaturing at 95°C for 30 s, annealing at 54°C for 30 s, and extension at 72°C for 1 min, followed by extension at 72°C for 5 min. The resulting products were analyzed on a 3% agarose gel stained with ethidium bromide and visualized using ChemiDoc XRS+ (Bio-Rad).
For RT-qPCR experiments, we used 20–30 ng of cDNA and Maxima SYBR Green qPCR Master Mix (2X) (Thermo Scientific) on a CFX96 or CFX384 Real-Time systems (Bio-Rad). Minus-RT controls without RT enzyme in the cDNA synthesis reaction were performed in every RT-qPCR analysis. For each mutant and/or treatment experiments, at least three biological replicates in PCR triplicates were analyzed. The PCR cycle parameters were as follows: 95°C for 10 min and 35 cycles with denaturation at 95°C for 10 s, annealing at 54°C for 20 s and extension at 72°C for 30 s. For each pair of primers in RT-qPCR analysis, the primer efficiencies were estimated using a calibration curve. The expression of isoforms was calculated by the efficiency method (38) with primers efficiency more than 90% in all cases. The expression levels of all isoforms were normalized to the expression of the constitutive exon in the corresponding sample. Then, the sum of all isoform expression levels was taken as 100% to enable comparative analysis of different biological replicates. We additionally checked the sum of expression levels of all isoforms, and it was not statistically different from the expression level of the constitutive exon in all cases.
Western blotting
The plasmid pCMV3-NELFE (Cat: HG15217-UT, Sino Biological) was transfected into A549 cells using Lipofectamin 3000 (Invitrogen). Cells were lysed with RIPA buffer after 24 h. Cells without transfected plasmid were used as a negative control. Cell lysates (3 ug of total protein) were separated by gel electrophoresis on a 10% sodium dodecyl sulphate-polyacrylamide gel (SDS-PAGE) under denaturing conditions and transferred onto nitrocellulose membrane. Immunoblotting was done first at 4oC overnight using antibodies against NELFE from (39) (1:500) and GAPDH (Thermo Fisher Scientific, #39-8600, 1:3000). Next, a horseradish peroxidase-conjugated goat anti-rabbit IgG (Invitrogen, G21234, 1:2500) was added for 1 h at the room temperature, followed by detection using Amersham ECL Prime Western Blotting Detection Reagent (GE Healthcare Life Sciences) and Bio-Rad ChemiDoc XRS + imaging system.
Free energy calculation
The hybridization free energies of the WT and mutant sequences of R1–R5 were computed by the RNAup program from Vienna RNA package with the default settings (40).
Percent-Spliced-In (PSI) calculation
RNA-seq data of poly(A)+ RNA were downloaded in BAM format from Genotype-Tissue Expression (GTEx) project (41), The Cancer Genome Atlas (42) websites (8,555 samples from v7 release of GTEx; 731 pairs of samples from TCGA), and GEO repository (GSE63375) (43). RNA-seq experiments were processed by IPSA pipeline to obtain split read counts supporting splice junctions with the default settings (44). Split read counts were filtered by the entropy content of the offset distribution, annotation status and canonical GT/AG dinucleotides at splice sites. The exon inclusion rate (ψ, PSI or Percent-Spliced-In) was calculated according to the equation
where inc is the number of reads supporting exon inclusion and exc is the number of reads supporting exon exclusion. ψ values with the denominator below 20 were considered unreliable and discarded.Statistical analysis
The data were analyzed and visualized using R statistics software version 3.4.1 and ggplot2 package (45). Ternary diagrams were constructed using the ggtern package (46). Confidence intervals (regions) in ternary diagrams were constructed using the Mahalanobis distance (47). The statistical significance of log fold change of 7a/7b isoform ratio in TCGA samples was assessed by the Wilcoxon signed rank test with Bonferoni-Holm correction for multiple testing (family-wise error rate, FWER < 0.05). Error bars in the plots and numbers after the ± sign represent 95% confidence intervals. When appropriate, the comparison of ψ values was done by a post hoct-test with pooled variances after Mahalanobis distance comparison based on confidence intervals (47). One-sided P-values are reported throughout the paper.
RESULTS
Conserved complementary regions in exon 7 cluster
In order to identify the mechanism responsible for mutual exclusive splicing of exons 7a and 7b, we used comparative sequence analysis to search for potential regulatory sequences in their intervening and flanking introns (Figure 1A and Supplementary Figure S1). The regions immediately upstream of exons 7a and 7b, termed here as R1 and R4, are highly similar to each other and show remarkable sequence conservation across vertebrate species. The intron between exons 7a and 7b contains two conserved regions, termed here as R2 and R3, where R3 is complementary to both R1 and R4, while R2 is complementary to another highly conserved region R5 located ∼30 kb downstream in the intron between exons 7b and 8. The base pairing between R1 and R3 was predicted in earlier works (48). The pattern of complementarity between these regions suggests that R1 and R4 could compete with each other for base pairing with R3 and, together with base pairing of R2 with R5, they form a pseudoknot (Figure 1B).

![(A) Ate1 contains five evolutionarily-conserved intronic elements (R1–R5). The conserved positions are indicated by asterisks (see also Supplementary Figure S1). (B) R1 and R4 are highly similar to each other and are both complementary to R3; R2 is complementary to R5, which is located 30 Kb downstream. R1 and R4 compete for base pairing with R3. (C) The relative expression of exon 7a/7b isoforms (the difference of \documentclass[12pt]{minimal}
\usepackage{amsmath}
\usepackage{wasysym}
\usepackage{amsfonts}
\usepackage{amssymb}
\usepackage{amsbsy}
\usepackage{upgreek}
\usepackage{mathrsfs}
\setlength{\oddsidemargin}{-69pt}
\begin{document}
}{}$\log _{10}\frac{7a}{7b}$\end{document} between tumor and normal tissue) is significantly elevated in stomach (STAD), rectum (READ), colon (COAD), and prostate (PRAD) adenocarcinomas, and in lung squamous cell carcinoma (LUSC); Wilcoxon test FWER < 0.05 (yellow), P < 0.05 (gray).](/dataresources/secured/content-1765761855756-f00e5dc8-b438-482a-9df8-3f88a12b2b13/assets/gkaa1208fig1.jpg)
(A) Ate1 contains five evolutionarily-conserved intronic elements (R1–R5). The conserved positions are indicated by asterisks (see also Supplementary Figure S1). (B) R1 and R4 are highly similar to each other and are both complementary to R3; R2 is complementary to R5, which is located 30 Kb downstream. R1 and R4 compete for base pairing with R3. (C) The relative expression of exon 7a/7b isoforms (the difference of between tumor and normal tissue) is significantly elevated in stomach (STAD), rectum (READ), colon (COAD), and prostate (PRAD) adenocarcinomas, and in lung squamous cell carcinoma (LUSC); Wilcoxon test FWER < 0.05 (yellow), P < 0.05 (gray).
To confirm that exons 7a and 7b are indeed spliced in a mutually exclusive manner, we analyzed a large compendium of RNA-seq experiments from the Genotype Tissue Expression (GTEx) project (41) (Supplementary Figure S2A). Consistent with previous reports (17), exons 7a and 7b have a broad range of inclusion levels across tissues (medians 33% and 67%, respectively) with the most remarkable deviation in testis (medians 60% and 39%, respectively). There was almost no evidence of simultaneous inclusion or simultaneous skip of both exons neither in normal tissues (Supplementary Figure S2A), nor in cancer samples from The Cancer Genome Atlas (Supplementary Figure S2B) (42). Furthermore, we detected a significant prevalence of isoforms containing exon 7a as compared to exon 7b in prostate adenocarcinoma samples compared to matched normal tissues (FWER < 0.05) and also in other epithelial tumors including stomach, rectum, colon adenocarcinoma, and lung squamous cell carcinoma (Figure 1C).
The occurrence of competing RNA structures in mutually exclusive exons in Ate1 is reminiscent of splicing control mechanisms in other genes (29). We therefore analyzed in detail the function of these complementary regions using site-directed mutagenesis and antisense oligonucleotides.
Competition between R1R3 and R3R4 controls mutually exclusive splicing
To check whether RNA structure is implicated in the regulation of splicing in Ate1, we created a minigene construct containing a fragment spanning between exons 6 and 8 under the constitutive CMV promoter and quantitatively assessed splice isoforms in transfection experiments using human adenocarcinoma A549 cells (Figure 2A). In the minigene, the endogenous intron downstream of exon 7b was reduced in size to ∼2 kb due to obvious limitations of cloning large fragments.
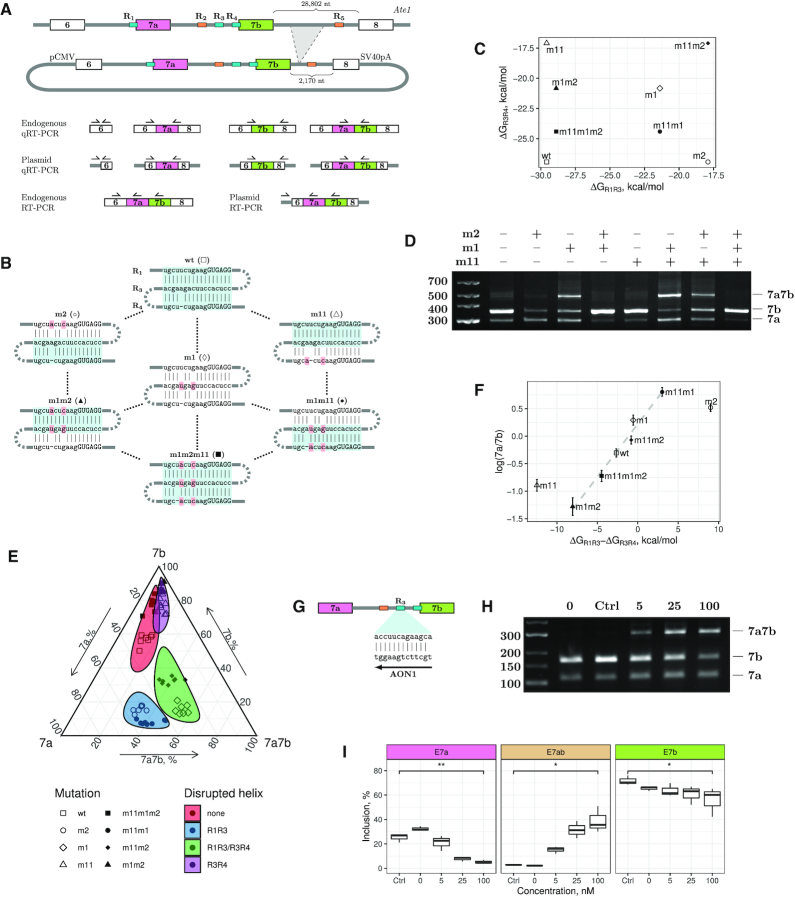
(A) The intron between exon 7b and exon 8 was reduced from ∼29 kb in the genome to ∼2 kb in the minigene (top); primers for quantitative and qualitative assessment of alternative splicing (bottom). (B) Disruptive and compensatory mutations in R1, R3 and R4. (C) The predicted hybridization energies of R1R3 and R3R4 with disruptive and compensatory mutations. (D) The rate of inclusion of exons 7a, 7b, and double exons (7a7b) changes in single and double mutants; WT splicing is qualitatively restored in the m1m2m11 triple mutant. (E) Ternary plot of exons 7a, 7b and 7a7b inclusion rate measured by qRT-PCR. Colored areas represent the 95% confidence intervals calculated via the Mahalnobis distance using log-ratio transformation (46,47). The results of the post hoc test for quantitative differences between individual mutants are shown in Supplementary Figure S3. (F) Log-ratio of exon 7a/7b isoforms depends on the difference of thermodynamic stabilities of R1R3 and R3R4. (G) AON1 disrupts R1R3 and R3R4 via base pairing to R3. (H, I) The inclusion of double exons increases with increasing AON1 concentration in the endogenous Ate1 transcript. ‘Ctrl’ denotes the control AON. Asterisks indicate the range of P-values: 0.05 ≤ P < 0.1 (*); 0.01 ≤ P < 0.05 (**); P < 0.01 (***); not significant (NS).
Our strategy was to make point mutations that disrupt RNA structure when introduced alone, but restore it when introduced in different combinations. First, we tested the effect of disruptive and compensatory mutations on double-stranded structures of R1R3 and R3R4 (Figure 2B and C) and assessed the corresponding splicing changes in ATE1 minigene by RT-PCR (Figure 2D). The mutation disrupting R1R3 base pairing (m2) increased the usage of exon 7a, whereas the mutation disrupting R3R4 (m11) increased the usage of exon 7b. The mutated R3 (m1), which is unable to base-pair with R1 or R4, increased the proportion of transcripts containing double exons. The compensatory double mutation m1m2, which restored R1R3 but disrupted R3R4, increased the efficiency of exon 7b inclusion, while exon 7a inclusion became almost fully suppressed. Conversely, the compensatory double mutation m1m11, which restored R3R4 while disrupting R1R3, led to a more efficient inclusion of exon 7a compared to the WT. Finally, the proportion of splice isoforms in the triple mutant (m1m2m11), in which both R1R3 and R3R4 were restored, was similar to that in the WT.
To evaluate the effect of disruptive and compensatory mutations quantitatively, we repeated the same measurements using qRT-PCR and constructed a ternary plot for the inclusion rates of exon 7a, exon 7b, and double exons (Figure 2E). The mutants formed four separate clusters depending on which double-stranded structure (R1R3, R3R4, none or both) was disrupted. The 95% confidence regions around these clusters confirmed that the exon inclusion rates were significantly different when different helix sets were disrupted. Despite small, but statistically discernible differences between individual mutants within each cluster (Supplementary Figure S3), the pattern of exon inclusion in the triple mutant (m1m2m11) with both R1R3 and R3R4 restored was more similar to that in the WT than it was in all other mutants (Figure 2E). Notably, the ratio of exon 7a/7b inclusion changed proportionally to the difference of thermodynamic stabilities of R1R3 and R3R4 in all mutants except m2 and m11 (Figure 2F), and the proportion of isoforms containing both exon 7a and 7b increased whenever R1R3 base pairing was disrupted.
It could be questioned whether the double-stranded regions formed by R1–R5 are substrates of ADAR adenosine deaminases (49). To address this question, we sequenced nucleotide sequences surrounding the regions R1–R5 in the minigene and in the corresponding transcript, but no pattern specific to adenosine-to-inosine RNA editing was detected (Supplementary Figure S4). RADAR, currently the largest database of RNA editing sites, contains no evidence of RNA editing in R1–R5. Additionally, we examined the responses of exons 7a and 7b to shRNA depletion of ADAR1 profiled by RNA-seq within ENCODE consortium (50), but no significant changes of exon inclusion were detected. Together, these results indicate that R1–R5 are not substrates of ADAR enzymes.
The cloned fragment of Ate1 lacks a substantial part of intron 7, which may affect splicing. We therefore independently examined the role of R1, R3, and R4 in the endogenous Ate1 transcript using locked nucleic acid (LNA)/DNA mixmers as antisense oligonucleotides (AONs) that interfere with RNA secondary structure (37). Since R1 and R4 overlap with splice sites, we chose to use AON with specific sequence complementary to R3 (AON1) (Figure 2G). RT-PCR analysis revealed that the transfection of 5 nM or a higher concentration of AON1 efficiently induced the inclusion of double exons and suppressed the inclusion of individual exons, while the transfection of the control AON didn’t show any difference from the non-treated cells (Figure 2H). Quantitative RT-PCR (qRT-PCR) with isoform-specific primers confirmed consistent dose dependence of AON1 treatment (Figure 2I). Taken together, the mutagenesis and AON1 treatment indicate that the function of competitive base pairings between R1, R3, and R4 is to control mutually exclusive splicing of exons 7a and 7b.
The ultra-long-range R2R5 base pairing controls isoform bias
To elucidate the function of the other two conserved regions, R2 and R5, we applied a similar mutation strategy to the minigene carrying a reduced Ate1 fragment (Figure 3A). When introduced separately, the disruptive mutations m3 and m4 almost completely abrogated the inclusion of exon 7a and strongly enhanced the inclusion of exon 7b, while the compensatory double mutant m3m4 reverted the splicing pattern to that of the WT (Figure 3B). Remarkably, the disruptive mutations affected only the ratio of isoforms carrying mutually exclusive exons, but not the proportion of transcripts with both exon 7a and 7b (Figure 3C).
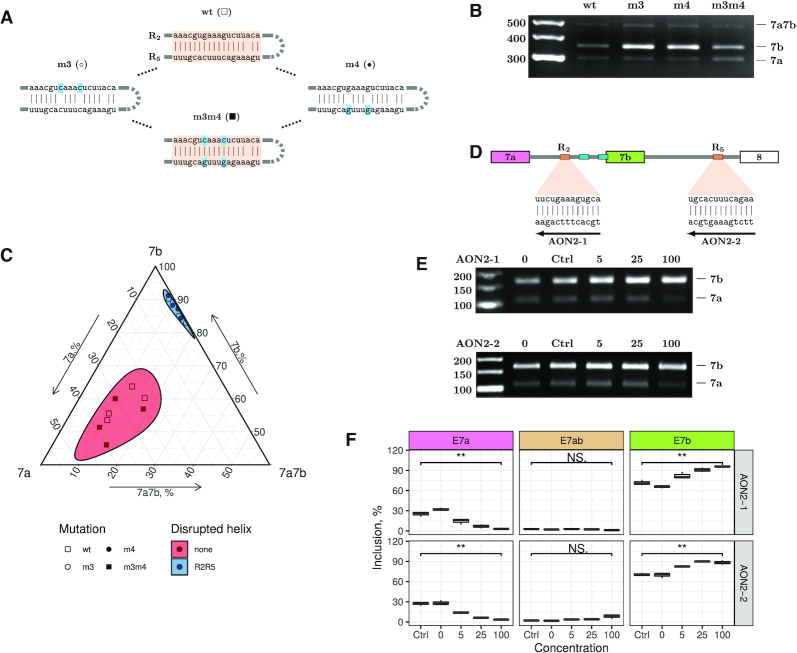
(A) Disruptive and compensatory mutations in R2 and R5. (B, C) The mutations disrupting R2R5 base pairing (m3 and m4) promote exon 7b inclusion, while the compensatory mutation (m3m4) restores WT splicing. The ternary plot is as in Figure 2E. (D) AON2-1 and AON2-2 disrupt R2R5 interaction. (E, F) Increasing concentration of AON2-1 and AON2-2 suppresses exon 7a and promotes exon 7b usage without inducing double (7a7b) exons in the endogenous Ate1 transcript. ‘Ctrl’ denotes the control AON. Asterisks indicate the range of P-values: 0.05 ≤ P < 0.1 (*); 0.01 ≤ P < 0.05 (**); P < 0.01 (***); not significant (NS).
In the endogenous gene, however, R2 and R5 are located ∼30 Kb apart from each other, while in the minigene construct the distance between them is reduced to ∼2 kb. Hence, we used AONs complementary to R2 and R5 (AON2-1 and AON2-2, respectively) to confirm that the ultra-long-range base pairing between R2 and R5 also modulates alternative splicing in the endogenous Ate1 transcript (Figure 3D). RT-PCR and qRT-PCR analyses revealed that 5 nM or a higher concentration of AON2-1 was sufficient to decrease exon 7a usage and increase exon 7b usage in comparison with non-treated cells and cells treated with the control AON, while the proportion of transcripts with double exons remained low (Figure 3E and F). The efficacy of AON2-2 in reducing the inclusion of exon 7a was similar to that of AON2-1.
In sum, the effects of AON2-1 and AON2-2 on splicing are concordant with each other and consistent with the results of the mutagenesis. Taken together, they indicate that the RNA structure formed by R2 and R5 is functionally distinct from that of R1R3 and R3R4, and it serves to control the isoform ratio rather than the mutually exclusive choice of exons 7a and 7b.
Crosstalk between competing and ultra-long-range RNA structures
We have demonstrated that the secondary structure of Ate1 pre-mRNA contains two distinct modules, R1R3/R3R4 and R2R5, where the former ensures mutually exclusive exon inclusion, and the latter regulates the respective isoform ratio. To investigate how these modules interact with each other, we examined the response of alternative splicing in mutants with disruptive and compensatory mutations within R1, R3 and R4 to the treatment with AON2-1, which blocks the interaction between R2 and R5.
Towards this end, we treated the minigenes carrying mutations in R1, R3 and R4 with AON2-1 and measured the changes in alternative splicing with respect to cells treated with control AON (Figure 4A) and non-treated cells (Supplementary Figure S5). The effect of AON2-1 was equivalent to that of the point mutations that disrupted the interaction between R2 and R5 (Figure 3A) regardless of mutations changing base pairings within R1R3 and R3R4, i.e., it suppressed the inclusion of exon 7a and promoted the inclusion of exon 7b without affecting the proportion of double exons (Figure 4A). This experiment demonstrated that the ultra-long-range RNA structure formed by R2 and R5 plays a dominant role in choosing between exons 7a and 7b, while not being directly responsible for their mutually exclusive choice.
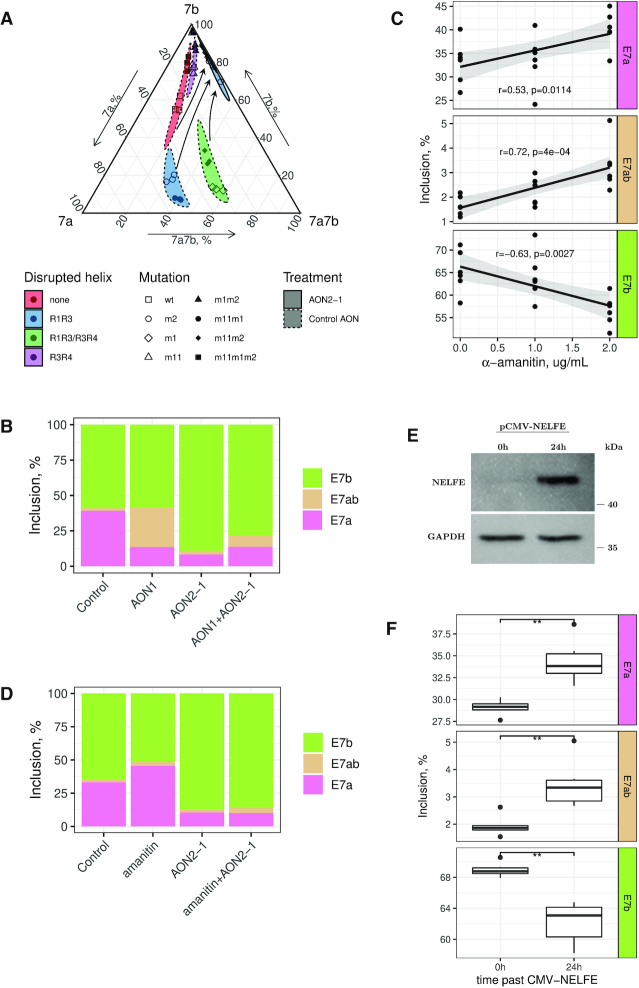
(A) Treatment with AON2-1 suppresses the inclusion of exon 7a and promotes the inclusion of exon 7b without affecting the proportion of double exons regardless of mutations in R1, R3, and R4 (see also Figure 2B). (B) The disruption of R1R3 and R3R4 base pairings in the endogenous ATE1 with AON1 increases the proportion of double exons without affecting exon 7b. The disruption of R2R5 with AON2-1 changes exon 7a/7b ratio without inducing double exons. Simultaneous disruption of R1R3, R3R4 and R2R5 leads to an intermediate result. The proportions are the averages of three bioreplicates. (C) Exon inclusion in response to α-amanitin treatment. r denotes the Pearson correlation coefficient. P-values indicate the significance of the regression slope (H0: β = 0). Note that the panels have different scales of y-axes. (D) Exon inclusion changes in response to the treatment with AON2-1 and α-amanitin. The addition of α-amanitin affects exon 7a/7b ratio only when R2R5 base pairing is present. The proportions are the averages of three bioreplicates. (E) Western blot confirms the overexpression of NELFE protein. (F) Exon inclusion changes 24 h after NELFE overexpression. Asterisks indicate the range of P-values: 0.05 ≤ P < 0.1 (*); 0.01 ≤ P < 0.05 (**); P < 0.01 (***); not significant (NS).
To discern the interplay between R1R3/R3R4 and R2R5 in the endogenous Ate1 transcript, we examined the effect of simultaneous disruption of base pairings with AON1 and AON2-1 on exon selection. We treated A549 cells with the combination of 25 nM AON1 and 25 nM AON2-1 and compared the splicing pattern with the effect from single AON treatment and with that of the control AON (Figure 4B). Remarkably, the treatment with AON1 alone increased the proportion of double exons by 28% without changing the rate of exon 7b inclusion, while the treatment with AON2-1 alone, conversely, increased the inclusion of exon 7b by 31% without introducing double exons. Simultaneous addition of AON1 and AON2-1 led to an intermediate result, in which exon 7b inclusion increased by 16% and the inclusion of double exons increased by 7%. This effect was similar to the response of m1 mutant to the treatment with AON2-1, in which the interaction between R1, R3, and R4 was disrupted by point mutations.
These results support our hypotheses about functional distinction between two RNA structure modules in Ate1 pre-mRNA. The module of competing base pairings (R1R3/R3R4) is responsible for mutual exclusivity of exons 7a and 7b, whereas the module of ultra-long-range base pairings (R2R5) controls the isoform balance. Since the latter differs across human tissues (Supplementary Figure S2A) and disease conditions (Figure 1C), we next questioned which intrinsic factors may modulate the isoform ratio in Ate1 together with RNA structure.
Splicing pattern of Ate1 depends on RNAPII elongation rate
The transcription elongation speed strongly impacts alternative splicing (51). It is currently accepted that slow transcription elongation opens a window of opportunity for the upstream splice sites to be recognized, which promotes the inclusion of exons that are otherwise skipped, although in some cases the effect can be the opposite (52–54). We therefore evaluated how the transcription elongation speed influences Ate1 splicing using α-amanitin, a selective inhibitor that interacts with the core subunit of RNAPII and switches transcription to the ‘slow mode’ (55,56).
To assess the efficiency of elongation inhibition by α-amanitin, we used 28S rRNA/GAPDH ratio measured with qRT-PCR and additionally assessed splicing changes in the genes that are known to respond to RNAPII slowdown (57). Indeed, upon α-amanitin treatment, the 28S rRNA/GAPDH ratio increased almost twofold (Supplementary Figure S6), and splicing products that were previously reported for slow RNAPII were detected (Supplementary Figure S7). In the endogenous Ate1 transcript, the exposure to 2 ug/mL α-amanitin led to a notable decrease of exon 7b usage, increased exon 7a usage, and slight elevation of inclusion of double exons (Figure 4C). This pattern was opposite to the effect of AON2-1 treatment, in which the exon 7a/7b ratio has decreased (Figure 3F). Consistent with this, the reanalysis of RNA-seq data for the R749H mutant from (43) confirmed that the usage of exon 7a increases, while the usage of exon 7b decreases when RNAPII is slowed down (Supplementary Figure S8). In the minigene construct, however, the ratio of exon 7a/7b isoforms did not change significantly (data not shown). This suggests that transcription elongation slowdown could promote the interaction of R2 with R5 by allowing sufficient time for RNA to fold, and that the absence of the effect in the minigene construct could be related to the shortening of the loop between R2 and R5.
To dissect the interplay between transcription elongation speed and RNA structure, we tested the effect of α-amanitin on the endogenous Ate1 transcript in cells treated with AON2-1 at the concentration disrupting R2R5 base pairing. The addition of AON2-1 abolished the effect of α-amanitin, i.e., the inclusion rate of exon 7a decreased, the inclusion rate of exon 7b increased, and double exons were not affected by α-amanitin (Figure 4D). This indicates that the increase of exon 7a/7b ratio after α-amanitin treatment in the endogenous Ate1 with intact R2R5 structure was not due to a longer opportunity window for the spliceosome to recognize exon 7a, but rather due to a longer time for the RNA structure to fold. We therefore conclude that the formation of ultra-long-range RNA pairing between R2 and R5 depends on transcript elongation speed, and that the impact from its slowdown on Ate1 splicing is mediated by the ultra-long-range RNA base pairing R2R5.
One of the mechanisms of RNAPII pausing in mammalian cells involves NELF complex, which has been shown to operate not only in the promoter-proximal regions, but also to interact with the integrator complex that specifically controls NELF-mediated RNAPII pause and release in coding genes (58,59). The NELFE subunit, the binding of which to RNA has been linked to RNAPII pausing (60–62), is highly expressed in testis (Supplementary Figure S9), where the inclusion level of exon 7a of Ate1 is also the largest (Supplementary Figure S2A). Furthermore, we found that the inactivation of NELFE by shRNA in HepG2 and K562 cell lines (50) results in a significant decrease of exon 7a inclusion from 94% to 48%, and that CUGAGG, the canonical motif of NELFE in Drosophila (63), occurs 14 times in the intron downstream of exon 7b, while only 6.5 such occurrences would be expected by chance alone (Poisson test, P = 0.007). This observation suggests that NELFE-mediated RNAPII pausing could influence the ratio of exon 7a/7b isoforms by affecting cotranscriptional folding of R2R5.
To further interrogate the role of NELFE in the regulation of Ate1 splicing, we expressed it under CMV promoter in A549 cells and confirmed the overexpression using NELFE/GAPDH ratio measured by qRT-PCR (Supplementary Figure S10) and by Western blot analysis (Figure 4E). Then, we measured the inclusion levels of exons 7a and 7b 24 hours past CMV-NELFE transfection and found NELFE promotes the inclusion of exon 7a and suppresses the inclusion of exon 7b (Figure 4F). Notably, the overexpression of NELFE also induced splicing products that were previously reported for slow RNAPII (Supplementary Figure S7). The same pattern was observed upon α-amanitin treatment, from which we conclude that testis-specific inclusion of exon 7a could be due to slow RNAPII elongation that is caused by testis-specific expression of NELFE.
DISCUSSION
Mutually exclusive splicing is among the top five most abundant alternative splicing classes after exon skipping, alternative 5′- and 3′-splice site usage, and retained introns (64). Instances of MXEs have been described in diverse phyla including C. elegans, D. melanogaster and plants (28,29,65,66). Pre-mRNAs of many essential human genes such as glutamate receptor subunits 1–4 (GluR1–4) and voltage-gated sodium channels (SCN genes) undergo mutually exclusive splicing (67,68). MXE clusters often have tissue- and developmental stage-specific expression (28), and mutations in them have been linked to hereditary diseases (69–72) and cancer (73,74).
Mutually exclusive splicing can be regulated by several distinct mechanisms including spliceosome incompatibility (75), steric hindrance of splice sites (66), or frame shifting coupled with degradation by nonsense-mediated decay (76), but competing RNA secondary structure represents the major mechanism reported in most documented cases (29). Here, we demonstrate for the first time an example of MXE in a human gene with two independent structural modules that have distinct functions: a competing RNA structure module (R1R3/R3R4) that controls mutually exclusive splicing, and an ultra-long-range base pairing module (R2/R5) that spans over 30 kb and regulates the ratio of transcript isoforms. The latter makes Ate1 a gene with the longest such RNA structure known to date.
The competing base pairings in R1R3 and R3R4 regulate MXE choice by the hindrance of one of the two 3′-splice sites that mediates exposure of only one of them to the spliceosome. On the one hand, the relative abundances of these two structures, and consequently the ratio of exon 7a and 7b transcript isoforms, must depend on the difference of their folding energies. On the other hand, mutations in R1 and R4 affect the polypyrimidine tracts and decrease the recognition of exon 7a and 7b by the spliceosome. In all mutants except m2 and m11, the sequences of R1 and R4 either become obstructed by RNA structure or concordantly decrease their affinity to the spliceosome. Consequently, the log-ratio of exon 7a and 7b isoforms is proportionate to the difference of R1R3 and R3R4 hybridization energies in all mutants except m2 and m11 (Figure 2F). This is consistent with the previous findings, in which the rate of exon inclusion inversely correlated with the thermodynamic stability of the surrounding RNA structure in CFTR minigene system (77), and explains incomplete reversal of the exon 7a/7b ratio in the triple mutant (m1m2m11) since the balance between the free energies of R1R3 and R3R4 was restored to a different level compared to the WT.
Extensive evidence indicates that the speed of transcription elongation may affect the choice of splice sites by changing timing in which they are presented to the spliceosome (54,57,78). For instance, a DNA-binding factor CTCF can promote inclusion of weak upstream exons by mediating local RNA polymerase II pausing (79). Here, we report for the first time that beyond co-transcriptional recognition of splice sites, slow transcription elongation also can affect splicing through RNA structure by opening a longer opportunity window for it to fold because exon 7a/7b ratio responds to the slowdown of RNA Pol II in the presence of R2R5 long-range base pairing, but fails to do so when the base pairing is disrupted. In bacterial organisms, kinetic mechanisms that involve RNA structure represent a commonly used strategy of regulating premature transcription termination, in which the structure typically senses specific molecules (80). In eukaryotes, the kinetics of RNA folding could be influenced by many other factors including changes in the composition of RNA-binding proteins and environmental signals, thus adding to the already complex and dynamic regulatory landscape of alternative splicing. As we show here, one of such factors is NELFE, a testis-specific subunit of NELF complex, which could promote exon 7a inclusion by inhibiting RNA Pol II elongation.
MXEs within a cluster often share high similarity at the sequence level indicating that some of them have emerged through tandem genomic duplications (26). Furthermore, this mechanism could also generate competing RNA structures by duplicating one of the two arms of an ancestral stem-loop resulting in two selector sequences that compete for the same docking site (32). In the case of exons 7a and 7b in Ate1, the duplication likely happened after the radiation of Chordata because a homolog of exon 7b is absent in invertebrates, but it is not possible to track the origin of R1, R3, and R4 since competing RNA secondary structures are usually not conserved across long evolutionary distances (28). Interestingly, the length of the intron downstream of exon 7b is decreasing with increasing the evolutionary distance from human (Supplementary Figure S11) suggesting that the base pairing between R2 and R5 pairing could have evolved after duplication to counteract the expansion of the intron downstream of exon 7b.
The fact that the ratio of exon 7a/7b is proportional to the difference of hybridization energies of R1R3 and R3R4 despite the former has a longer loop than the latter indicates that Ate1 pre-mRNA is a highly folded molecule with many more complementary interactions than we have identified here. Chemical RNA structure probing methods are insufficient to determine long-range base pairings since they can only reveal which bases are single-stranded, but cannot identify the interacting partners (81–85). Other rapidly emerging technologies such as RNA in situ conformation sequencing (RIC-seq) can be used instead to profile long-range RNA structures (86–89). The published RIC-seq data confirm the presence of R1R3 and R3R4 base pairings in Ate1 pre-mRNA expressed in HeLa cells, but they also reveal over 50 other base paired regions in exon 7a/7b cluster with potential impact on splicing (86) (Supplementary Figure S12). Therefore, the regulation of Ate1 alternative splicing could, in fact, be much more complex than we have described here.
The regulation of splicing by RNA structures has always been considered as an exceptional mechanism that works in only a few rare cases (90). The structures in Ate1 identified here add one more example to this bulk of anecdotal evidence. Current computational studies suggested that the human transcriptome could potentially contain hundreds of thousand of such functional RNA structures, many of which are yet to be identified (91).
CONCLUSION
We demonstrated that alternative splicing in the human Ate1 gene is regulated by a complex RNA structure composed of two modules: a competing RNA structure module responsible for including one and only one exon in the mature mRNA, and an ultra-long-range module, which contains base pairs spanning over 30,000 nts and controls the exon inclusion ratio. The two modules interact in space and in time to control the mutually exclusive choice of exons 7a and 7b. This regulatory mechanism can be adjusted using LNA-based antisense oligonucleotides, which opens new possibilities for targeting alternative splicing therapeutically.
SUPPLEMENTARY DATA
Supplementary Data are available at NAR Online.
FUNDING
M.K. and D.S. were supported by Russian Foundation for Basic Research [18-29-13020-MK]; T.I. was supported by Russian Foundation for Basic Research [19-34-90174]; S.K.was supported by Russian Foundation for Basic Research [18-29-13020-MK] and Skolkovo Institute of Science and Technology Research Grant [RF-0000000653]. Funding for open access charge: CREI Center of Life Sciences, Skolkovo Institute of Science and Technology.
Conflict of interest statement. None declared.
REFERENCES
1.
2.
3.
4.
5.
6.
7.
8.
9.
10.
11.
12.
13.
14.
15.
16.
17.
18.
19.
20.
21.
22.
23.
24.
25.
26.
27.
28.
29.
30.
31.
32.
33.
34.
35.
36.
37.
38.
39.
40.
41.
42.
43.
44.
45.
46.
47.
48.
49.
50.
51.
52.
53.
54.
55.
56.
57.
58.
59.
60.
61.
62.
63.
64.
65.
66.
67.
68.
69.
70.
71.
72.
73.
74.
76.
77.
78.
79.
80.
81.
82.
83.
84.
85.
86.
87.
88.
90.
91.