 A comprehensive epigenome atlas reveals DNA methylation regulating skeletal muscle development
Nucleic Acids Research


The authors wish it to be known that, in their opinion, the first three authors should be regarded as Joint First Authors.

- Altmetric
DNA methylation is important for the epigenetic regulation of gene expression and plays a critical role in mammalian development. However, the dynamic regulation of genome-wide DNA methylation in skeletal muscle development remains largely unknown. Here, we generated the first single-base resolution DNA methylome and transcriptome maps of porcine skeletal muscle across 27 developmental stages. The overall methylation level decreased from the embryo to the adult, which was highly correlated with the downregulated expression of DNMT1 and an increase in partially methylated domains. Notably, we identified over 40 000 developmentally differentially methylated CpGs (dDMCs) that reconstitute the developmental trajectory of skeletal muscle and associate with muscle developmental genes and transcription factors (TFs). The dDMCs were significantly under-represented in promoter regulatory regions but strongly enriched as enhancer histone markers and in chromatin-accessible regions. Integrative analysis revealed the negative regulation of both promoter and gene body methylation in genes associated with muscle contraction and insulin signaling during skeletal muscle development. Mechanistically, DNA methylation affected the expression of muscle-related genes by modulating the accessibly of upstream myogenesis TF binding, indicating the involvement of the DNA methylation/SP1/IGF2BP3 axis in skeletal myogenesis. Our results highlight the function and regulation of dynamic DNA methylation in skeletal muscle development.
INTRODUCTION
In mammals, DNA methylation mainly takes place at cytosines in CpG dinucleotides, ∼70–80% of all CpG sites are methylated, with the exception of CpG islands (CpGIs) and other gene regulatory sequences (1,2). As a dynamic and reversible epigenetic modification, DNA methylation in mammals is established by the de novo DNA methyltransferases, DNMT3a and DNMT3b, and maintained by DNMT1 during DNA replication (3). Dynamic changes in DNA methylation are important for the epigenetic regulation of gene expression. It is well-established that DNA methylation of gene promoters is associated with the silencing of gene expression by blocking the binding of transcription factors (TFs) (4). Gene body methylation has variable effects on transcription and results in different functions (5,6), and intergenic methylation may affect gene expression and activity via the regulation of distal enhancer (7). The dynamics of DNA methylation at enhancers, partially methylated domains (PMDs) and other regulatory regions highlight their regulatory roles in mammalian development (8–12). To date, however, only limited studies exist regarding genome-wide methylation at single-nucleotide resolution.
Skeletal muscle development is a highly complex, tightly coordinated and well-characterized multi-step process (13). Two major waves of fiber generation, primary and secondary myofibres, establish the total number of fibers during prenatal muscle development in mammals (14,15). After birth, myofibres functionally evolve into fast-twitch and slow-twitch fibres, and the increase in skeletal muscle mass is mainly determined by an increase in pre-existing muscle fibre size (16). It is well known that skeletal muscle development is orchestrated by myogenic genes and TFs, such as Pax3/Pax7 and members of the MyoD family of myogenic regulatory factors (MRFs) (13). Additionally, epigenetic regulation is critical for skeletal muscle development, and DNA demethylation is a key mechanism driving myogenesis (17–19). For instance, demethylation of enhancers is essential for MyoD and Myf5 activation during skeletal myogenesis and muscle-stem cell differentiation (17,20). Nevertheless, the dynamics of genome-wide DNA methylation and the relationship between the DNA methylome and transcriptome during skeletal muscle development have not yet been defined.
In addition to being a major source of meat production, the pig has been shown to be an outstanding model organism for the study of human development and disease (21–23), due to the high similarity to humans in anatomical, physiological, metabolic and genomic properties (22). Here, we performed the dynamic profiling of the DNA methylome and transcriptome in pig skeletal muscle at the single-base resolution across 27 developmental stages (15 prenatal and 12 postnatal time points), covering the life cycle from embryonic day 33 (E33) to postnatal day 180 (D180). To the best of our knowledge, this is the most extensive study of DNA methylation during skeletal muscle development to date. We investigated the potential biological functions of DNA methylation during skeletal muscle development and growth. These data have important value for understanding the molecular regulation of skeletal muscle development in mammals, and provide an invaluable resource for studying on animal breeding, muscle biology and related diseases.
MATERIALS AND METHODS
Skeletal muscle tissue collection
The skeletal muscle (longissimus dorsi) samples were collected from Landrace pigs at 27 developmental stages, including embryonic days 33, 40, 45, 50, 55, 60, 65, 70, 75, 80, 85, 90, 95, 100 and 105 (abbreviated as E33, E40, E45, E50, E55, E60, E65, E70, E75, E80, E85, E90, E95, E100 and E105) and postnatal days 0, 9, 20, 30, 40, 60, 80, 100, 120, 140, 160 and 180 (abbreviated as D0, D9, D20, D30, D40, D60, D80, D100, D120, D140, D160 and D180), as we previously reported (24). At each stage, skeletal muscles from three pigs were harvested as biological replicates. All samples were stored immediately in liquid nitrogen until further use. All animal procedures were performed according to protocols of the Chinese Academy of Agricultural Sciences and the Institutional Animal Care and Use Committee. The sex of each pig was recorded and validated via polymerase chain reaction (PCR) amplification of the sex-determining gene SRY (25) using the following primers: F: 5′-GCTTTCATTGTGTGGTCTCGT-3′ and R: 5′-CTTGGCGACTGTGTATGTGAAG-3′. Following whole genome bisulfite sequencing (WGBS), sex-calls were further confirmed using the ratio of mapped reads in the X chromosome to the Y chromosome.
Library construction
Total DNA for WGBS was extracted and fragmented by sonication to 200−300 bp using a Covaris S220 (Covaris, Woburn, MA, USA), followed by end repair and A-ligation. After ligation to cytosine-methylated barcodes, the DNA fragments were treated twice with bisulfite using an EZ DNA Methylation-Gold™ Kit (Zymo Research, Orange, CA, USA). The libraries were then prepared according to the Illumina standard DNA methylation analysis protocol. RNA-seq libraries were constructed from the same samples. Total RNA was isolated using TRIzol™ reagent (Invitrogen, CA, USA), followed by rRNA depletion and DNaseI treatment (Qiagen, Hilden, Germany). For each RNA sample, a paired-end strand-specific library was constructed with an insert size of ∼350 bp according to the Illumina Ribo-Zero protocol. The WGBS and RNA-seq libraries were sequenced on the Illumina HiSeq X Ten platform (Illumina, CA, USA) and 150-bp paired-end reads were generated (Novogene, Beijing, China). Both WGBS and RNA-seq libraries were performed in three biological replicates at each developmental stage.
Whole genome bisulfite sequencing analysis
The raw reads of each WGBS library were pre-processed with the Trimmomatic software. After transforming the Sus scrofa reference genome (NCBI Sscrofa11.1) to a bisulfite-converted version (C-to-T and G-to-A conversion) and indexing using bowtie2 (26), the bisulfite-treated clean reads were mapped to the reference genome using the Bismark software (v0.12.5) with default parameters (27). The sequencing depth and coverage of the methylcytosine were summarized after deletion of the duplicated reads. We focused only on CpG methylation. The methylation level of each CpG site was defined as the number of methylated reads (C) divided by the total number of methylated reads (C) and unmethylated reads (T) at the same positions in the reference genome. The average percentage methylation of all cytosine residues for any genomic region was computed as the fraction of read counts of ‘C’ in the total read counts of both ‘C’ and ‘T’. To identify reliable methylated CpG sites, methylated and unmethylated counts at each site in the Bismark output were tested by binomial distribution, as described by Lister et al., (1). Only the reliable CpG sites covered by at least five reads and with a false discovery rate (FDR) ≤ 0.05 were retained for further analysis. FDRs were estimated using Benjamini−Hochberg adjustment of Fisher's P value in the R environment. The non-conversion rate was considered to correct the methylation level according to previous studies (8,28) using the following formula: ML_corrected = (ML-r)/(1-r), where ML_corrected represents the corrected methylation level and r represents the bisulfite non-conversion rate. The sodium bisulfite non-conversion rate is defined as the methylation level of the bisulfite-treated lambda genome.
Annotation of gene and genomic features
The pig reference genome and gene annotation data were obtained from the NCBI (Suscrofa 11.1). The region from the transcription start site (TSS) to the transcription termination site was regarded as the gene body region, and the promoter was defined as the 2-kb region upstream of the TSS. CpGIs were defined as regions >200 bp with a GC fraction >0.5 and an observed-to-expected ratio of CpG > 0.65 on repeat-masked sequence as annotated by the UCSC Genome Browser (29). CpGI shores and shelves were defined as the 2-kb regions extending in both directions from CpGIs and CpGI shores, respectively. Annotation of repeat elements was carried out by RepeatMasker Annotation, available at the UCSC Genome Browser (29). For PMDs detection, CpGs with coverage of at least five were used, the PMDs in each sample were identified using MethPipe, an existing HMM-based tool, using a window size setting of 10 kb (30). We defined regions that were maintained low methylation status (methylation level ≤ 20%) during skeletal muscle development as hypomethylated by dividing the reference genome into 10-kb windows.
Identification of developmental and sex-biased differentially methylated CpG sites
To identify CpG methylation changes associated with skeletal muscle development or sex, we built a multivariate linear model regressing each CpG site against developmental stage and sex. CpG sites were considered significantly associated with skeletal muscle development or sex if they passed the FDR-corrected significance threshold of P-value ≤ 0.05. Subsequently, developmental or sex-biased differentially methylated regions were identified by the Python module Comb-p (31) with the parameters of -c 4 –seed 0.05 –dist 1000 –region-filter-p 0.1 –region-filter-n 4 and visualized in Integrative Genomics Viewer (IGV).
RNA-seq analysis
Following removal of reads containing adapters and poly-N and those of low-quality from the raw data using the Trimmomatic software, the RNA-seq reads were aligned to the porcine reference genome using Hisat2 (v2.0.4) (32) with –rna-strandness RF; the other parameters were set as default. The expression level of each gene was quantitated by calculating fragments per kilobase of exon per million fragments (FPKM) values using StringTie (v1.3.1) in a reference-based approach (32).
Chromatin immunoprecipitation followed with sequencing (ChIP-seq)
We downloaded the publicly available ChIP-seq data in induced porcine pluripotent stem cells from the NCBI Sequence Read Archive with accession numbers from SRR414964 to SRR414971 (33). The dataset comprised eight histone modifications: H3K4me1/2/3, H3K9me3, H3K27ac, H3K27me3, H3K36me3 and H2AZ. The H3K4me3 ChIP-seq data of pig embryonic muscle (SAMN09983112 and SAMN09983113) were also downloaded. The reads were mapped to the Sscrofa11.1 reference genome using Bowtie2.1.0 (26). The alignment files were transferred and sorted using SAMtools (34). High quality mapped reads (q > 30) were retained. MACS2 was used to identify ChIP-seq peaks using a q-value cutoff of 0.01 and an effective genome size of 2.5 × 10⁹ bp (35).
The assay for transposase-accessible chromatin with high-throughput sequencing (ATAC-seq)
The ATAC-seq peaks from five tissues (skeletal muscle, liver, cerebrum, cerebellum and small intestine) of Luchuan and Duroc pigs were obtained in our laboratory, which are available from the China National GenBank (CNGB; https://db.cngb.org/) Nucleotide Sequence Archive (CNSA) under accession number CNP0001159. The Irreproducible Discovery Rate (IDR) method was used to identify reproducible peaks between two biological replicates, and only these peaks were retained. Subsequently, peaks from the same tissues of the two different breeds were merged for downstream analysis.
Enrichment analysis
Motif enrichment analysis was performed using the findMotifsGenome.pl script from the HOMER software with default paraments. To analyze the enrichment ratio of dDMCs in the ATAC-seq and ChIP-seq peaks, 100 sets of randomly sampled, size-matched control regions of the genome were first generated using the BEDtools shuffle function. Subsequently, we calculated the enrichment of dDMCs that occurred in the ATAC-seq and ChIP-seq peaks normalized to the control regions. Odds ratios were calculated as enrichment scores, and Monte Carlo test was used to assess the significance of the enrichment. GO analysis was performed using the Database for Annotation, Visualization and Integrated Discovery (DAVID) website (v6.7, http://david.abcc.ncifcrf.gov/) (36). GO terms with a P-value < 0.05 were considered nominally significant (37).
Age prediction
To accurately predict pig age based on the dDMCs, we adopted an approach similar to that utilized in human and mouse studies (38–41). We randomly divided our methylome dataset into training (80%, n = 64) and test (20%, n = 17) subsets. The age of the postnatal skeletal muscles was transformed using the following formula: Age = 114 + T1, where 114 is the pregnancy cycle of pig and T1 represents the days after birth, so the age of skeletal muscle at D0 stage was transformed to 114 days, D9 was transformed to 123 days, and so on. To ensure that the age predictor would not be sex-bias nor hampered by the unreliability of mitochondrial genome bisulfite conversion, we filtered out the dDMCs that located on sex chromosomes (X and Y) and the mitochondrial genome. Missing data of the remaining dDMCs were first imputed using the R mice package with default parameter, then we performed an elastic-net regression model with 10-fold cross-validation on dDMCs of the training set using the R glmnet package (42) corresponding to an alpha parameter of 1. The internal cross-validation (cv.glmnet) was utilized to automatically select the optimal penalty parameter. After the cross-validation in the training, the linear model was defined as follows: , where is the weight for the CpG site and is the methylation level at the site . The resulting DNAm clock included 75 CpG sites.
Correlation analysis of DNA methylation and gene expression
To compute the correlation between DNA methylation and gene expression, genes were first classified into four groups according to their expression level in RNA-seq data (high, medium, low and no expression). We analyzed CpG DNA methylation levels in gene regulatory regions (5-kb upstream, gene body and 5-kb downstream) of the four gene groups at each developmental stage. The gene locations were divided into 20, 100 and 20 bins for upstream 5k, gene body and downstream 5k, respectively. Pearson correlation coefficients between the methylation level of the promoter/gene body and the expression level of the corresponding gene were calculated in skeletal muscle across 27 developmental stages.
Construction of the TF-methylation regulatory network
To explore the connection between DNA methylation and TF binding, motif evaluation in the promoters of the 285 genes that exhibited a significantly negative correlation (Bonferroni's correction P-value < 0.05) between promoter methylation level and gene expression, denoted as promoter negative genes (PNGs), was performed using FIMOv4.12.00 (43) with a q value threshold of 0.05. The expression correlations between the TFs and their target genes during skeletal muscle development were calculated. Genes containing motifs and with a Pearson correlation coefficient > 0.5 were identified as target genes regulated by TFs.
RNA interference and overexpression of IGF2BP3
Three RNAi oligonucleotides to knockdown the IGF2BP3 gene specifically (si-IGF2BP3–1, -2, -3) were synthetized by Genepharma (Shanghai, China). After evaluating their efficiencies, the si-IGF2BP3–1 fragment was chosen for the next analysis. To generate IGF2BP3 overexpression vector, the coding region of mouse IGF2BP3 gene was amplified using forward and reverse primers containing BamHI and XhoI sites, respectively. The PCR products were inserted into the pcDNA3.1(+) vector (Invitrogen, China). siRNA and over-expression vectors were transfected into C2C12 cells to detect the effect of IGF2BP3 on myoblast proliferation and differentiation. The siRNA and primer sequences are listed in Supplementary Table S1.
Cell culture and 5-Aza treatment
C2C12 cells were cultured in Dulbecco's modified Eagle's medium (DMEM, Sigma-Aldrich, St. Louis, MO, USA) supplemented with 10% fetal bovine serum (GM) in a humidified incubator with 5% CO2 at 37°C. For the induction of myogenic differentiation, the culture medium was switched to DMEM supplemented with 2% heat-inactivated horse serum (DM). To study the effect of 5-Aza on myoblast proliferation and differentiation, C2C12 cells were cultured in GM and treated with 5 μM 5-Aza-CdR (Sigma-Aldrich, St. Louis, MO, USA) in GM for 3 days and in DM for 4 days, respectively. Medium was replaced every 24 h. Total RNA and protein were then extracted.
Lactic acid concentration assay
After C2C12 cells were treated with 5 μM 5-Aza and cultured for 24 h, the concentration of lactic acid in the culture medium was determined by the Lactic Acid assay kit (Jiancheng, Nanjing, China) according to the manufacturer's instructions. Briefly, 20 μl of the 3-fold diluted culture medium was added to the test tube with 1 ml of enzyme working solution and 200 μl of coloring solution. After bathing at 37°C in water for 10 min and adding 2 ml stop solution, the absorbance was measured at a wavelength of 530 nm.
Cell proliferation assay
We examined cell proliferation using the Cell Counting Kit-8 (CCK-8) (Dojindo, Kumamoto, Japan). A volume of 10 μl CCK-8 reagent was added to each well of a 96-well plate containing cells and incubated at 37°C for 45 min. The absorbance of each sample was measured at 450 nm using a microplate reader. In addition, we assessed cell proliferation using the Cell-Light EdU DNA Cell Proliferation Kit (RiboBio, Guangzhou, China) according to the manufacturer's instructions, with three independent replicates for each treatment group.
Quantitative real-time PCR (qPCR)
For qPCR analysis, total RNA was extracted using TRIzol™ reagent according to the manufacturer's instructions (Invitrogen, Carlsbad, CA, USA). cDNA was prepared using reverse transcriptase (Thermo Fisher Scientific, Waltham, MA, USA) and oligo(dT) primers. The qPCR reaction was performed using a 7500 FAST Real-Time PCR System (Applied Biosystems, Foster City, CA, USA) according to the SYBR Green Master Mix instructions (Applied Biosystems, Foster City, CA, USA). The glyceraldehyde 3-phosphate dehydrogenase (GAPDH) gene was employed as an internal control. Each experiment was repeated three times and the data are shown as the mean ± S.E.M. Gene expression levels were normalized to the internal control using the 2−△△Ct method. All qPCR primers are listed in Supplementary Table S1.
Western blotting
Western blotting was performed as previously described (24,44). Briefly, cells were collected from the different treatment groups, pelleted by centrifugation (12 000 × g, 5 min), and lysed in RIPA buffer (Solarbio, Beijing, China). Total protein was isolated from C2C12 cells by sodium dodecylsulphate-polyacrylamide gel electrophoresis and subsequently transferred to nitrocellulose membrane. The membranes were blocked with 5% skim milk at room temperature for 1.5 h, followed by incubation overnight with primary antibodies. The next day, the membranes were washed with PBST and incubated with horseradish peroxidase-conjugated secondary antibodies for 30 min. Protein bands were detected after treatment with SuperSignal West Femto (Thermo Fisher Scientific, Waltham, MA, USA). Primary antibodies against AKT (1:1000), IR (1:1000), p-AKT (1:1000), p-IR (1:1000) and GAPDH were obtained from Cell Signaling Technology, Trask Lane Danvers, MA, USA. Primary antibodies against KI67 (1:1000) and IGF2BP3 (1:1000) and the secondary antibody were purchased from Proteintech, Chicago, IL, USA.
Immunofluorescence assay
Confluent C2C12 cells were washed three times with phosphate-buffered saline (PBS) buffer (pH 7.4) and fixed in PBS containing 4% paraformaldehyde for 30 min prior to permeabilization for 15 min in PBS containing 0.1% Triton X-100. Sections or cells were then incubated with 5% (v/v) goat serum/PBS and 10% BSA at room temperature for 1 h. Immunostaining was carried out as described below. Cells were incubated overnight at 4°C with a primary antibody against MHC1 (1:300; DSHB) in 5% goat serum/PBS. Subsequently, cells were washed with PBS and incubated at room temperature for 2 h with Alexa Fluor 594 goat anti-mouse IgG1 (1:500; Zsbio) in 1% goat serum/PBS. Nuclei were stained with 5 mg/ml DAPI (BioTime, Shanghai, China). Finally, the prepared cells were washed three times with PBS and observed under a fluorescence microscope.
Chromatin immunoprecipitation assay followed by qPCR (ChIP-qPCR)
Chromatin immunoprecipitation assays were performed using a ChIP Assay Kit (EMD Millipore Corporation, Billerica, MA, USA). In brief, 1 × 10⁷IGF2BP3- overexpressing C2C12 cells were incubated in the presence or absence of 5 μM 5-Aza for 72 h and subsequently harvested. Cells were cross-linked with formaldehyde (final concentration 1%) and incubated for 10 min at 37°C. Cells were then washed with ice-cold PBS containing protease inhibitors and allowed to lyse for 10 min in lysis buffer on ice. Shearing of chromatin was performed by 10 cycles of sonication, each for 10 s, and incubation on ice for 10-s intervals (average DNA length of 200–500 bp). Cross-linked and released chromatin fractions were immunoprecipitated using magnetic beads and SP1 antibodies, or non-specific IgG (rabbit), on a rolling shaker overnight at 4°C. The cross-linking of immunoprecipitates containing fragmented DNA was chemically reversed. Immunoprecipitated DNA was amplified by PCR using specific primers. PCR reactions were run using the ChamQ SYBR Color qPCR Master Mix. The enrichment values were normalized to the input sample. A region in the intron 2 of IGF2BP3, which doesn’t contain any potential SP1-binding site, was selected as a negative control. The PCR primers used for amplifying the promoter of IGF2BP3 containing the SP1-binding site and the control region are listed in Supplementary Table S1.
RESULTS
Overview of the dynamics of the DNA methylome and transcriptome
To systematically understand the functional and regulatory roles of DNA methylation during skeletal muscle development, we profiled the dynamic DNA methylome and transcriptome landscape of skeletal muscle across 27 developmental stages using WGBS and Ribo-Zero strand-specific RNA-seq, respectively (Figure 1A). We generated 58.47 billion paired-end reads (150 bp × 2) covering 8.77 Tb of sequence for WGBS (Supplementary Table S2) and 8.59 billion paired-end reads (150 bp × 2) covering 1.24 Tb of sequence for RNA-seq (Supplementary Table S3). The average mapping rate of clean WGBS reads to the reference genome (Sscrofa 11.1) was 80.92% (range 72.60−85.25%), which equates to an average depth of 28.39 × genome coverage (range 21.56- to 38.75-fold) for each sample. The average mapping rate of clean RNA-seq reads to the reference genome was 93.23% (range 89.40−94.75%). We detected an average of 13 984 protein-coding genes (PCGs, range 12 958−14 762) expressed (FPKM > 0.1) in skeletal muscle (Figure 1B), accounting for 62.59% of the annotated PCGs.

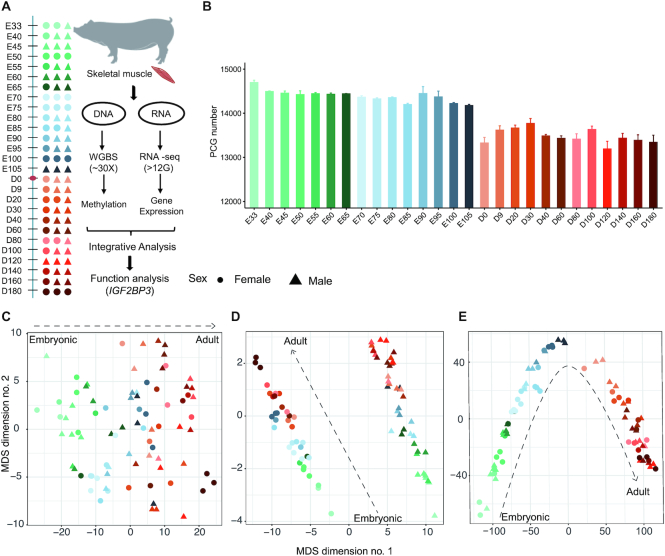
High-resolution DNA methylome and transcriptome profiling of skeletal muscle during development. (A) Experimental paradigm for the DNA methylome and transcriptome profiling of skeletal muscle at 27 developmental stages in pigs. (B) The number of genes expressed in skeletal muscle at each developmental stage. The quantification of expression was evaluated at the gene-level. The genes with FPKM > 0.1 as expressed genes were defined as expressed genes. PCG, protein coding gene. (C–E) MDS plots showing the global DNA methylation pattern for autosomal CpG sites of 5-kb tiles (C), the X chromosome (D) and transcriptional similarity (E), colored by developmental stage.
The multidimensional scaling (MDS) analysis showed that the overall pattern of genome-wide DNA methylation was highly developmentally dependent. For autosomal methylation, the first dimension clearly showed step-wise developmental changes from embryonic to adult muscles (Figure 1C). For X chromosome methylation, all skeletal muscle samples were distinctly segregated by sex, whereas the second dimension was clearly aligned with developmental stages (Figure 1D). The overall pattern of the genome-wide transcriptome exhibited a characteristic inverted V shape during skeletal muscle development. The first dimension clearly separated the prenatal from postnatal samples, while the second dimension separated the skeletal muscle according to developmental stages (Figure 1E).
We identified 105 hypomethylated regions (HMRs, methylation level < 20% in 10k bins) containing 115 genes in the skeletal muscle genome (Supplementary Table S4). Interestingly, almost half (53/115) of the hypomethylated genes were TFs that play central roles in transcriptional regulation, such as SOX14, an important upstream regulator of myogenesis (Supplementary Figure S1A). We found a significant enrichment of TFs in HMRs by hypergeometric testing using all protein-coding genes as the background (P-value < 7.45 × 10⁻³², Supplementary Figure S1B). Additionally, the TFs located in HMRs contains more (average 3.02 ± 1.76 versus 2.71 ± 4.88, P-value = 9.10 × 10⁻⁶, Mann–Whitney U test) and longer (average 1340.32 ± 1709.45 bp versus 929.79 ± 1493.09 bp, P-value = 2.42 × 10⁻⁴, Mann–Whitney U test) CpGIs than TFs without HMRs (Supplementary Figure S1C). It is noteworthy that TFs genes without HMRs were significantly enriched in Gene Ontology (GO) terms for muscle organ development, but this phenomenon was not observed in the TFs within HMRs (Supplementary Figure S1D). Moreover, we also observed that genes and TFs within HMRs were expressed at lower levels than those without HMRs (Supplementary Figure S1E and F), suggesting that HMRs repressed the expression of TFs in skeletal muscle.
Dynamic changes in DNA methylation occur skeletal muscle development
Next, we analyzed the DNA methylome dynamics during skeletal muscle development. The majority of CpGs sites were highly methylated (methylation level from 80 to 100%) and the ratio of highly methylated CpGs was decreased during development, while the ratio of intermediately methylated CpGs (methylation level from 40 to 70%) increased during development (Supplementary Figure S2). The global DNA methylation level of skeletal muscle at each developmental stage was heavily CpG methylated (average 72.45%, Figure 2A), which is in accordance with reports for other mammals (45–47). Interestingly, the global DNA methylation level during skeletal muscle development was accompanied by global DNA demethylation of the genome, which gradually reduced from 76.43% at embryonic day 33 (E33) to 68.69% at postnatal day 180 (D180) (Figure 2A). The CpG methylation level was significantly higher in prenatal than postnatal skeletal muscles (P-value = 2.9 × 10⁻¹¹, Mann–Whitney U test, Supplementary Figure S3A). Meanwhile, the rate of change in methylation was relatively stable during the prenatal period and slowed sharply immediately after birth (Supplementary Figure S3B). The rate of change in promoter methylation was higher than that of gene body methylation (Supplementary Figure S3B), suggesting that there is higher stability of methylation in gene body regions than in promoters.
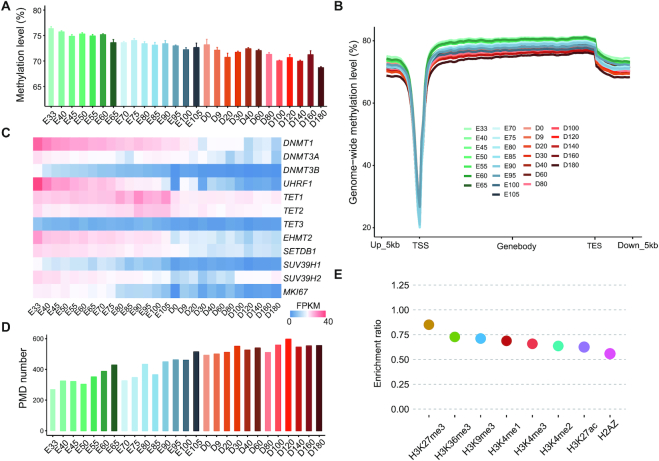
Global patterns of DNA methylation during skeletal muscle development. (A) Average levels of genome-wide DNA methylation at each developmental stage. (B) Average levels of DNA methylation across gene bodies and the 5-kb regions flanking the transcription start and end sites (TSS and TES). (C) Heatmap showing the expression levels of DNA methyltransferases and demethylases during skeletal muscle development based on RNA-seq. (D) The number of PMDs detected in skeletal muscle at each developmental stage. (E) The enrichment ratio of histone modifications on PMDs.
Subsequently, we analyzed the methylation level in/around the gene body region and other functional elements. As expected, gene bodies had higher methylation levels than their neighboring intergenic regions, and marked hypomethylation was observed around TSSs (Figure 2B). The methylation level of gene bodies was relatively stable, with a clear reduction after the transcription end sites (TESs). The CpG methylation level was lower at promoter and CpGIs regions, whereas genic and intergenic regions showed higher levels (Supplementary Figure S4). Similar to the global methylation pattern, transposable elements (TEs) were heavily methylated and this level decreased during skeletal muscle development (Supplementary Figure S5), with the exception of transfer RNAs (tRNAs, average 41.28%) and small conditional RNAs (scRNAs, average 42.93%) (Supplementary Figure S5), which showed comparably lower methylation levels. The methylation level of SINEs was the highest among all the repeat elements, which may be explained by the evolutionarily youth and higher activity of SINEs as compared with other TEs (48).
DNA methylation status can be dynamically regulated by DNA methyltransferases and demethylases (49). According, we examined the expression of DNA methyltransferase and demethylase genes by RNA-seq data (Figure 2C). Of the DNA methyltransferases, DNMT1 and UHRF1 (a contributor to DNMT1 methylation maintenance) showed the highest expression. The expression of DNMTs was gradually downregulated during skeletal muscle development, coincide with the decrease in proliferation of muscle cells during development, as evidences of the decrease expression with development of proliferation marker MKI67. These results indicated that both the maintenance and de novo methylation machineries were downregulated during skeletal muscle development. The DNA demethylation associated enzymes TETs (TET1–3) showed relatively stable and low expression during development (Figure 2C). Additionally, DNMT1 was the most significant methyltransferase displaying a positive correlation between the global DNA methylation level and gene expression (Pearson r = 0.86, Supplementary Figure S3C). These finding suggested that DNMT1 may be the main methyltransferase regulating DNA methylation during skeletal muscle development. DNA demethylation is typically accompanied by a global loss of histone H3 lysine 9 dimethylation (H3K9me2) (50,51). The expression levels of enzymes responsible for H3K9me2 (EHMT2) and H3K9me3 (trimethylation) (SETDB1, SUV39H1 and SUV39H2) also decreased during skeletal muscle development (Figure 2C).
Moreover, we observed widespread extended genomic regions exhibiting a reduced average DNA-methylation level, previously defined as PMDs. Both the average number and length of PMDs were increased during skeletal muscle development (Figure 2D; Supplementary Figure S6A and B), covering an average of 13.1% of the genome (range 2.9−24.7%). The total length of PMDs was correlated with the decrease in global methylation level (Pearson's r = −0.91, P-value = 6.41 × 10⁻¹¹), indicating that methylation status of PMDs changed during development. In general, PMD positions in the genome were highly conserved during skeletal muscle development (Supplementary Figure S6C). There were 485 genes located in the PMDs in all skeletal muscles across 27 developmental stages, which were significantly enriched in the G protein-coupled receptor signaling pathway (Supplementary Figure S6D). The genes in PMDs were expressed at consistently lower levels than those outside of PMDs (Supplementary Figure S6E), which is consistent with previous reports demonstrating that genes in PMDs are transcriptionally repressed (1,47), such as HOXB genes (Supplementary Figure S6F) that are essential for vertebrate embryonic development and expressed at the earliest developmental stages (52). PMDs often associate with inaccessible chromatin and showed a depletion in active modifications (1); thus, we analyzed the publicly available porcine ChIP-seq data in induced porcine pluripotent stem cells (33), which contained eight histone modifications, because no only a few types of ChIP-seq histone modifications (e.g. H3K4me3 and H3K27ac) are available in pigs. Additionally, previous studies reported that the general distribution patterns of histone marks are comparable among different tissues (24,53–54). We believe that the peak distribution in the genome was also comparable between pluripotent stem cells and skeletal muscle, since we observed a majority of H3K4me3 peaks in the embryonic muscle was overlapped with these in pluripotent stem cells (Supplementary Figure S7). We found that the PMDs regions were depleted of histone modifications as compared with 100 sets of the random, size-matched genomic regions (Figure 2E). The ATAC-seq data in skeletal muscle suggested that 20.67% of peaks (13 647/66 012) were overlapped with PMDs, as compared with an average of 30.21% of the 100 sets of random, size-matched regions overlapping with PMDs (odds ratio [OR] = 0.60, Monte Carlo simulated P-value < 0.01). These results suggest that PMDs widely exist and are repressed in skeletal muscle, and the increase in PMDs during skeletal muscle development highly correlates with the decreases in global DNA methylation level and transcriptional activity.
Sex-biased DNA methylation exists in skeletal muscle
There were no significant differences between male and female individuals in global DNA methylation of the whole genome (72.60 ± 1.91% versus 72.27 ± 2.09%, P-value = 0.64, Mann–Whitney U test) or autosomes (71.31 ± 1.91% versus 72.82 ± 2.10%, P-value = 0.83, Mann–Whitney U test). On X chromosomes, however, the global DNA methylation level in male pigs was higher than that in females (71.42 ± 1.87% versus 63.68 ± 2.19%, P-value = 1.7 × 10⁻¹⁴, Mann–Whitney U test, Supplementary Figure S8A). To further evaluate the impact of sex on DNA methylation in skeletal muscle, we identified a total of 20 244 significantly differentially methylated CpGs between female and male pigs using a multivariate linear regression model (Bonferroni's correction P-value < 0.05, Supplementary Figure S8B and Table S5). Almost all of the sex-biased CpGs (99.92%, 20 227/20 244) were located on the X chromosome, a remarkable 84.68% of these sex-biased CpG sites (17 143/20 244) had a higher level of methylation in males than in females (Supplementary Figure S8C), presumably because of the effect of X chromosome inactivation as previously reported in mammalian brain (28). The distribution of sex-biased CpGs showed that the hypermethylated CpGs in females were notably enriched in promoter regions (Supplementary Figure S8D), but in other genomic regions, the sex-biased CpGs generally had lower methylation level in females, leading to a global reduction of DNA methylation on the X chromosome of females as consistent with the previous study (28). MDS analysis based on the sex-biased CpGs suggested that skeletal muscles were obviously segregated according to sex and developmental stages (Supplementary Figure S8E). These results are similar to the methylation pattern of the X chromosome (Figure 1E). GO analysis revealed that the genes containing sex-biased CpGs were significantly enriched in chromatin modification, RNA splicing, and metabolic processes. Additionally, we identified 17 sex-biased CpGs located in the autosome, all of which were hypermethylated in females, including one differentially methylated region (DMR, chr3:1 977 582–1 978 075, 8 CpG loci) in the Archaelysin family metallopeptidase 1 (AMZ1) gene (Supplementary Figure S8F). However, there was no significant difference in the expression of genes on the X chromosome between male and female pigs (P-value = 0.7, Mann–Whitney U test).
Developmentally differentially methylated CpGs are associated with skeletal muscle development
We next identified CpGs with significantly temporal changes during skeletal muscle development, termed developmentally differentially methylated CpG sites (dDMCs). Using a multivariate linear regression model, a total of 47 872 dDMCs (Bonferroni's correction P-value < 0.05) in the autosome were identified (Figure 3A and Supplementary Table S6). The methylation level of 90.31% for dDMCs (43 231/47 872) decreased with age (Figure 3B), in accordance with the decrease in global DNA methylation level during skeletal muscle development (Figure 2A). The distribution of dDMCs differed depending on the CpG density, and was significantly enriched in gene bodies (Supplementary Figure S9A), which were also previously observed in methylation data from mouse brains (55) and thus could be a general feature of genomic methylation patterns in mammals. Interestingly, almost all dDMCs were located outside the CpGI (Supplementary Figure S9B). The hypermethylated dDMCs were significantly enriched in CpGI shores and shelfs. These results imply that dDMCs are preferentially located in regions with low CpG content.
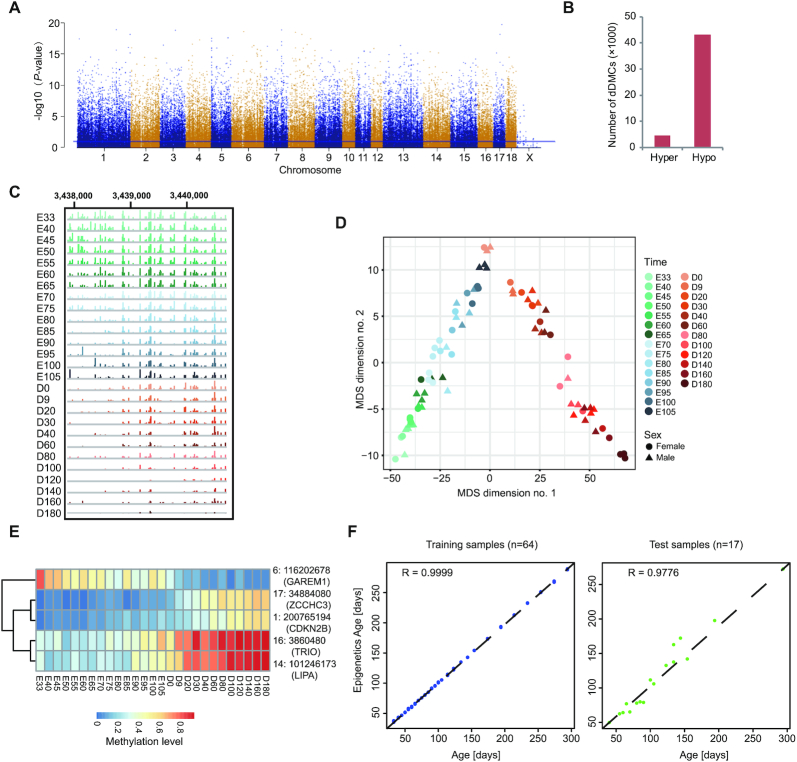
Identification of developmentally differentially methylated CpG sites (dDMCs) in skeletal muscle. (A) Manhattan plot of the genome-wide P-values for the association between the methylation level of CpGs and skeletal muscle development. (B) The number of hyper- and hypomethylated dDMCs. Hyper- and hypomethylation levels of dDMCs were increased and decreased during skeletal muscle development, respectively. (C) An IGV snapshot showing an example of the dynamic DNA methylation pattern of a dDMR from E33 to D180. (D) MDS plots showing the global DNA methylation pattern based on dDMCs. (E) Examples of five CpGs with different methylation patterns, whose methylation levels could accurately reflect the developmental stage of skeletal muscle. The following procedure was used to identify these five CpGs: from each co-methylated module, three CpGs among those with the highest significance were selected. Subsequently, Relief algorithms were used for feature selection (FSelector package in R software) in these 36 CpGs. CpGs with a weight >0.2 were selected. If multiple CpGs were located in same gene, only the CpG with the highest weight score was retained. CpGs in intergenic regions were excluded from analysis. Finally, a combination of five CpGs was selected, which accurately reflected skeletal muscle development. (F) Performance of the epigenetic clocks in sorting the skeletal muscle samples into training (left) and test (right) datasets.
Significantly, multiple dDMCs were found in myogenic factor 6 (MYF6) and the myocyte enhancer binding factor 2 (MEF2) family (Supplementary Figure S9C). The methylation level of most of these dDMCs decreased during skeletal muscle development, showing hypermethylation at the prenatal period and hypomethylation after birth (D0). Interestingly, three dDMCs in the promoter of MEF2C were demethylated at the prenatal stage and gained methylation after birth (Supplementary Figure S9C), which may be a mechanism for regulating the expression of MEF2C, because MEF2C was abundant expressed at the prenatal stage, began to decline in its expression at E85 and lowly expressed after birth (Supplementary Figure S9D). Many dDMCs do not represent isolated changes at specific sites but rather occur in clusters; therefore, we used comb-p (31) to identify 1,061 developmentally differentially methylated regions (dDMRs) (Figure 3C and Supplementary Table S7). Interestingly, many dDMRs were located in genes and TFs closely related to skeletal muscle development, such as FOXO3, HMGB1, IGF2BP3 and NOTCH2 (Supplementary Figure S10).
MDS analysis based on the methylation of dDMCs accurately reconstructed the developmental trajectory of skeletal muscle (Figure 3D). The skeletal muscles were ordered by developmental stage in a characteristic inverted V shape (Figure 3D), similar to the results of MDS analysis of the transcriptome (Figure 1E). Additionally, these dDMCs were clustered into 12 co-methylated modules containing at least 500 CpGs in each, which showed similar DNA methylation dynamics during skeletal muscle development (Supplementary Figure S11). According to these modules, we performed a feature selection step and chose 5 dDMCs in genes closely related to development, including ZCCHC3, GAREM1, TRIO, LIPA and CDKN2B, whose methylation levels clearly classified skeletal muscle into different developmental periods (Figure 3E).
Age predictors based on DNA methylation as an epigenetic clock have been proposed in humans and mice (38–41). We first established a linear regression model based on the global methylation level to predict age using all the 81 samples (Supplementary Figure S12A). However, the model didn’t perform well; it showed an age correlation of 0.85 (Supplementary Figure S12B) and a median absolute error of 23.28 days (Supplementary Figure S12C). Given that methylation at dDMCs changed in a development-dependent manner, we next generated an epigenetic age predictor in the pig based on dDMCs. We randomly divided our dataset into training (80%, n = 64) and test (20%, n = 17) subsets and performed elastic net regression with 10-fold cross-validation on dDMCs to predict age. The resulting DNA methylation clock included 75 autosomal dDMCs (Supplementary Table S8). The training set showed a median absolute error of 1.22 days and an age correlation of 0.99 (Figure 3F). The developmental clock of skeletal muscle performed well across the test dataset, with an age correlation of 0.97 and a median absolute error of 6.30 days and 12.06 days for prenatal and postnatal muscles, respectively (Supplementary Figure S13A). We observed no significant differences in the estimated age between sexes (Supplementary Figure S13B), showing that sex differences did not skew the predictions of the epigenetic clock. These facts imply that the 75 dDMCs can be used as an epigenetic clock to estimate developmental age.
Functional implication of dDMCs in skeletal muscle development
Subsequently, we explored the potential functions of dDMCs in skeletal muscle development. We extracted the 172 genes associated with muscle development and function annotation from the Gene Ontology Consortium (http://wiki.geneontology.org/index.php/Muscle_biology), and found that dDMCs were more enriched near these muscle-related genes than near random genes in the genome (P-value = 1.32 × 10⁻⁴, Mann–Whitney U test, Figure 4A). Similarly, genes with hypermethylated dDMCs in the promoter were significantly involved in muscle cell differentiation (Figure 4B), while those with hypomethylated dDMCs in the promoter were significantly associated with skeletal muscle tissue and organ development (Figure 4C). Subsequently, we further identified the TF-binding motifs enriched around the dDMCs and found that promoter dDMCs were highly enriched for binding motifs of myogenesis TFs (Figure 4D), such as the MEF2 family (MEF2A, -2B, -2C, -2D), which are known to play critical roles in myogenesis and morphogenesis (56,57). These results suggest that the promoter dDMCs potentially coordinate skeletal muscle development by modulating TF–DNA interactions.
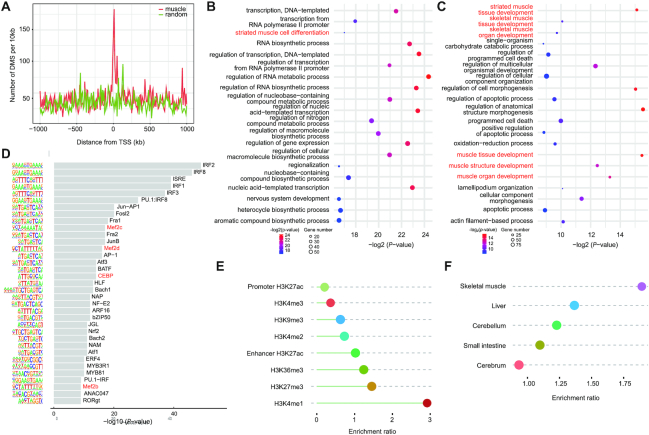
Functional implications of dDMCs in skeletal muscle. (A) The distribution of dDMCs around genes related to muscle biology (red) or around random genes in the genome (green). (B) GO enrichment analysis of the genes containing hypermethylated dDMCs in the promoter. (C) GO enrichment analysis of the genes containing hypomethylated dDMCs in the promoter. (D) Enriched TF-binding motifs around dDMCs in the promoter. (E) The enrichment ratio of dDMCs on histone modifications. (F) The enrichment ratio of dDMCs on the ATAC-seq peak in skeletal muscle, liver, cerebrum, cerebellum and small intestine.
We also examined histone modification around dDMCs using publicly available ChIP-seq data (33) and found that dDMCs were significantly enriched in enhancer-associated H3K4me1 marker peaks (OR = 2.92, Monte Carlo simulated P-value < 0.01) and depleted in promoter-associated H3K4me3 marker peaks (OR = 0.36, Monte Carlo simulated P-value < 0.01, Figure 4E), implying that some of these dDMCs were strongly associated with enhancer elements outside of promoter regions. To validate these data, we detected the dDMCs in chromatin-accessible regions using pig ATAC-seq data, the results of which suggest that 9.64% (4614/47 872) of the dDMCs were located in chromatin-accessible regions, and the enrichment ratio was 2.6-fold higher than random CpG sites (3.70%, 100 random sampling) in skeletal muscle. The enrichment ratio of dDMCs in ATAC-peak regions of skeletal muscle was also much higher than that in peak regions of other tissues (Figure 4F). Taken together, these results indicate that dDMCs play potentially important regulatory roles by affecting the activity of enhancers and promoters during skeletal muscle development.
DNA methylation regulates skeletal muscle development by affecting gene expression
To investigate the relationship between DNA methylation and gene expression during skeletal muscle development, we classified genes into four groups according to their expression level (high, medium, low and no expression) at each stage. We found that higher gene expression was accompanied by a lower DNA methylation level upstream of the TSS, and the extent of regulation was clearly related to the distance from the TSS (Figure 5A and Supplementary Figure S14). For genes that were not expressed, the DNA methylation level in the gene bodies was still lower than that of expressed genes (Figure 5A). Meanwhile, we calculated Pearson correlation coefficients (r) between the DNA methylation levels and gene expression levels of the corresponding genes across every developmental stage. The results indicated the DNA methylation level at promoters and gene bodies exhibited a negative and positive correlation, respectively, with the expression levels at a whole-genome level (Supplementary Figure S15).
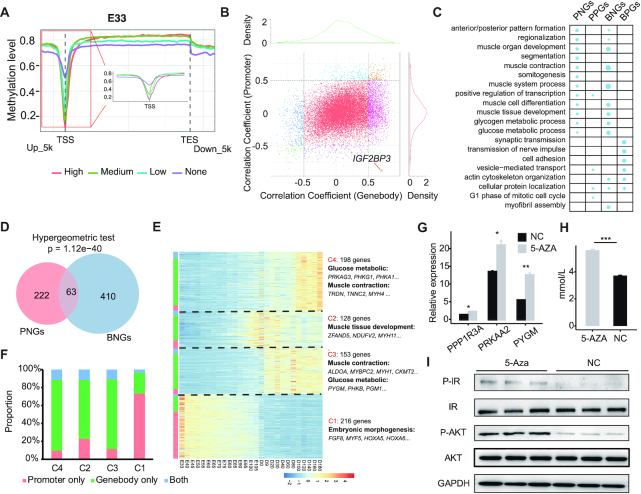
Association between DNA methylation and gene expression. (A) Average DNA methylation levels across and around gene bodies of genes with different expression levels at the E33 stage. Genes were classified into four groups according to their expression level (high expression, medium expression, low expression and no expression) by RNA-seq. (B) The distribution of correlation coefficients between DNA methylation (promoter and gene body) and the expression level of corresponding genes in skeletal muscle. (C) GO analysis of genes showing significantly positive and negative correlations between DNA methylation level and expression. (D) Venn diagram showing the overlap of PNGs and BNGs. (E) Heatmap showing the expression of PNGs and BNGs during skeletal muscle development. (F) The proportion of PNGs and BNGs in different co-expression clusters. (G) mRNA expression levels of PPP1R3A, PYGM and PRKAA3 following 5-Aza-induced demethylation in C2C12 cells. (H) The change in lactate content following 5-Aza-induced demethylation in C2C12 cells. For G and H, data represent the mean ± S.E.M of three independent experiments. An independent sample t-test was used to analyze the statistical differences between groups. *P < 0.05, **P < 0.01, ***P < 0.001. (I) Western blot showing the key node genes (AKT and IR) of the insulin signaling pathway in C2C12 cells treated with 5-Aza. NC, negative control.
At a single gene level, the distribution of correlation coefficients (Pearson's correlation) between DNA methylation (promoters and gene bodies) and gene expression of corresponding genes was almost completely symmetrical (Figure 5B), indicating that DNA methylation of both promoter and gene body regions may suppress or activate transcription of a subset of genes during skeletal muscle development. We detected 285 genes with a significantly negative correlation (Bonferroni's correction P-value < 0.05) between promoter methylation level and gene expression (Supplementary Table S9), denoted as PNGs. These genes were significantly enriched in GO terms for muscle organ development (P-value = 1.95 × 10⁻⁴), muscle contraction (P-value = 4.48 × 10⁻⁴) and muscle system processes (P-value = 8.29 × 10⁻⁴) (Figure 5C) and in KEGG for the insulin signaling pathway (P-value = 0.95 × 10⁻²). Meanwhile, more genes (n = 1773) exhibited a positive correlation (Bonferroni's correction P-value < 0.05) between gene body methylation and gene expression (denoted as gene body positive genes [BPGs]) than a negative correlation (denoted as gene body negative genes [BNGs], n = 473). Interestingly, the BNGs were also significantly enriched in similar GO biological processes to PNGs (Figure 5C). We found a significant overlap between PNGs and BNGs by hypergeometric testing using all test genes (n = 18 350) as the background (P-value = 1.12 × 10−40, Figure 5D). Hierarchical clustering based on the expression of both PNGs and BNGs during skeletal muscle development suggested that these two genes sets could be grouped into four co-expressed clusters (C1−C4) exhibiting developmental stage-specifically expressed patterns at the embryonic, fetal, neonatal and adult stage, respectively (Figure 5E). Interestingly, we found that the majority of PNGs were enriched in C1 (Figure 5F) and functionally associated with embryonic morphogenesis (Figure 5E), while most of the genes in the other three clusters were BNGs (Figure 5F) and closely associated with muscle contraction and the insulin signaling pathway (Figure 5E). These results suggest that both promoter and gene body methylation affect the expression of genes associated with muscle contraction and insulin signaling during skeletal muscle development.
To confirm the effect of DNA methylation on insulin signaling, we treated C2C12 myoblast cells with 5-Aza, a DNA methylation blocker. The results show that both the mRNA expression levels of PPP1R3A, PYGM and PRKAA3 (Figure 5G) and the lactate content (Figure 5H) were significantly upregulated following 5-Aza-induced demethylation. The results of western blotting also indicate that the phosphorylation status of AKT and IR (Figure 5I), the key node proteins of the insulin signaling pathway, was significantly increased, suggesting that DNA methylation represses activation of the insulin signaling pathway in myogenesis.
DNA methylation regulates IGF2BP3 by modulating SP1 binding in skeletal muscle
DNA methylation can affect gene expression by modulating the binding accessibility of upstream TFs (58,59); therefore, we next explored the regulatory roles of DNA methylation in TF binding accessibility during skeletal muscle development. We identified the TF-binding motifs enriched in the 285 PNGs. As expected, the promoters of these genes were highly enriched in binding motifs for myogenesis TFs, including SMAD2/3, MEF2B and SIX2. Next, we sought to construct a gene regulatory network by linking TFs directly to their target genes. Based on gene expression correlation and binding motif analysis, we identified a total of 466 links between 12 TFs and 167 target genes and constructed a putative gene regulatory network associated with skeletal muscle development (Figure 6A and Supplementary Table S10). In this network, the TFs SP1, ZNF263 and ZNF384 were the central regulators and coordinated the expression of genes involved in skeletal muscle development. For example, ZNF384 and ZNF263 could target MRF MYF5 (60). 121 genes were targeted by SP1, including many genes directly involved in muscle tissue development, such as ACTC1, FOXP1, MEOX2 and VGLL2.
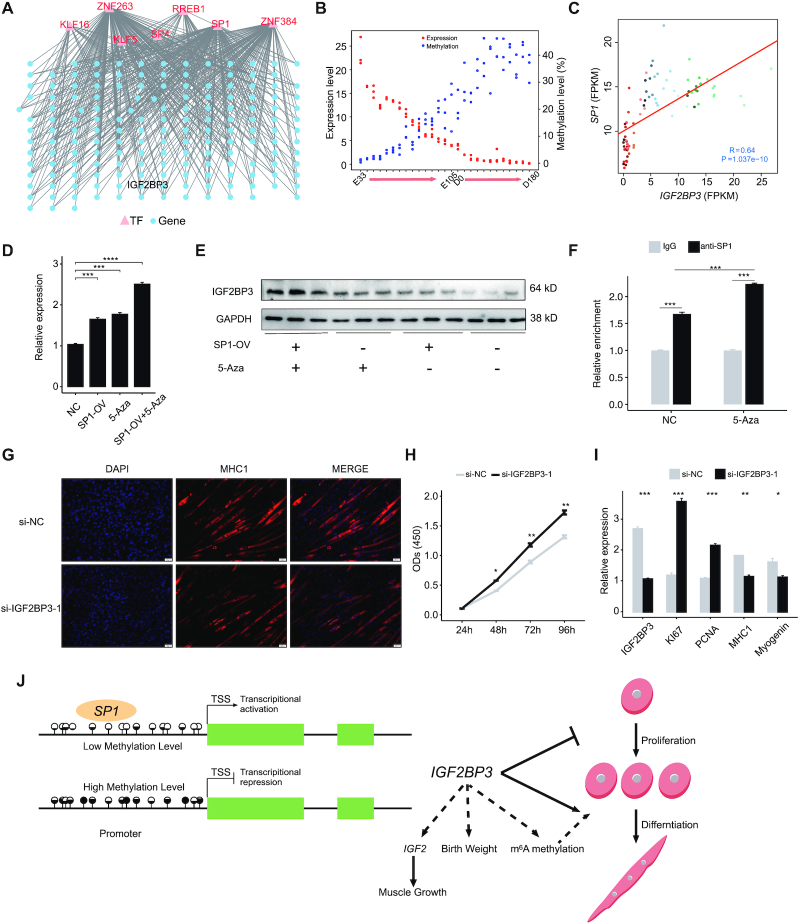
DNA methylation regulates gene expression by modulating TF binding accessibility. (A) The DNA methylation-meditated TF-gene regulatory network of skeletal muscle development. (B) The dynamic DNA methylation and gene expression of IGF2BP3 during skeletal muscle development. (C) RNA-seq analysis of the expression correlation between IGF2BP3 and SP1 during skeletal muscle development. The colored dots represent samples at different developmental stages as shown in Figure 1. (D) qPCR analysis of the mRNA expression level of IGF2BP3 following 5-Aza-induced demethylation and SP1 overexpression in C2C12 cells. NC, negative control. (E) Western blot showing the protein expression level of IGF2BP3 following 5-Aza-induced demethylation and SP1 overexpression in C2C12 myoblasts. (F) Validation of the direct interaction between SP1 and IGF2BP3 by ChIP-qPCR. (G) Immunofluorescence assay for the differentiation of C2C12 myoblast cells following IGF2BP3 knockdown. (H) CCK8 assay for the proliferation of C2C12 myoblast cells following IGF2BP3 knockdown. (I) qPCR analysis showing the mRNA expression of myoblast differentiation and proliferation markers following IGF2BP3 knockdown. Data are normalized to GAPDH mRNA and represent the mean ± S.E.M of three independent experiments. An independent sample t-test was used to analyze the statistical differences between groups. *P < 0.05, **P < 0.01, ***P < 0.001. (J) A diagram demonstrating the regulatory role of the DNA methylation/SP1/IGF2BP3 axis in myogenesis. In this model, DNA methylation regulates the expression and function of IGF2BP3 by modulating SP1 binding during myogenesis.
Among these, insulin-like growth factor 2 binding protein 3 (IGF2BP3) was a target for SP1 and represented the top candidate for genes displaying increased promoter methylation associated with decreased mRNA expression during skeletal muscle development (Pearson r = −0.88, Figure 6B). The IGF2BP3 gene encodes a member of the IGF2 mRNA-binding protein (IMP) family (61). A significantly positive correlation between the expression levels of SP1 and IGF2BP3 was observed during skeletal muscle development (Pearson's r = 0.64, P-value = 1.04 × 10⁻¹⁰, Figure 6C). Additionally, the expression levels of SP1 and IGF2BP3 were concordantly decreased during C2C12 myoblast differentiation (Supplementary Figure S16). SP1 overexpression significantly upregulated IGF2BP3 expression at both the mRNA and protein levels, which coordinated with 5-Aza induced demethylation (Figure 6D and E). ChIP-qPCR further demonstrated that SP1 could directly interact with the promoter of IGF2BP3, and the binding activity was enhanced after 5-Aza induced demethylation (Figure 6F and Supplementary Figure S17). Functionally, knockdown of IGF2BP3 significantly delayed differentiation and induced proliferation of C2C12 myoblasts (Figure 6G−I and Supplementary Figure S18), while 5-Aza-induced demethylation and overexpression of SP1 promoted differentiation and repressed proliferation (Supplementary Figures S19 and 20). The rescue experiments suggested that the promotion of proliferation and the inhibition of differentiation by IGF2BP3 knockdown could be reversed by co-transfecting C2C12 cells with SP1 over-expression vector (Supplementary Figure S21). Taken together, these results indicate that DNA methylation regulates the expression and function of IGF2BP3 by modulating SP1 binding in myogenesis (Figure 6J).
DISCUSSION
In the present study, we show the first dynamic maps of the genome-wide methylome and transcriptome of skeletal muscle across 27 developmental stages. To the best of our knowledge, this is also the deepest set of base-resolution maps of DNA methylation to date along with transcriptional profiles for skeletal muscle. We acknowledge that the samples collected for WGBS and RNA-seq analysis are bulk tissues rather than single muscle fiber. The fiber type composition and non-muscle cells as vasculature and immune cells at different developmental stages may partly influence the measurements of DNA methylation and gene expression levels. However, previous studies revealed that these potential biases are unlikely to confound the major conclusions (62). We believe these datasets allow us to comprehensively understand the potential role of DNA methylation in skeletal muscle development.
Our methylome profiles reveal that the global methylation level of skeletal muscle is ∼72% and decreases during development, which is most likely caused by the reduced expression of the DNMT1. PMDs are extended regions in the range of hundreds of kb in the genome that exhibit a reduced average DNA methylation level, cover gene-poor and transcriptionally inactive regions, and tend to be heterochromatic (1). In human tissues, PMD hypomethylation began during fetal development and is associated with chronological age (63). Our analysis suggests that PMDs widely exist in skeletal muscle, are highly conserved during development, and have depleted histone modification, implying that the global decrease in DNA methylation during skeletal muscle development could also contribute to an increased number and length of PMDs in the genome. Previously studies suggested that PMD hypomethylation accumulation in cancer mainly drive by mitotic cell division, despite strong expression of the DNA methylation maintenance machinery (63). However, the molecular mechanism of PMD during skeletal muscle development still requires further exploration.
The developmentally differentially methylated CpGs (dDMCs) ordered the skeletal muscles by developmental stage, reconstituting the developmental trajectory of porcine skeletal muscle in the present study. Development stage-specific differentially methylated regions often occur at distal cis-regulatory elements (64). We found that dDMCs were strongly enriched as enhancer histone H3K27me3 markers, in chromatin-accessible regions, and associated with skeletal myogenesis TFs and genes, suggesting a regulatory role for dDMCs in skeletal muscle development and in enhancer and promoter activity. The DNA methylation clock is presently the most precise molecular marker of age (38) and has been proposed in many species, such as humans (38), mice (39–41), whales (65), wolves and dogs (66). It is not yet known whether a similar epigenetic aging clock exists in pigs. One interesting finding was that we identified 75 CpG sites, the methylation status of which determined the developmental age of the pig. These CpG sites could be used as a biological clock to predict developmental status and age.
Although several studies have confirmed the effect of gene body DNA methylation on gene expression, the function of gene body DNA methylation remains poorly understood (5,6). Gene body DNA methylation influences transcript elongation or splicing and regulates intragenic promoter activity (5,67–68). Moreover, active genes have a greater methylation level in gene bodies than that in repressed genes in some tissues, which can be explained by their chromatin stage (69,70). Another interesting result from our study is that both promoter and gene body methylation negatively regulated the expression of genes involved in muscle contraction and insulin signaling during skeletal muscle development. These findings strongly suggest specific and critical roles of gene body methylation in skeletal muscle development.
Previous studies have well-established the repression function of DNA methylation at regulatory elements, such as at enhancer and promoter (10–11,71). Our study suggested DNA methylation might affect gene expression during skeletal muscle development by modulating TF–DNA interactions. Reconstruction of a gene regulatory network uncovered epigenetic and regulatory events associated with myogenesis and signaling pathways during skeletal muscle development. It is noteworthy that IGF2BP3 was the top gene displaying a negative correlation between promoter methylation and expression level, consistent with previous a report regarding the mouse heart (72). The m6A methylation reader IGF2BP3 (61) encodes a protein that binds the 5'-UTR of insulin-like growth factor 2 (IGF2), regulating its translation. A nucleotide substitution in intron 3 of IGF2 causes a major QTL effect on muscle growth in pigs (73). GWAS analysis has also revealed an association between IGF2BP3 and birth weight in humans (74). The present study demonstrates that DNA methylation negatively regulates IGF2BP3 expression by modulating SP1 binding, highlighting the regulatory mechanism of DNA methylation during skeletal muscle development. Thus, IGF2BP3 may be considered a candidate gene in breeding for meat production traits in the pig industry. Meanwhile, one caveat of our study is that recent studies posed a challenge in determining whether TF binding and other regulatory elements, such as enhancers and histone modifications, were the cause or consequence of DNA methylation change, because bidirectional regulation was observed between these elements and DNA methylation (8,11,75–76). Further investigation using new epigenetic editing tools for targeted DNA methylation will be required to elucidate the detailed mechanisms of dynamic DNA methylation during skeletal muscle development (77).
Taken together, our study highlights the functional and regulatory role of DNA methylation in skeletal muscle development. Our dynamic landscapes of the methylome and transcriptome provide an invaluable resource for defining the role of DNA methylation in skeletal muscle development and can be used as a reference for studies on animal breeding, muscle biology and related diseases. Going forward, it would be informative to integrate these data with epigenetic editing tools for targeted DNA methylation, single-cell sequencing and additional epigenetic modifications, such as RNA editing, m6A methylation and histone modification, which will greatly promote our understanding of the functions and mechanisms of DNA methylation during skeletal muscle development.
DATA AVAILABILITY
All the sequencing data of WGBS and RNA-seq have been deposited to Gene Expression Omnibus (GEO) at the National Center for Biotechnology Information (NCBI) under accession numbers GSE157045. The ATAC-seq data are available from the China National GenBank (CNGB; https://db.cngb.org/) Nucleotide Sequence Archive (CNSA) under accession number CNP0001159.
ACKNOWLEDGEMENTS
Authors’ Contributions: Z.T. designed and managed the project. Y.Y., X.F., M.C. and M.Z. administered the bioinformatic analysis. X.F. and J.Y. performed the experiments. Y.Y., X.F., Y.T. and S.L. performed animal work and collected biological samples. Y.Y. and Z.T. wrote and revised the manuscript. All authors approved the final manuscript.
SUPPLEMENTARY DATA
Supplementary Data are available at NAR Online.
FUNDING
National Natural Science Foundation of China [31830090]; National Key Project [2016ZX08009-003-006]; Basic and Applied Basic Research Foundation of Guangdong Province [2019B1515120059]; Chinese Academy of Agricultural Sciences [CAAS-ZDRW202006]. Funding for open access charge: National Natural Science Foundation of China [31830090].
Conflict of interest statement. None declared.
REFERENCES
1.
2.
3.
4.
5.
6.
7.
8.
10.
11.
12.
13.
14.
15.
16.
17.
18.
19.
20.
22.
23.
24.
25.
26.
27.
28.
29.
30.
31.
32.
33.
34.
35.
36.
37.
39.
40.
41.
42.
43.
44.
45.
46.
47.
48.
49.
50.
51.
52.
53.
54.
55.
56.
57.
58.
59.
60.
61.
62.
63.
64.
65.
66.
67.
68.
69.
70.
71.
72.
73.
74.
75.
76.