 APOBEC1 cytosine deaminase activity on single-stranded DNA is suppressed by replication protein A
Nucleic Acids Research


- Altmetric
Many APOBEC cytidine deaminase members are known to induce ‘off-target’ cytidine deaminations in 5′TC motifs in genomic DNA that contribute to cancer evolution. In this report, we characterized APOBEC1, which is a possible cancer related APOBEC since APOBEC1 mRNA is highly expressed in certain types of tumors, such as lung adenocarcinoma. We found a low level of APOBEC1-induced DNA damage, as measured by γH2AX foci, in genomic DNA of a lung cancer cell line that correlated to its inability to compete in vitro with replication protein A (RPA) for ssDNA. This suggests that RPA can act as a defense against off-target deamination for some APOBEC enzymes. Overall, the data support the model that the ability of an APOBEC to compete with RPA can better predict genomic damage than combined analysis of mRNA expression levels in tumors and analysis of mutation signatures.

INTRODUCTION
The apolipoprotein B mRNA editing enzyme complex-1 (APOBEC1) is a cytidine deaminase that catalyzes the conversion of cytosine to uracil in RNA and single-stranded (ss)DNA (1,2). APOBEC1 (A1) plays an essential physiological role in lipid metabolism by editing the apolipoprotein B (ApoB) mRNA in the small intestine (3). By introducing a stop codon through C to U editing, a lower molecular weight form of ApoB is produced in the small intestine in comparison to ApoB translated from the unedited mRNA in the liver. In humans, APOBEC1 belongs to the 11 member APOBEC family that have capabilities to catalyze C to U editing in RNA or deaminations of C to U in ssDNA (4). The roles of the APOBEC-mediated C to U editing or modification are diverse and include lipid metabolism (A1), antibody maturation (Activation Induced Cytidine Deaminase, AID), an intrinsic immune defense against retroviruses (the seven APOBEC3 enzymes (A3A-H, excluding E)) and retrotransposons (AID, A1, A3s), muscle development (A2), and other unknown functions (A4) (4).
The APOBEC family also has a conserved deaminase domain structure, but diversity in the number of deaminase domains per APOBEC (5). A1, A2, A4, AID, A3A, A3C and A3H have only one domain (6,7). A3B, A3D, A3F and A3G have two domains, but only the C-terminal domain has catalytic activity in human A3s (6,7). A1 also contains an ∼40 amino acid (a.a.) C-terminal domain extension that is not present in any other family members, except A2, which has no known deaminase activity (8,9). The C to U deamination in RNA directly edits the RNA coding sequence and is not permanent; however, in DNA the deoxyuridine acts as a promutagenic lesion since polymerases read this nucleotide as thymidine and has the potential to cause a permanent mutation in the DNA. The uracil can lead to transition mutations of C/G to T/A or other transversion mutations, depending on the type of DNA repair (4). For AID and A3 enzymes, this is used advantageously in the targeted mutagenesis of antibody genes to enable evolution of antigen specificity and antibody class switching or hypermutation of viral genomes to render them non-functional, respectively (10,11).
For APOBECs that contribute to ‘off-target’ genomic DNA deaminations, the ssDNA must be accessed during transcription, replication or dsDNA break repair (12–18). Late stage tumors show evidence of primarily the lagging strand of the replication fork acquiring APOBEC-induced mutations presumably due to the longer time that DNA remains single-stranded and that transformed cells often have genomic instability as a hallmark, which may mean that replication forks often become stalled, exposing even more ssDNA (12–17,19–20). Nonetheless, APOBECs must compete with replication protein A (RPA) that binds and protects ssDNA from nucleases (21,22). A3B, A3A and A3H Haplotype I (Hap I) have been shown to efficiently displace RPA, but it is unknown if this is the primary determinant for accessing genomic ssDNA (22).
At minimum, an APOBEC must be able to search the genomic DNA for the deamination motif and this can be done using a variety of processive scanning mechanisms that are termed facilitated diffusion (10,23–25). APOBEC enzymes, like many DNA repair or bacterial restriction enzymes, use Brownian motion driven diffusion to slide along the phosphate backbone, jump in three-dimensional (3D) space or bind different DNA strands simultaneously in order to remain bound to the DNA longer, increasing the search efficiency, rather than being in bulk solution (10,23–26). The mechanics of how A1 interacts with and deaminates ssDNA is not known. However, it is known that A1 requires cofactors A1CF or Rbm47 to deaminate ApoB mRNA and possibly other mRNAs, but does not require any for ssDNA deamination (9,27–31).
Understanding these DNA search strategies helps in understanding the cost to benefit ratio of these enzymes because it informs on their potential to carry out ‘on-target’ versus ‘off-target’ mutagenesis. Since APOBEC enzymes have particular deamination motifs in which they recognize cytosine, e.g. 5′TC, the ‘footprint’ of their activity has been identified in numerous cancers for AID, A3A, A3B and A3H Hap I (32). A1 which was believed until recently to have a sole role in ApoB mRNA editing, has been shown to also edit the 3′UTRs of diverse mRNAs, which appears to contribute to cellular homeostasis in innate immune cells (30,33–35). Most recently, A1 mRNA expression has been detected in Barrett's esophagus cells, a precursor to esophageal carcinoma (33). Sequencing of Barrett's esophagus and esophageal adenocarcinoma genomes and analysis of A1 mRNA expression in these cells led to the correlative conclusion that expression of A1 outside of the normal site (intestinal epithelial cells) may lead to genome mutagenesis and this may contribute to cellular transformation (33). This is similar to what has been documented for A1 in hepatocarcinoma mouse models and A3B in many cancers, but particularly breast cancer (36,37). Thus, A1 may be another family member that when overexpressed or expressed in non-normal cell types can cause somatic mutagenesis that has the potential to cause cell transformation. However, we are unable to predict the potential of A1 ‘off-target’ deamination due to a lack of biochemical information.
When A1 was discovered and studied initially, partially purified whole cell extracts from Rat intestines were used in order to maintain the RNA ‘editosome’ complex (38). Although experiments using cellular extracts enabled characterization of the A1 editing complex, there has been a paucity of data using recombinantly produced A1 to study ssDNA deamination (38–40). As a result, our understanding of the biochemical mechanism of A1 catalytic activity on ssDNA is lacking. Since the association of an APOBEC with cancer requires multiple lines of evidence such as matching a deamination motif to genomic mutation data, biochemical features, nuclear localization, and evidence of causing DNA damage, it is important to complete the characterization A1 using these criteria (41).
Using a biochemical approach, we determined that A1 cannot compete with RPA for ssDNA as proficiently as other A3 enzymes, suggesting that RPA can act as a defense against off-target deamination for some APOBEC enzymes. Consistent with these data, we found that A1 deamination activity resulted in only a low level of uracil-induced γH2AX foci in transformed lung cells. In conjunction with biochemical analyses, these data provide a model for A1 catalytic activity, which is unique from other APOBEC family members and involves a catalytically active high molecular mass molecule. Collectively, the data presented enable us to propose a simpler method for attributing somatic mutagenesis to APOBEC enzymes by using biochemical characteristics to predict activity in cells.
MATERIALS AND METHODS
Cell culture and generation of stable cell lines
NCI-H1563 and MRC-5 were obtained from ATCC and cultured in RPMI-1460 supplemented with 10% FBS, 10 mM HEPES, 1 mM sodium pyruvate and Dulbecco's-modified Eagle's medium (DMEM) supplemented with 10% fetal bovine serum (FBS), respectively. Lentivirus was generated by co-transfecting with GeneJuice (EMD Millipore), psPAX2, VSV-G and the pLVX-Flag lentiviral vector containing A1 into HEK-293T cells. Media (DMEM containing 10% FBS) was changed after 16 h and viral particles were harvested 48 h post-transfection. NCI-H1563 and MRC-5 were transduced with lentivirus in the presence of 8 μg/ml polybrene for 16 h. Transduced cells were selected with 1 μg/ml puromycin for a week and maintained with 0.25 μg/ml puromycin.
Immunofluorescence microscopy
NCI-H1563 and MRC-5 cells were treated with 2 μg/ml doxycycline for 24 or 48 h to induce A1 expression and then fixed with 100% cold methanol for 10 min. Cells were permeabilized with 100% cold acetone for 1 min and 0.5% Triton X-100 for 10 min. Anti-Flag (1:500, Millipore Sigma) and anti-phospho-H2AX antibodies (1:200, Millipore Sigma) in 3% bovine serum albumin in 4× saline sodium citrate (SSC) buffer were incubated 1 h. Primary antibodies were detected with Alexafluor-594 and Alexafluor-488-conjugated secondary antibodies (Invitrogen). Nuclei were stained with DAPI and cells were imaged using the Zeiss LSM700 system. Data were complied from 364 cells from three independent experiments.
Protein expression and purification
Recombinant baculovirus production of wild type GST-A1 and GST-ΔC A1 were carried out using the pFast-bac1 transfer vector according to the protocol for the Bac-to-bac system (Life Technologies). Recombinant GST-A1 baculovirus were then used to infect Sf9 cells at an MOI of 1. Infected Sf9 cells were harvested after 72 h of infection. Cell lysates were treated with RNase A unless indicated and were applied onto Bio-Scale Mini Profinity GST Cartridges for purification using the BioLogic DuoFlow Chromatography system and subjected to a series of salt washes. GST-A1 was eluted with 50 mM reduced glutathione and subjected to thrombin digestion to cleave the GST tag. The A3A, A3G and A3H Hap VII were purified as previously described (42–44).
The bacterial expression plasmid p11d-tRPA was obtained from Marc Wold (University of Iowa). This plasmid contained the three subunits of human RPA. The RPA expression in and purification from Escherichia coli was carried out as previously described (45).
Nuclease treatment assay
To determine the identity of the nucleic acids in purified A1, 500 nM of A1 was treated/untreated with Proteinase K (New England Biolabs) for 15 min at room temperature. The sample was then treated/untreated with RNase A (5 μg/ml, Roche Applied Science) or DNase I (1U/ml, New England Biolabs) for 15 min at room temperature. An equal volume of formamide containing 5 mM ethylenediaminetetraacetic acid (EDTA) was added and resolved on a 16% (v/v) denaturing polyacrylamide gel. The resolved nucleic acids were stained with SYBR-GOLD (Invitrogen) and gel images were obtained using a Chemidoc-MP imaging system (Bio-Rad).
In vitro deamination assay
Reactions were conducted with fluorescein labeled DNA substrates (Tri-Link Biotechnologies) at 37°C in RT buffer (50 mM Tris, pH 7.5, 40 mM KCl, 10 mM MgCl2 and 1 mM dithiothreitol (DTT)). RNA and ssDNA substrates were previously reported, unless indicated (22,46–47).
Processivity reactions were carried out using different deamination motifs as indicated in the results. All deamination motifs within each substrate were always followed by an adenine, which has been shown to be preferred by APOBEC enzymes (48,49). Processivity reactions were carried out under single-hit conditions to ensure a single enzyme-substrate encounter. A processivity factor can be calculated under these conditions by comparing the quantified total amount of deaminations occurring at the two sites on the same ssDNA with a calculated theoretical value of deaminations assuming they were different deamination events. A processivity factor greater than 1.0 means the majority of double deaminations are catalyzed by a single enzyme, and therefore x-fold more likely to deaminate processively. A non-processive enzyme has a processivity factor of 1.0 or more commonly, does not have a visible amount of deamination at two sites under the single-hit conditions of the reaction. The reaction is initiated by the addition of ssDNA (100 nM) containing two deamination motifs with 50 nM enzyme. The reaction time is varied on each ssDNA to ensure ∼10% substrate usage. The specific activity was calculated under single-hit conditions by determining the picomoles of substrate used per minute for a microgram of enzyme.
For the time course of A1 in comparison with A3A and A3H Hap VII, 100 nM of R-loop, hairpin, or linear ssDNA was incubated with 100 nM of enzyme for 2.5–60 min in order to compare activities. Reactions were initiated by the addition of the ssDNA substrate.
The intersegmental transfer assay reactions contained increasing concentrations of enzyme and substrate but the A1:ssDNA ratio was maintained (118 nt ssDNA: 100–500 nM, A1: 50–250 nM). Reactions were initiated by the addition of the ssDNA substrate.
For cycling assays, 100 nM of APOBEC enzyme was incubated with 0 μM (0×), 1 μM (10×), or 10 μM (100×) unlabeled ssDNA for 3 min at 21°C. The reaction was initiated with the addition of 100 nM of a labeled 85 nt ssDNA and proceeded for 10 min.
To determine the ability of A1 to deaminate in the presence of RPA, saturating amounts of RPA (300 nM) were preincubated with 100 nM of 69 nt ssDNA for 5 min before the addition of 200 nM of A1 or 25–50 nM of A3A, A3H Hap VII or A3G enzymes.
The deamination reactions were stopped using phenol:chloroform extraction followed by two additional chloroform extractions. The deaminations were detected by treating the substrates with Uracil DNA Glycosylase (New England Biolabs) and heating under alkaline conditions. Depending on the sizes of the ssDNA fragments, they were resolved on 10, 16 or 20% (v/v) denaturing polyacrylamide gels. Gel photos were obtained using a Chemidoc-MP imaging system (Bio-Rad) and integrated gel band intensities were analyzed using ImageQuant (GE Healthcare).
Size exclusion chromatography
To study the oligomerization state of A1, size exclusion chromatography (SEC) was used by loading 10 μg of purified A1 onto a Superdex 200 (GE Healthcare) size exclusion column. The running buffer contained 50 mM HEPES pH 8.0, 200 mM NaCl and 1 mM DTT. A Bio-Rad standard set was used to generate a standard curve from which molecular weight and oligomerization states of the enzymes were determined. Protein fractions eluted from SEC were resolved on 12% sodium dodecyl sulphate-polyacrylamide gelelectrophoresis (SDS-PAGE) and detected using anti-A1 (1:500, Millipore Sigma) and IRdye labeled goat anti-rabbit antibody compatible with the LI-COR/Odyssey system. The LI-COR/Odyssey software was used to quantitate the relative intensities of A1 in each lane.
Steady-state rotational anisotropy
Steady state fluorescence depolarization (rotational anisotropy) was used to measure the binding affinity of the enzymes to fluorescein-labeled ssDNA and RNA. Reactions were 70 μl and contained 10 nM fluorescein-labeled DNA substrate (118 nt) in RT buffer and RNase A treated or untreated enzyme was titrated into the solution until saturation. For the RNA, a 20 nt RNA (5′ fluorescein- GUG AUA UAU GUG UAU GAA AG) was used with previously RNase A treated A1, which was titrated into the solution until saturation. To measure the binding affinity of enzymes in the presence of RPA, 10 nM ssDNA was incubated with saturating amounts of RPA (30 nM) for 5 min before the addition of enzymes. A QuantaMaster QM-4 spectrofluorometer (Photon Technology International) with a dual emission channel was used to collect data and calculate anisotropy. Samples were excited with vertically polarized light 495 nm (6 nm band pass) and vertical and horizontal emissions were measured at 520 nm (6 nm band pass). Apparent dissociation constants (Kd) were obtained by fitting to a rectangular hyperbola or a sigmoidal curve using Sigma Plot 11.2 software.
Electrophoretic mobility shift assay
Varying concentrations of A1 and A3C enzymes (0.5–1.5 μM) were incubated with 50 nM of a 43 nt fluorescein labeled ssDNA (5′ fluorescein –ATT ATT ATT ATT CGA ATG GAT TTA TTT ATT TAT TTA TTT ATT T) in a reaction mix containing RT buffer with 4% glycerol for 5 min at 21°C before resolved on a 8% non-denaturing acrylamide gel at 4°C. Gel images were obtained using a Chemidoc-MP imaging system (Bio-Rad). The gel was transferred to a nitrocellulose membrane for immunoblotting, and detected using anti-A1 (1:500, Millipore Sigma) and IRdye labeled goat anti-rabbit antibody compatible with the LI-COR/Odyssey system.
Co-immunoprecipitation
293T cells were transfected with GeneJuice (EMD Millipore) at 70% confluency with 1 μg of pcDNA-A1-Flag or 2 μg total of pcDNA-A1-Flag and pcDNA-A1-HA. Cells were harvested and lysed using co-immunoprecipitation (co-IP) buffer (50 mM Tris-Cl, pH 7.4, 1% Nonidet P-40, 0.1% sodium deoxycholate, 10% glycerol, 150 mM NaCl) supplemented with EDTA-free protease inhibitor (Roche). Clarified supernatants were either treated or untreated with RNase A (Roche) before incubation with Anti-FLAG® M2 Magnetic Beads (Millipore Sigma) at 4°C for 2 h. Resin was washed and resuspended in Laemmli buffer in preparation for SDS-PAGE. Proteins were transferred to nitrocellulose membrane and detected with anti-Flag (1:1000, Millipore Sigma), anti-HA (1:1000, Millipore Sigma), anti-RPA (1:500, Invitrogen), anti-α-tubulin (1:1000, Millipore Sigma) and IRdye labeled goat anti-rabbit and anti-mouse compatible with the LI-COR/Odyssey system.
RESULTS
A1 mRNA is overexpressed in multiple cancer cells
In order to consider if A1 would be a candidate for ‘off-target’ activity, we analyzed The Cancer Genome Atlas for A1 mRNA expression in a panel of normal (N) and tumor (T) cells. A1 was previously identified in a separate study to be highly expressed in the transformed cells of Barrett's esophagus and esophageal adenocarcinoma genomes (33). We found that A1 was expressed even in normal esophageal cells and there was no significant difference in tumor cells (Figure 1A, ESCA_N and ESCA_T). However, we did observe an increase in A1 mRNA when comparing normal and tumor samples for colon (COAD), lung (LUAD), pancreatic (PAAD) and rectum (READ) (Figure 1A and B). Notably A1 was not expressed in any normal cells except those of the gastrointestinal tract, especially the pancreas, colon, rectum and stomach, consistent with known physiological roles and tissue specific expression of A1 (50). The largest increase in mRNA between normal and tumor cells was in lung adenocarcinoma (P-value 7.6675 × 10⁻¹²). This was an interesting finding since already A3B and A3H Hap I have been implicated in inducing somatic mutagenesis in lung cancers (51,52). As a result, we determined if A1 could cause DNA damage through deaminase activity in lung cells.
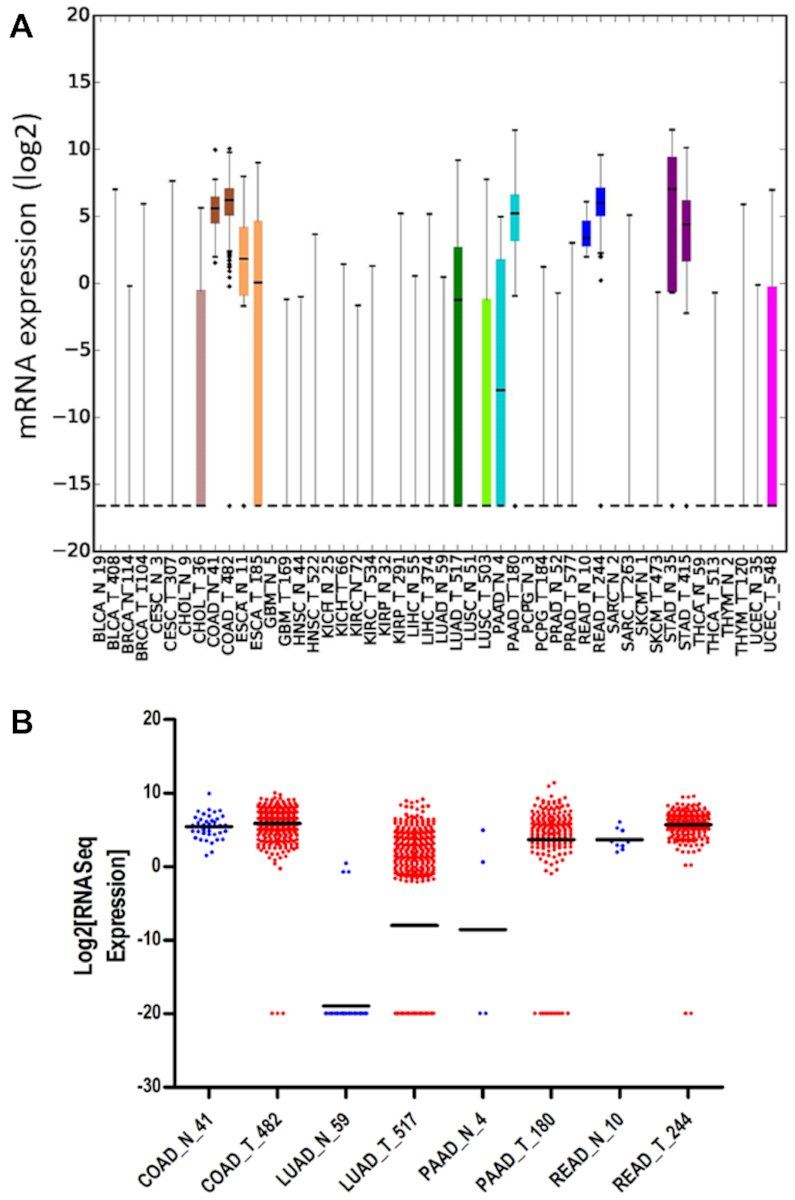
Analysis of A1 expression in multiple human malignancies. (A) A1 expression was analyzed in 24 different cancer types (T, tumor) and matching normal (N, normal) tissue controls using data from The Cancer Genome Atlas (TCGA) (cancergenome.nih.gov). Abbreviations are defined in Supplementary Table S1. The number of samples analyzed is the number shown on the x-axis. (B) Presentation of the four cancer types in which A1 was found to be significantly overexpressed by Mann–Whitney U test. The P-values are COAD, 0.0049; LUAD, 7.6675 × 10⁻¹²; PAAD, 0.0096; READ, 6.2491 × 10⁻⁵.
Expression of A1 can induce low levels of γH2AX foci
Although A1 physiologically functions as RNA deaminase, it has been shown to have DNA mutator activity (53,54). However, since there are multiple DNA repair pathways to repair uracil, the question remained whether A1 could cause enough deaminations on genomic DNA to have a physiological effect. To investigate the amount of DNA damage that could be induced by A1, we used the lung cancer cell line NCI-H1563. The qPCR analysis of this cell line showed A3B mRNA expression, but not A3A, A3H, or A1, relative to TBP mRNA (data not shown) (52). Thus, we constructed stable doxycycline (dox) inducible cell lines expressing A1-Flag (Supplementary Figure S1) to examine the effect of expression in cancer lung cells by quantifying the amount γH2AX foci which is a marker of stalled replication forks and dsDNA breaks (55,56). After 24 h of dox induction or no induction, the γH2AX foci were manually counted and results were represented by a histogram with bins of multiples of five for relative comparison (Figure 2A and B). The NCI-HC1563 cells had more γH2AX foci in the presence of A1 induction than the uninduced cells for the 11 to 15 γH2AX foci/cell bin (2.4-fold more than uninduced cells) and in the more than 15 γH2AX foci/cell bin (1.3-fold more than uninduced cells, Figure 2A and B). These increases are reflected in the lesser amount of γH2AX foci/cell for A1 expressing cells in the smallest bin (up to five γH2AX foci/cell). These foci were due to A1 deamination activity since there were less γH2AX foci/cell when NCI-H1563 cells were not transduced to express A1 but exposed to dox (Mock) and transduced to express A1, induced with dox, but also exposed to the Bacteriophage PBS2 uracil DNA glycosylase inhibitor protein (UGI), which is an inhibitor of uracil-DNA glycosylase in bacteria and eukaryotes (Induced + UGI, Figure 2A and B). We also induced A1 in NCI-H1563 cells for 48 h, but found no increase in γH2AX foci from 24 h, suggesting that the effect of A1 was already saturated after 24 h (Figure 2C and D). Overall, A1 could induce γH2AX foci, but at a low level, with only an at most 2.4-fold increase in γH2AX foci above controls (Figure 2B). We also investigated formation of γH2AX foci in another lung cell line, MRC-5, which are normal fetal lung cells that were transduced to express dox-inducible A1. However, there was no significant difference between the Mock, dox induced, or uninduced cells, with 70 to 80% of cells having up to five γH2AX foci (Supplementary Figure S2). Nonetheless, A3A expression in U2OS cells and A3B expression in 293T cells were previously reported to induce pan-nuclear staining of γH2AX foci (36,57). Our experimental system was consistent with these data since we found that A3A could induce pan-nuclear staining of γH2AX foci in both NCI-H1563 cells and MRC-5 cells (Supplementary Figure S3). Altogether, these data indicate that A1 can access ssDNA in the genome only under some cellular conditions and induces a low level of γH2AX foci. This could be due to inherent biochemical characteristics of A1, accessibility of DNA, or both.
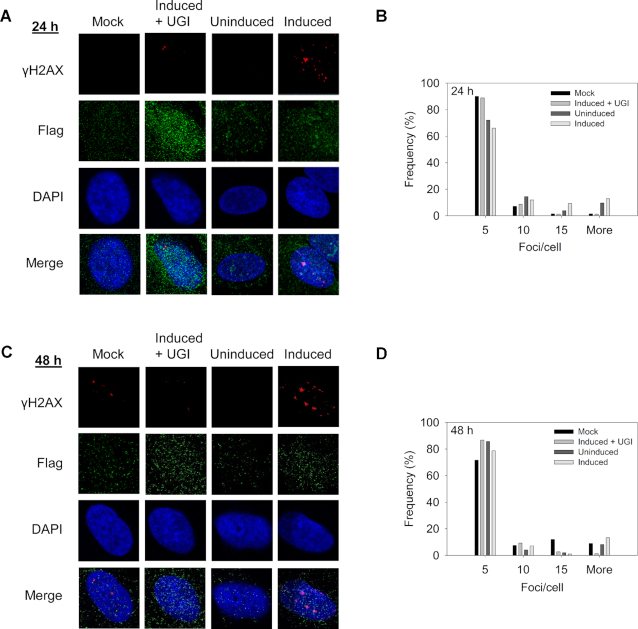
Effect of A1 expression on γH2AX foci. Cancerous lung cell line NCI-H1563 with or without stable doxycycline (dox) inducible A1-Flag was subjected to different conditions before staining with Flag and γH2AX antibodies. Nuclei were stained with DAPI. The NCI-H1563 were not transduced to express A1 and exposed to dox (Mock), transduced to express A1 and exposed to dox and uracil DNA glycosylase inhibitor (Induced+UGI), transduced to express A1 and not exposed to dox (Uninduced), and transduced to express A1 and exposed to dox (Induced). These conditions were carried out after (A andB) 24 h and (C andD) 48 h. (B andD) Histogram shows the numbers of foci/cell in bins of 1–5 (5), 6–10 (10), 11–15 (15) and 16 or more (More). The experiment was independently repeated in triplicate. Representative images are shown.
A1 has a preference to deaminate linear ssDNA
To understand why A1 is only weakly effective in deaminating genomic DNA, a biochemical analysis was conducted using a Sf9 cell system where we produced recombinant baculovirus that would express GST-A1. GST-A1 was purified in the presence of RNase A and the GST tag was subsequently cleaved. We also used for comparison A3A and A3H Hap VII that were purified in a similar manner (42,43). A3H Hap VII is a proxy for A3H Hap I. The A3H Hap VII differs only by a G105R polymorphism and is not rapidly ubiquitinated and degraded in cells, in contrast to A3H Hap I (58,59). APOBECs access genomic DNA during times when it is transiently single-stranded. This can occur in R-loops, hairpin structures, or during DNA replication. To test the type of substrate preferred by A1, we determined the deamination rate on ssDNA within an R-loop, a hairpin, and a linear ssDNA in a time course assay. We used a 5′TCA motif since this is the motif mutated most in APOBEC-associated cancers. Although the A1 recognition sequence in RNA is 5′AAC, on ssDNA it has been reported as a 5′TC motif based on sequencing DNA from mutator assays (60,61). A1, A3A and A3H Hap VII all exhibited similar activity on linear ssDNA as more than 50% of the substrate was deaminated by 30 min (Figure 3A and Supplementary Figure S4). On the R-loop, A1 and A3A had very low activity (<5%) whereas A3H Hap VII had slightly higher activity (14%) (Figure 3B and Supplementary Figure S4). A1 only had about 15% activity on the hairpin whereas A3A exhibited deamination activity similar to linear ssDNA and A3H Hap VII was inactive (Figure 3C and Supplementary Figure S4). These data are consistent with a bioinformatics study that concluded A3A preferentially deaminated hairpins that form in genomic DNA (47). Altogether, the data suggests that A1 prefers linear ssDNA, which would limit its ability to deaminate structured ssDNA substrates and suggests that this is one limiting factor in its activity. In particular, RPA can bind linear ssDNA, which may also block APOBEC activity. To address these questions in more depth, we first characterized the active form of A1 and characterized how APOBEC1 finds and deaminates cytosines on linear ssDNA.
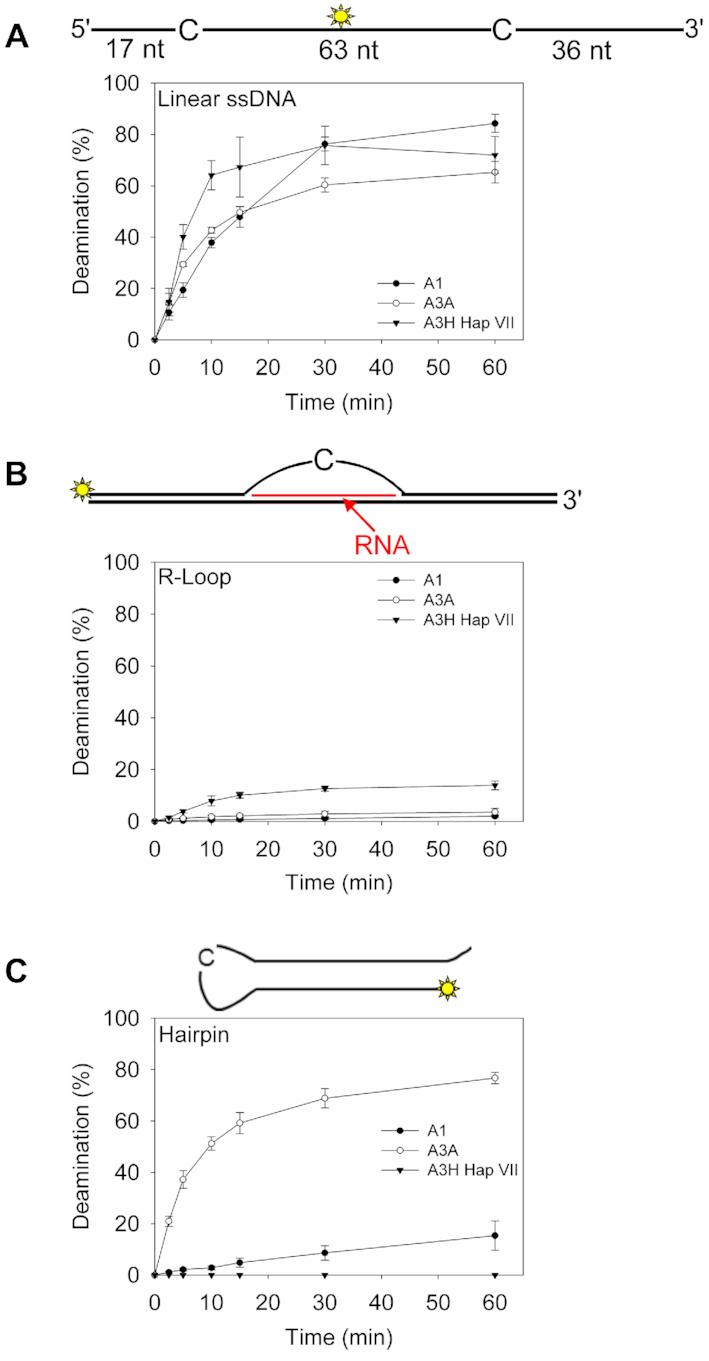
Deamination activity of A1 on different ssDNA containing substrates. A1 deamination activity during a time course deamination assay for (A) linear ssDNA, (B) R-loop and (C) hairpin substrates. A3A and A3H Hap VII were included for comparison. Error bars represent the standard deviation from three independent experiments. Corresponding representative gels are shown in Supplementary Figure S4.
A1 purifies from cells with bound RNA
Since A1 is known to be both cytoplasmic and nuclear, it is conceivable that A1 would bind cellular RNA in the cytoplasm as do most other APOBEC family members (48,62–63). This RNA stays bound to the APOBECs during purification from Sf9 cells and usually inhibits activity, necessitating RNase A treatment to ‘activate’ APOBEC enzymes (48,62). Enzymes that bind cellular RNA, like A3B, have been found to be less active in cells than enzymes that do not bind cellular RNA, like A3A (64). Alternatively, A3H has uniquely been identified to require this cellular RNA to mediate dimerization and enzyme stability (65–69). For A3H, the protein protects a part of the bound cellular RNA and it cannot be completely degraded enzymatically unless A3H is degraded with Proteinase K (68). First, to test if A1 purified bound to RNA, it was either not treated or treated with RNase A or DNase I before running on a denaturing gel and staining with SYBR Gold nucleic acid stain (Figure 4A). The gel showed that A1 was similar to other APOBEC enzymes and purified with RNA molecules (Figure 4A, compare RNase A – and + lanes). RNase A digestion completely removed the nucleic acids and DNase I digestion did not, demonstrating that A1 purifies bound to RNA, but not DNA (Figure 4A, compare RNase A + and DNase I + lanes). A1 did not protect the RNA from degradation and did not require Proteinase K digestion to completely degrade the RNA, indicating that the RNA is not part of the A1 structure, in contrast to A3H, but similar to other A3s (Figure 4A). We next determined if this bound RNA would inhibit A1 deamination activity.
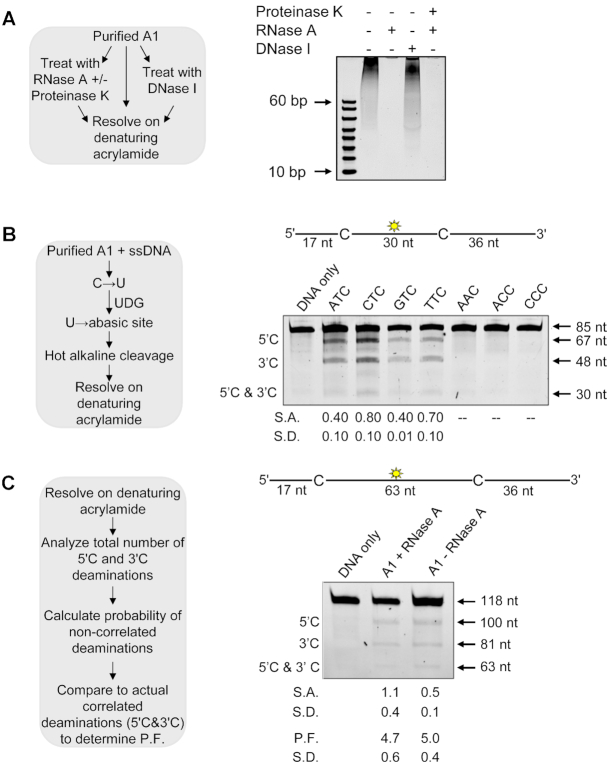
Characterization of A1 RNA binding and ssDNA deamination activity. (A) Determination of nucleic acids that co-purify with A1. Experimental outline (sketch) shown alongside visualization of samples after denaturing gel electrophoresis. (B) Determination of the preferential deamination motif of A1 using the Uracil DNA Glycosylase (UDG) assay (sketch, left). Deamination of an 85 nt ssDNA with deaminated cytosines spaced 30 nt apart and an internal fluorescein label (sketch, above gel). Single deaminations of the 5′C and 3′C are detected as the appearance of 67 and 48 nt fragments, respectively; double deamination of both residues results in a 30 nt fragment. The 85 nt ssDNA substrates contained different deamination motifs, as labeled above the gel, to determine the optimal substrate. The specific activity (S.A.) was measured as pmol substrate deaminated/μg enzyme/min (pmol/μg/min) (C) Deamination of a 118 nt ssDNA substrate with deamination motifs spaced 63 nt apart and an internal fluorescein level (sketch, above gel). Single deaminations of the 5′C and 3′C are detected as the appearance of labeled 110 and 81 nt fragments, respectively; double deamination of both C residues on the same ssDNA results in a 63 nt fragment. A1 was either treated or not treated with RNase A. Analysis to determine a processivity factor (P.F.) is illustrated in the sketch, left. (B and C) The measurements of S.A., P.F., or standard deviation (S.D.) from three independent experiments are indicated below the gel.
A1 prefers to deaminate 5′TC motifs and is partially inhibited by bound cellular RNA
To ensure we were testing A1 on a substrate where maximum activity could be achieved, we sought to further define the 5′TC motif preferred by A1. We used an 85 nt ssDNA with two identical deamination motifs with an internal fluorescein label and conducted an in vitro deamination assay in the presence of RNase A. We used two motifs on the ssDNA since the location of the motif on oligonucleotide substrates can affect the specific activity of some A3 enzymes (48). The specific activity was highest on the 5′CTC and 5′TTC motifs, although the 5′ATC and 5′GTC motifs were deaminated only 2-fold less (Figure 4B). The 5′AAC, 5′ACC and 5′CCC motifs had no detectable deamination. These data demonstrate that the preferred A1 deamination motifs are the same as A3A, A3B, and A3H Hap I that have been implicated in somatic mutagenesis (36,49,51). Due to the overlapping deamination preferences, the data emphasizes that identification of A1 mRNA in tumors alone cannot be used to identify whether A1 has a role in somatic mutagenesis. Further, based on A1 binding to RNA, we investigated if the RNA inhibited A1 activity, which would make it less active than other APOBECs, e.g. A3A, that does not bind RNA in cells (70).
To test if A1 could deaminate ssDNA in the presence of cellular RNA, we used a 118 nt ssDNA substrate with two 5′TTC motifs separated by 63 nt and containing an internal fluorescein label (Figure 4C). A1 was active in the presence of RNA, although there was a 2-fold decrease in the specific activity with bound RNA (Figure 4C, S.A., pmol/μg/min). This data demonstrates that A1 is unique among the APOBEC family members since it is the only member that does not require RNA for dimerization or stability (65–69), but can still bind it and remain active (48,62–63). Bound RNA causes near complete inhibition of the activity of other APOBEC enzymes purified from eukaryotic cells (48,64).
An essential component of the specific activity of DNA modification enzymes, including APOBEC family members, is their ability to bind and scan the nontarget ssDNA in search of deamination motifs. The processivity, termed facilitated diffusion, does not require an energy source and is based on Brownian motion driven diffusion that is facilitated by the electrostatic interactions of the enzyme and DNA phosphate backbone (10,23–25). We found that A1 has a processivity factor (P.F.) of 4.7 in the absence (+RNase A) or 5.0 in the presence (-RNase A) of cellular RNA (Figure 4C), meaning it is at least 4.7-fold more likely to make a processive deamination, than a nonprocessive one (Figure 4C). This processivity is similar to A3G and A3H Hap VII (Supplementary Figure S5).
Cellular RNA bound to A1 effects ssDNA binding
To investigate why A1 had a 2-fold decrease in specific activity when bound to cellular RNA, we used fluorescence polarization to measure the rotational anisotropy of the 118 nt deamination substrate used in Figure 4C for a range of A1 concentrations. Using this range of A1 concentrations, we determined the apparent dissociation constant (Kd) for A1 from ssDNA in the presence (Figure 5A) or absence (Figure 5B) of cellular RNA. The cellular RNA was removed by treatment with 100 μg/ml of RNase A during the purification process and was checked before anisotropy as in Figure 4A to ensure complete degradation. A1 was able to bind ssDNA similarly in the presence and absence of cellular RNA with a Kd of 351 nM (Figure 5A) or 343 nM (Figure 5B). However, in the presence of cellular RNA, the regression analysis of the binding curve best fit a sigmoidal relationship, with a Hill coefficient of 1.4 (Figure 5A). This indicates A1 cooperativity upon binding ssDNA. In contrast, when the cellular RNA was removed, the binding relationship was noticeably changed simply by visual inspection and best fit by least squares regression analysis to a noncooperative rectangular hyperbola (Figure 5A and B). These data suggest that A1 has interactions with other A1 molecules on ssDNA that are facilitated by the bound RNA (Figure 5A and B), but that this decreases the specific activity (Figure 4C). The conformation of the A1, but not the stability of A1 on ssDNA, as measured by the steady state Kd, was affected by the bound RNA. In the absence of cellular RNA, A1 binds an RNA oligonucleotide with an affinity similar to ssDNA (Figure 5C, Kd of 418 nM) and the binding is cooperative (Hill coefficient of 1.2). Altogether, the data demonstrate that RNA bound to A1, either cellular RNA or oligonucleotide RNA facilitates cooperative binding to nucleic acids. The cooperative binding of A1 when RNA is present correlates with a decrease in specific activity, suggesting that RNA may influence the activity of A1 in cells.
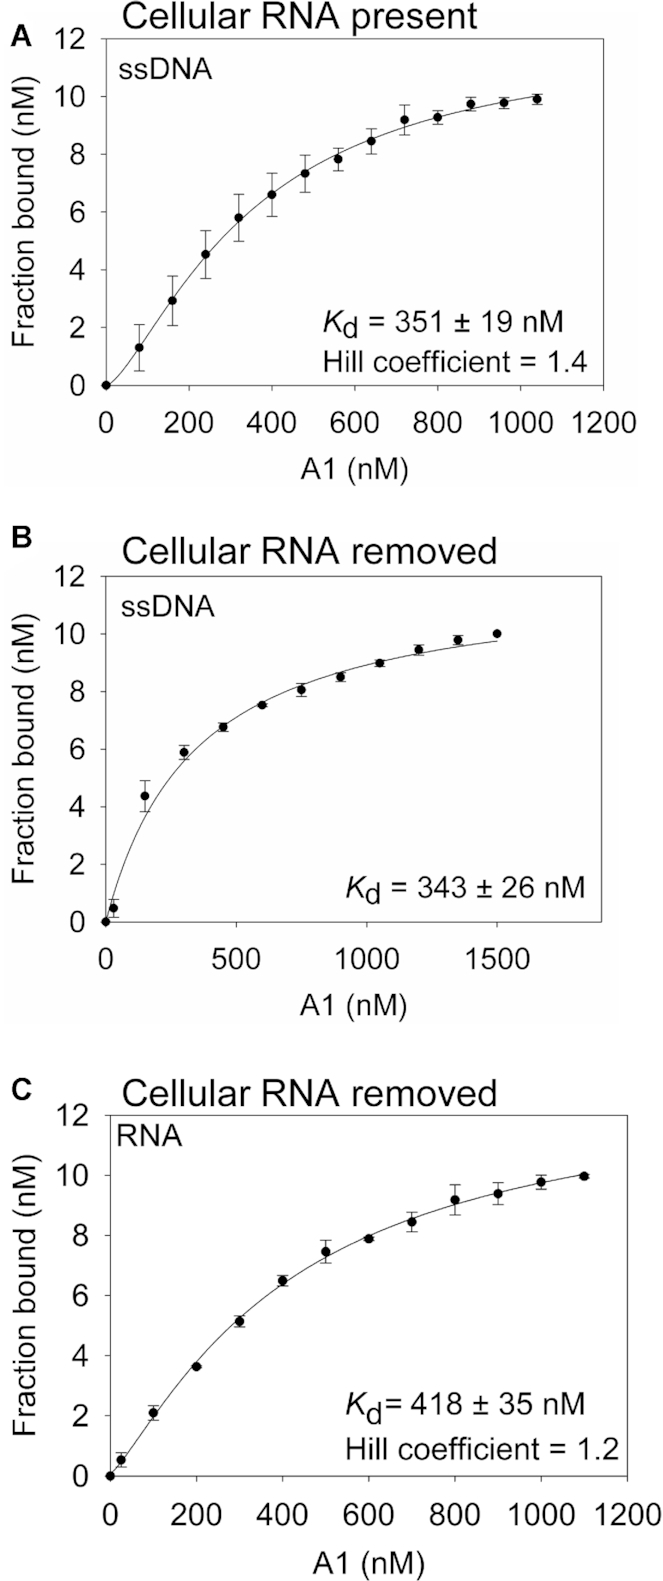
RNA influences cooperative binding. The apparent Kd and Hill coefficients of A1 from an 118 nt ssDNA were analyzed by steady-state rotational anisotropy for (A) RNase A untreated A1 and (B) RNase A treated A1. Based on least squares regression analysis, A1 not treated with RNase A best fit to a sigmoidal curve (A) and A1 treated with RNase A (B) best fit to a rectangular hyperbola. (C) The apparent Kd and Hill coefficient of A1 from a 20 nt RNA. (A–C) Error bars represent the standard deviation from three independent experiments.
A1 forms a large molecular weight oligomer in the absence of cellular RNA
Another factor that may influence APOBEC enzyme activity is the oligomerization state (71,72). To characterize the oligomerization state of A1, we used SEC. A1 has a molecular weight (MW) of 28 kDa and previous co-IP data indicated it formed an oligomer, but of unknown size (73,74). In the presence of cellular RNA, the A1 eluted in fractions 18–20, which corresponded to a large oligomer of 670 kDa (Figure 6A). This type of large MW is similar to other A3s that purify with bound RNA. However, when the RNA was degraded, either immediately before SEC (data not shown) or during purification (Figure 6B), the SEC still showed elution in a peak in fractions 18–20. There was a small, but observable peak at fraction 22, which is consistent with a hexamer MW of 158 kDa (Figure 6B). However, the major form of A1 appeared to be a ∼20-mer complex or greater. That A1 forms a large MW oligomer in the absence of cellular RNA is another unique feature from other APOBEC family members. We also verified oligomerization in cells using a co-IP by co-transfecting A1-HA and A1-Flag. A1-Flag was able to immunoprecipitate A1-HA both in the presence and absence of RNase A, consistent with the SEC data (Figure 6C). Using a historical A1 ΔC mutant, that was supposed to disrupt A1 oligomerization, we attempted to characterize the activity of a monomer of A1, but we found that the A1 ΔC mutant was still an oligomer and had no catalytic activity (Supplementary Figures S7 and 8). Notably, a tetramer of A3B was found to inhibit deamination on a moving transcription bubble, suggesting that a large A1 oligomer on ssDNA may be hindered in access to certain ssDNA sites (22).
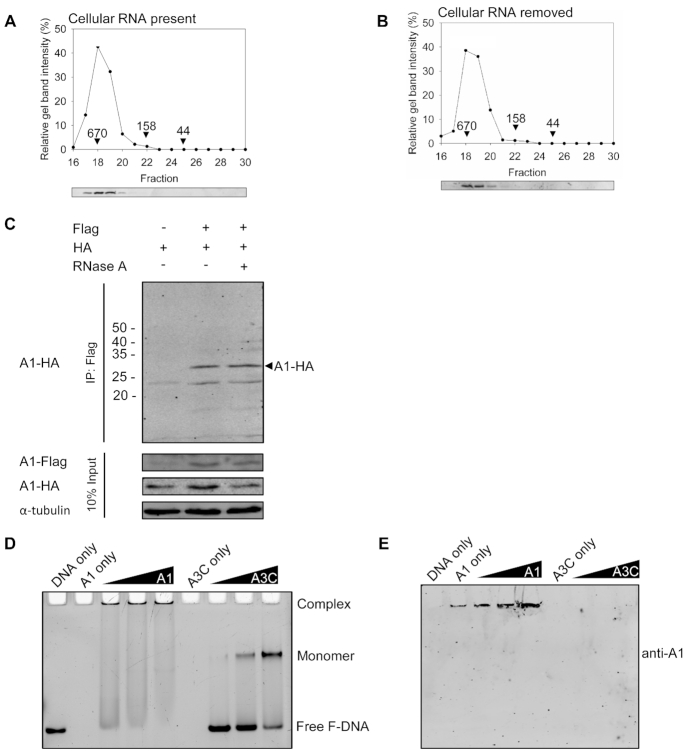
Oligomerization of A1. SEC profiles of 10 μg (A) RNase A untreated A1 and (B) RNase A treated A1 from a 10 ml Superdex 200 column was used to calculate the oligomerization state of the enzyme from a standard calibration curve (Supplementary Figure S6). Relevant molecular weights of the standards (650, 158 and 44 kDa) are shown on the graphs. (C) co-IP of A1-HA with A1-Flag. The A1-HA with A1-Flag were transfected in combination and the immunoprecipitation was immunoblotted with antibodies against Flag and HA in the absence or presence of RNase A. Cell lysates were blotted for antibodies against Flag, HA and α-tubulin. (D) Electrophoretic mobility shift assay of A1 or A3C bound to a 43 nt ssDNA. (E) Immunoblotting showed that high molecular mass A1 bound to ssDNA is retained in the well.
To determine if this form of A1 in solution also bound to ssDNA, we performed an electrophoretic mobility shift assay (EMSA). In order to observe a single species of A1 on ssDNA, using rotational anisotropy we found that a 40 nt ssDNA was the shortest length that A1 would bind (data not shown). Then, we incubated an increasing amount of A1 with a 43 nt ssDNA and resolved complexes on a nondenaturing acrylamide gel (Figure 6D). The shift of the DNA was into the wells. This was in contrast to A3C that is a 22 kDa monomer in solution and on ssDNA that created a well resolved single shift in the middle of the gel (Figure 6D) (72,75). Immunoblotting confirmed that the DNA in the wells was bound by A1 (Figure 6E). Considering the A3C monomer shift as a size marker, the data demonstrate that A1 binds to the ssDNA as a high molecular weight oligomer and that this is the active form of A1 on ssDNA.
A1 processivity involves sliding, jumping and intersegmental transfer
Another way to measure access to ssDNA is through processivity. By separating the 5′TTC motifs by different distances, features of the processive movement can be inferred. Figure 4C showed that A1 was processive on an ssDNA substrate separated by 63 nt in the presence or absence of RNA. These large distances are indicative of the ability to jump, which is a microdissociation from the ssDNA and a reassociation at another distal location in 3D space, but without entering the bulk solution (7,25). Thus, a jump is still considered a single enzyme-substrate encounter. To confirm that the processivity is due to jumping we annealed a complementary DNA molecule between the two cytosine motifs. A1 cannot bind to this dsDNA so it has to jump over the obstacle to undergo a processive deamination. Processivity was tested using A1 that had been purified away from cellular RNA. The processivity was not affected by the dsDNA (compare Figures 4C and 7A, P.F.) indicating that A1 can jump efficiently. Usually jumping tested in this manner can show a decrease in processivity if the enzyme tries to slide over the dsDNA and then instead dissociates and diffuses into the bulk solution (46). Since there was no decrease in processivity, the data suggested that A1 does not have a strong sliding motion. Since sliding occurs by Brownian motion driven bi-directional diffusion and without an energy source, the enzyme movements are ≤20 nt (23,76). We examined sliding by decreasing the distance between the two cytosine motifs to 30, 14 and 5 nt (Figure 7B–D). We observed that the processivity factor did not decrease when the two cytosine motifs were 30 nt apart, which is still in the range of jumping, but there was a decrease when the two cytosine motifs were 14 nt apart (Figure 7A–C). However, more striking was the complete loss of processivity when the two cytosine motifs were 5 nt apart (Figure 7D, no 5′C & 3′C band). Altogether, the data show that A1 can jump and slide, but sliding is not as efficient as jumping (Figure 7B–D).
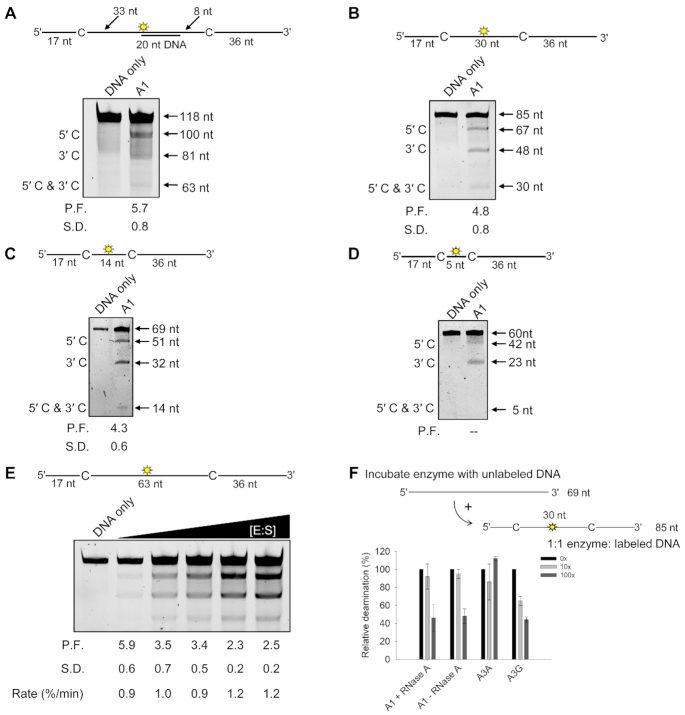
A1 predominantly uses long range processive mechanisms. Each substrate contains in internal fluorescein label to detect all possible deaminations (see sketch above gels). (A) Deamination of a 118 nt ssDNA, as in Figure 4C, but with a 30 nt complementary DNA annealed between the deamination motifs. (B) Deamination of an 85 nt ssDNA with deaminated cytosines spaced 30 nt apart, as described in Figure 4B. (C) Deamination of a 69 nt ssDNA with deaminated cytosines spaced 14 nt apart. Single deaminations of the 5′C and 3′C are detected as the appearance of 51 and 32 nt fragments, respectively; double deamination of both residues results in a 14 nt fragment. (D) Deamination of a 60 nt ssDNA with deaminated cytosines spaced 5 nt apart. Single deaminations of the 5′C and 3′C are detected as the appearance of 42 and 23 nt fragments, respectively; double deamination of both residues results in a 5 nt fragment. (A–D) The measurements of processivity factor (P.F.) and standard deviation (S.D.) from three independent experiments are shown below each gel. (E) Intersegmental transfer ability was determined by keeping the A1:ssDNA ratio constant but increasing the total reaction components. The measurements of processivity factor (P.F.) and standard deviation (S.D.), and the reaction rate (%/min) from three independent experiments are as shown below the gel. (F) Enzyme cycling was determined by adding increasing amounts of unlabeled ssDNA relative to the labeled ssDNA (0×, 10×, 100×). The labeled ssDNA had two deamination motifs separated by 30 nt for A1 (5′TTC), A3A (5′TTC) or A3G (5′CCC). Error bars represent the standard deviation from three independent experiments. Corresponding representative gels are shown in Supplementary Figure S9.
Since A1 forms an oligomer, it has multiple possible DNA binding sites and could undergo intersegmental transfer. This type of movement is a processive cycling mode where the enzyme can be processive, but also transfer to other DNA molecules in the solution by entering the bulk solution through a doubly-bound state (22,77). The enzyme is always bound to ssDNA on either the same or different DNA strand. The efficiency of the reaction increases as the enzyme and substrate are increased due to increased accessibility to different ssDNA strands. This can also be accompanied by an apparent decrease in processivity where more deaminations occur between two different ssDNAs rather than on the same ssDNA. When we tested this for A1, we observed an ∼2.4-fold decrease in processivity and 1.3-fold increase in reaction rate with increasing enzyme and substrate consistent with A1 being able to undergo intersegmental transfer (Figure 7E). To determine the efficiency of A1 to search through multiple competing ssDNA strands, we tested cycling in another experiment where enzymes are prebound to an unlabeled ssDNA and then a lesser amount of labeled ssDNA is added, and the deamination quantified. When there is a 10× excess of unlabeled ssDNA, A1 had no decrease in the apparent deamination ability, meaning that it can dissociate from the unlabeled ssDNA to find and deaminate a labeled ssDNA. However, at a 100× excess of unlabeled ssDNA, the deamination decreases to ∼40% of the level it was in the absence of any unlabeled ssDNA (Figure 7F and Supplementary Figure S9). This result was found in both the presence and absence of RNase A, indicating that cellular RNA does not influence A1 cycling on ssDNA (Figure 7F and Supplementary Figure S9). In comparison, A3A, a nonprocessive enzyme that cycles frequently shows no decrease in deamination even with 100× excess unlabeled ssDNA and A3G that is the most processive APOBEC with a long half-life on ssDNA (78) shows a step-wise decrease in deamination as more unlabeled ssDNA is added to the reaction (Figure 7F and Supplementary Figure S9). Thus, in comparison to other APOBECs, A1 has an intermediate level of cycling between DNA substrates.
A1 has a large decrease in deamination activity on ssDNA saturated with RPA
The ability of an APOBEC to cycle is important when considering competitive interactions on ssDNA, such as those that would have to occur if A1 was involved in somatic mutagenesis. In this scenario, the APOBECs need to access ssDNA during dsDNA break repair, replication or transcription where there are other protective single-stranded binding proteins present, such as RPA. Thus, we determined if the intermediate level of A1 cycling was sufficient to compete with RPA for ssDNA. To test this, we saturated a 69 nt fluorescein labeled DNA with RPA (Supplementary Figure S10) and incubated it with an APOBEC enzyme to achieve no more than 15% substrate usage. We used a high level of salt in the reaction to ensure that the reaction conditions did not enable a more stable association of proteins with ssDNA due to a lack of electrostatic competition. From these data, a specific activity was calculated and compared to specific activity on the ssDNA in the absence of RPA. In the absence of RPA, A1 and A3A had similar specific activities (Figure 8A, 1.4 and 1.6 pmol/μg/min, respectively) and A3H Hap VII and A3G had slightly higher and similar specific activities (Figure 8A, 2.6 and 3.1 pmol/μg/min, respectively). Although A3A is often cited as the most active APOBEC deaminase in vitro, this may be because it is the only A3 that is produced in soluble form from E. coli cells, the main recombinant system used (79). The A3s studied here were all produced in a eukaryotic Sf9/baculovirus expression system. However, most importantly, the specific activity of A3A is sensitive to the salt conditions, since it is a nonprocessive enzyme with a high off rate from ssDNA (43,80). We confirmed this by examining deaminase activities in low salt (40 mM KCl) and high salt (40 mM KCl and 10 mM MgCl2). We observed that A3A and A3G had an ∼2-fold higher specific activity in the low salt buffer whereas A1 and A3H Hap VII had an ∼2-fold higher specific activity in the high salt buffer (Supplementary Figure S11). The similarity of A3G to A3A in response to salt was expected since although A3G has a non-catalytic N-terminal domain that binds tightly to ssDNA resulting in its long half-life and processivity on substrates, it also has a nonprocessive C-terminal domain that has a high off rate from ssDNA and can bind ssDNA independently of the N-terminal domain (44,71). Thus, A3G is a tight binding enzyme with a salt sensitive catalytic site.
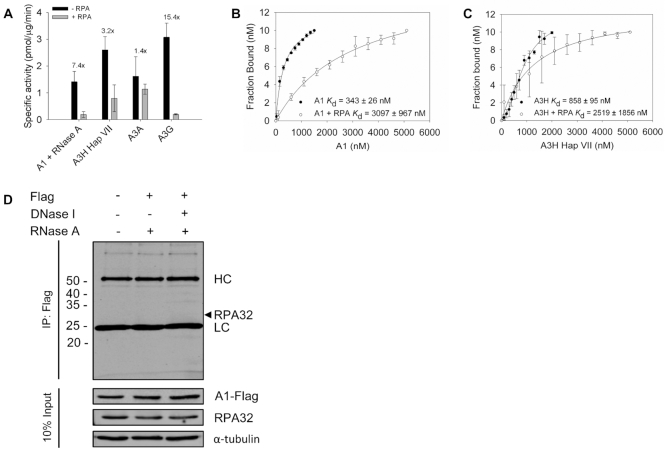
A1 cannot effectively compete with RPA to deaminate ssDNA. (A) The ability of A1 and A3 enzymes to compete with saturating amounts of RPA (Supplementary Figure S10) was determined by preincubating ssDNA with RPA (1:3) for 5 min before the addition of 50 nM (without RPA) or 200 nM (with RPA) of A1 or 25–50 nM of A3A, A3H Hap VII or A3G enzymes. Fold change in specific activity of - RPA in comparison to + RPA is shown on graph. Error bars represent the standard deviation from three independent experiments. Corresponding representative gels are shown in Supplementary Figure S5. (B andC) The apparent Kd in the presence and absence of RPA on a 118 nt ssDNA was analyzed by steady-state rotational anisotropy for (B) A1 and (C) A3H Hap VII. (D) Co-IP experiment using A1-Flag to determine if RPA was interacting with A1. No RPA was coimmunoprecipitated. The immunoprecipitation was immunoblotted with antibodies against Flag and RPA32 in the absence or presence of DNase I and the presence of RNase A. Cell lysates were blotted for antibodies against Flag, RPA32 and α-tubulin. The cross-reacting immunoglobulin heavy chain (HC) and light chain (LC) are labeled.
A1 was able to deaminate the ssDNA substrate in the presence of RPA, but had a 7.4-fold decrease in specific activity (Figure 8A and Supplementary Figure S5), consistent with cycling being a determinant in the ability to displace RPA from ssDNA (22). This was 2-fold less of a decrease than was quantified for A3G in the presence of RPA, an enzyme that does not cycle off of ssDNA substrates often due to a tight binding N-terminal domain (44,71,78) (Figure 8A and Supplementary Figure S5). For A3A or A3H Hap VII (a stabilized proxy for A3H Hap I) that were previously shown to compete with RPA (22), there was a 1.4- or 3.2-fold decrease in specific activity in the presence of RPA, respectively (Figure 8A and Supplementary Figure S5). Altogether, these results were consistent with the cycling data using increasing amounts of unlabeled ssDNA and showed that A1 had an intermediate ability to compete with RPA (Figures 7F and 8A). Despite this, the processivity factor of A1 remained the same whereas both A3H Hap VII and A3G processivity factors decreased in the presence of RPA (Supplementary Figure S5). This suggests that if A1 can get access to ssDNA, the processivity is dominant, but that it is less able to access the ssDNA overall as evidenced by the lower specific activity and ssDNA binding in the presence of RPA (Figure 8A and Supplementary Figure S5).
To investigate the reason for the decrease in specific activity, we used ssDNA saturated with RPA (Supplementary Figure S10) in a binding experiment to determine how much RPA changes the apparent Kd of the APOBECs. We compared A1 and A3H Hap VII since they were most similar in regards to cycling ability, specific activity in the presence of RPA, and they are both processive single domain APOBECs that oligomerize (22) (Figure 7). A3A is a single domain APOBEC but does not form stable oligomers (43,80). The binding data showed that RPA caused a 9-fold increase in the apparent Kd of A1, but only a 3-fold increase in the apparent Kd of A3H Hap VII (Figure 8B and C). These differences in the apparent Kd are consistent with the 7.4- and 3.2-fold decreases in specific activity of A1 and A3H Hap VII, respectively (Figure 8A), demonstrating a direct relationship between ssDNA access and activity. Since the data suggest that RPA prevents A1 from accessing DNA, we also performed a co-IP to determine if this is mediated through protein-protein or protein-DNA interactions between RPA and A1. We found that RPA did not co-immunoprecipitate with A1-Flag that A1 does not affect the expression of RPA in NCI-H1563 cells, indicating that there is not a protein-protein or signaling interaction that would enable RPA or A1 to influence each other (Figure 8D and Supplementary Figure S12). Instead, these data support that a direct competition of A1 for RPA saturated ssDNA effects A1 activity and DNA binding.
DISCUSSION
Studies indicating the potential for A1 to be a genomic mutator have used mutation of reporter constructs, mRNA expression and sequence context of mutations in tumors (33). However, there are no previous studies examining how A1 accesses single-stranded genomic DNA or measuring A1-induced DNA damage. Despite A1 being the first member of the APOBEC family to be discovered, and the family's namesake, it has not been fully characterized biochemically. Many of the previous studies have relied on in vitro transcription/translation systems and tagged protein and co-IPs for biochemical characterization (73,74). Here we provide analysis of A1 mutagenic potential using cell-based experiments and biochemical analysis and find that A1 is an unlikely candidate to contribute to somatic mutagenesis in the presence of RPA. Altogether, this study provides a framework to test APOBEC enzymes for somatic hypermutation potential, links the ability to displace RPA with deamination activity, and for the first time, provides a biochemical characterization of A1.
A3s have been shown to preferentially deaminate the lagging strand during DNA replication due to the greater abundance of ssDNA during its discontinuous synthesis or ssDNA generated during double-stranded DNA break repair (15–16,81–82). However, this ssDNA is normally not easily accessible as it is protected by RPA and A3s must be able to facilitate the dissociation of RPA in order to access their substrate (83,84). Previous studies from our lab have demonstrated that A3 enzymes that cycle on and off ssDNA frequently can compete with RPA in vitro for access to ssDNA (22). In this study, we were able to take advantage of the different abilities of A1 (low), A3A (high) and A3H Hap VII (medium) to cycle on and off ssDNA and compete with RPA and directly study the effect on A3 activity (Figures 7F and 8A–C). Using data from in vitro biochemical assays, we were able to establish a cause and effect relationship. Since A1 is a processive enzyme, unlike A3A, we used another processive enzyme, A3H Hap VII (an A3H Hap I proxy) to compare the abilities to compete with RPA (Figure 8A–C and Supplementary Figure S5). Importantly, we found that using ssDNA saturated with RPA, the decrease in specific activity of A1 and A3H Hap VII in the presence of RPA, correlated with the decrease in ssDNA binding ability (Figure 8B and C). Altogether, these data make a direct link between the ability of an enzyme to displace RPA (binding ability) and specific activity (deamination activity), which correlates strongly with the lesser ability of A1 to damage cellular DNA (Figure 2, γH2AX foci). Although we cannot directly relate these findings to conditions in the cell, several studies have identified key physiological activities of either RPA or APOBECs by using biochemistry and support that our results can be used reliably to interpret APOBEC activity in cells (46,85). Since our in vitro data correlate well with the low ability of A1 to induce γH2AX foci, overall the data support the conclusion that even though A1 mRNA is high in lung cancer (Figure 1), it is unlikely to make as much of an impact as cancers expressing A3A, A3B, or A3H Hap I (Figure 9A). However, evidence suggests that APOBEC-induced cancer evolution is more likely to occur than immune recognition of the cancer when only one APOBEC is expressed (52,86–88). Thus, we cannot exclude that A1 could simply have a slower effect on the genetic diversity of a cancer, if it is solely expressed, which may occur depending on the specific tumor conditions. This is supported by a cell-based study with A1, which was done in DT40 cells and used a GFP reporter that could be inactivated by A1 deaminations. However, it took 2 weeks to observe an effect and only an average of 0.71% of cells (range of 0.5% to 7.7% of cells) acquired an inactivating GFP mutation (33). In addition, another similar study demonstrated that A1 was unable to induce somatic hypermutation or class switching in murine B lymphocytes and fibroblasts (89). Thus, these data are in agreement with ours in that the activity of A1 on genomic DNA is low. This is in contrast with mutator studies performed in E. coli in which higher frequencies of mutations can be observed and suggest that A1 activity in E.coli is not representative of mammalian cells (53–54,89).
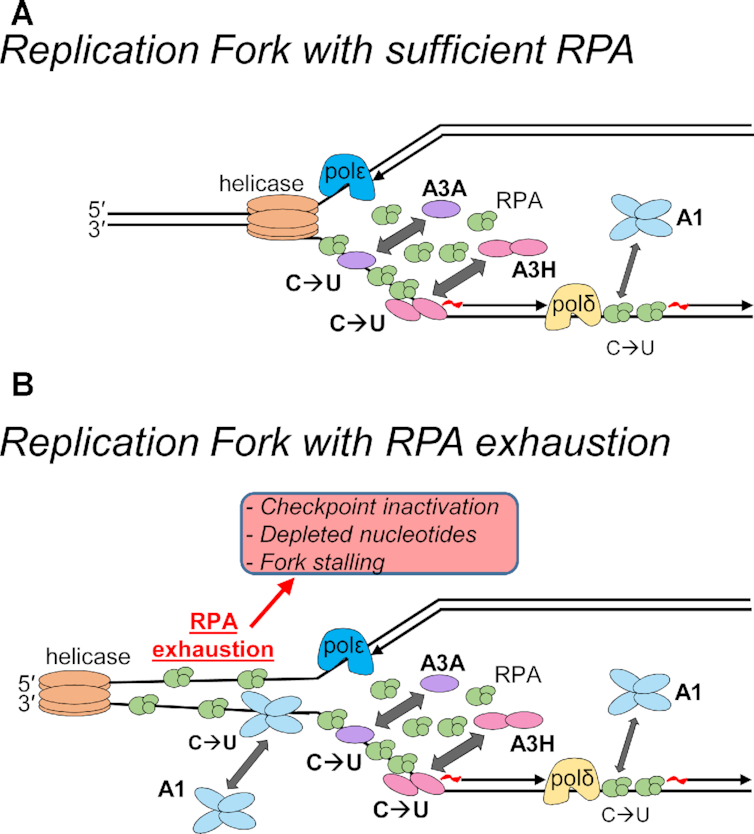
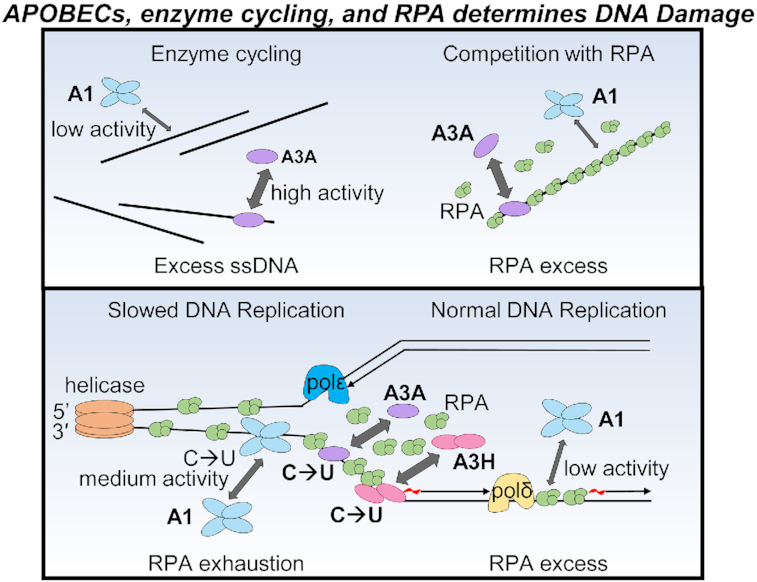
Model of APOBEC activity during normal and stressed DNA replication. (A) During DNA replication where there is sufficient RPA, there is little to no ssDNA exposed due to RPA binding and protecting ssDNA. Under these conditions, APOBEC enzymes need to compete with RPA for ssDNA by actively displacing RPA. This influences the functional specific activity of each APOBEC. A3A and A3H are better at displacing RPA than A1 and show higher cytosine deamination activity (large arrow and C→U) in vitro and/or in cells than APOBEC1 (small arrow and C→U). (B) Although there is normally 6- to 10-fold excess RPA than needed during normal DNA replication and temporary replication stress, RPA exhaustion can occur under sustained replication stress, such as in cancer cells. Conditions that cause RPA exhaustion can be checkpoint inactivation, depleted nucleotides and fork stalling due to DNA damage (90). Under these conditions, the large number of replication forks that accumulate ssDNA in the absence of active replication will have insufficient RPA for full protection. During RPA exhaustion, it is conceivable that A1 may be able to access ssDNA with a similar efficiency as A3A and A3H Hap I although the biochemical characteristics of A1, such as large oligomeric state and lesser ability to cycle in the presence of excess ssDNA may still limit its somatic mutation activity (medium arrow and C→U).
Additionally, what is not considered in any study to date is the impact of RPA exhaustion. RPA is estimated to be present at a 6- to 10-fold excess than what is needed to protect ssDNA during replication (90). This excess RPA is sufficient to deal with random perturbations of DNA replication where there are isolated events of polymerase stalling. However, if there are mutations in checkpoint inhibitors, replication inhibitors, e.g. DNA damage, or depleted nucleotide pools, then the RPA amount in cells reaches a threshold where it cannot bind and protect all the ssDNA (90). This state of RPA exhaustion leaves ssDNA exposed and in the presence of APOBEC enzymes would presumably allow excessive deamination events to occur. This may enable A1 to induce a similar amount of damage as A3A or A3H Hap I since the competition with RPA would be lessened (Figure 9B). However, the impact of the APOBEC-induced mutations depends on their number and at high levels can cause cell death by causing replication catastrophe or by inducing synthetically lethal mutations (91). Alternatively, high numbers of mutations can also induce neoepitopes that increase immune recognition (87). These effects of APOBECs are consistent with chemotherapeutic agents that try to induce such catastrophes in cells and may be the reason why APOBEC-induced mutations that are recovered from cancer genomes occur episodically (88,90). With sustained deamination activity in the presence of RPA exhaustion, the cell is unlikely to survive. The impact of A1 and other A3s under the conditions of RPA exhaustion warrant further study.
For A1 specifically, it is also important to consider that in addition to the lesser ability of A1 to compete with RPA, the enzyme has other biochemical characteristics that decrease the genomic mutation potential. These factors are important to consider with respect to somatic mutation potential of A1 in the presence of RPA exhaustion. A1 has a preference to deaminate linear ssDNA (Figure 3). A1 is unable to deaminate within R-loops and has minimal activity on hairpin DNA (Figure 3). Thus, the type of ssDNA available for A1 to deaminate is less than A3A, which is proficient on both ssDNA and hairpin DNA or A3H Hap VII that is proficient on ssDNA and R-loop DNA (Figure 3). A1 is also inhibited 2-fold by bound cellular RNA and has a large oligomeric state that may occlude it from structured ssDNA regions (Figures 4C and 6). The inhibition by cellular RNA was recently found to completely inhibit A3B activity in breast epithelial cells, in contrast to A3A that does not bind RNA (64). Thus, A1 specific activity, although similar to A3A in vitro would be decreased by at least 2-fold in cells due to the presence of RNA (Figures 4C and 8A). Lastly, the oligomeric state of A1 is larger than any APOBEC characterized to date. The tetramer of A3B was shown to inhibit its activity in R-loops and a lack of R-loop activity was also found for A1 (Figure 3B) (22). There may also be other consequences of a large oligomer in cells, such as being unable to deaminate closely spaced cytosines, resulting in dispersed deamination events or an inefficient search of the DNA to find cytosines for deamination (Figure 7D). Considered with the lower ability of A1 to compete with RPA, the data support the conclusion that both inherent biochemical characteristics of A1 and RPA decrease the ability of A1 to induce genomic DNA damage (Figure 9B).
Although the majority of APOBEC enzymes cannot deaminate RNA, their interactions with RNA have important functions. A3H is unique in that dimerization is mediated through a dsRNA molecule and mutations that disrupt RNA binding not only affect stability but also enzyme activity (65–69). In contrast, the other A3s, i.e., A3G and A3F can interact with RNA through formation of high molecular mass ribonucleoprotein particles, which inhibits deaminase activity (48,63). Degradation of the RNA can restore activity. However, for A1, only a 2-fold decrease in specific activity was observed for A1 despite being purified bound to an abundance of cellular RNA (Figure 4C). Additionally, unlike A3H, A1 did not protect the RNA from degradation (Figure 4A). A1 had similar binding affinities for ssDNA and RNA, suggesting that A1 can non-selectively bind both RNA and ssDNA while in search for its deamination motifs (Figure 5). It has been suggested that A1 had evolved from a ssDNA deaminase to edit RNA (9), which would require binding and scanning of both RNA and ssDNA. Altogether, the data suggest that although RNA binding of A1 decreases the specific activity, it is likely not a regulatory mechanism to prevent genomic DNA deamination as has been suggested for A3H, concomitant with its essential role as an RNA deaminase.
The biochemical analysis of A1 has revealed unique features in comparison to other APOBEC enzymes. Namely, we found that A1 formed a high molecular mass in the absence of cellular RNA indicating that A1 oligomers rely on protein–protein interactions and are uniquely not ribonucleoprotein complexes (Figure 6). This coincides with previous studies using transfected 293T cell lysates and in vitro transcribed/translated protein subjected to SEC analysis that have also found that A1 forms high molecular mass complexes (74,92). Both studies lacked an explanation as to why there was a large molecular mass but instead suggested it was due to protein aggregation, which is unlikely as no precipitate was observed. In our studies, the high molecular mass A1 was highly soluble and stable in solution. Additionally, A1 analytical ultracentrifugation studies have determined sedimentation coefficients that indicate when A1 is sequestered with co-factor A1CF and ApoB mRNA it forms a 60S complex in the cytoplasm whereas A1 forms a smaller 27S editing complex within the nucleus, but the full components of these complexes are not known (39,93). A1 mRNA editing activity is restricted to the nucleus even though cofactors are localized to both the nucleus and cytoplasm (94). These data suggest that the large oligomeric complex may be a regulatory mechanism to prevent A1 RNA deamination in the cytoplasm. Since RNA editing requires cofactors, the A1 homo-oligomer may block these interactions. However, it is not known how the A1 large molecular weight oligomer could potentially be disassembled. On ssDNA, the data support that A1 acts as a large oligomer since we found that ssDNA binding did not break up the large complex (Figure 6D and E). However, this high molecular mass complex likely contributed to less A1 activity in cells, in addition to other factors such as decreased activity in the presence of RNA and RPA (Figures 4C and 8A).
The large A1 oligomer may have also served an ancestral function. A1 is known to have appeared early in evolution, as far back as the anole lizard, in which A1 is a DNA, but not RNA cytidine deaminase (9). The DNA deaminase activity of A1 had a physiological function for restricting retrotransposons (92,95). Thus, perhaps the multiple binding sites increases the avidity of A1 for retrotransposon mRNA, enabling A1 to better restrict transposition at the reverse transcriptase/cDNA step where A1 could physically inhibit the reverse transcriptase or A1 catalyzed uracils would induce DNA repair mediated degradation of the retrotransposon cDNA (96,97). Importantly, this A1 oligomeric complex is independent of the C-terminal domain that was previously thought to be important for dimerization (Supplementary Figure S7) (73). Although the RNA-independent high molecular weight oligomer of A1 is unique in the APOBEC family, there are other known proteins that require a large oligomer to be active. One example is Hermes, a DNA transposase from the house fly (Musca domestica), that forms an octamer in cells even though in vitro activity can be obtained with a dimer form (98). The octomer (a tetramer of dimers) is proposed to increase the avidity for transposon ends within a mass of non-transposon DNA.
In conclusion, despite A1 having features suggesting its role as a potential genomic mutator, such as activity on 5′TC motifs and mRNA expression in multiple tumor cells (Figures 1 and 4B), its activity is largely abrogated by RPA (Figure 8A–C). This is consistent with cell-based analysis of γH2AX foci induced by A1 (Figure 2). Since the ability to bind ssDNA saturated with RPA would require RPA displacement (85) and A1 and A3H Hap VII deaminase activity correlated directly with this ability (Figure 8A–C), our data provide a robust measure of somatic mutation potential. That A1 has many distinct features regarding ssDNA deamination in comparison to other APOBEC family members suggests different original functions, although A1 shares the ability to restrict retrotransposons with other family members (92). Altogether, the data support a model in which the processive mechanisms of an APOBEC determines whether it can displace RPA and this correlates with their ability to induce somatic mutagenesis. Thus, it is not the availability of ssDNA in cancer cells per se that enable higher levels of APOBEC-induced ssDNA damage since there would also be more RPA accumulation, but rather the active process of the APOBEC to displace RPA that determines somatic mutagenesis potential.
ACKNOWLEDGEMENTS
The authors thank Milaid Granadillo Rodríguez for assistance with lentivirus production used to generate stable cell lines.
SUPPLEMENTARY DATA
Supplementary Data are available at NAR Online.
FUNDING
Canadian Institutes of Health Research [PJT-159560]; Natural Sciences and Engineering Research Council of Canada, Discovery Grant [RGPIN-2016-04113 to L.C.]. The open access publication charge for this paper has been waived by Oxford University Press – NAR Editorial Board members are entitled to one free paper per year in recognition of their work on behalf of the journal.
Conflict of interest statement. None declared.
REFERENCES
1.
2.
3.
4.
5.
6.
7.
8.
9.
10.
11.
12.
13.
14.
15.
16.
17.
18.
19.
20.
21.
22.
23.
24.
25.
26.
27.
28.
29.
30.
31.
32.
33.
34.
35.
36.
37.
38.
39.
40.
41.
42.
43.
44.
45.
46.
47.
48.
49.
50.
51.
52.
53.
54.
55.
56.
57.
58.
59.
60.
61.
62.
63.
64.
65.
66.
67.
68.
69.
70.
71.
72.
73.
74.
75.
76.
77.
78.
79.
80.
81.
82.
83.
84.
85.
86.
87.
88.
89.
90.
91.
92.
93.
94.
95.
96.
97.