 Histone methyltransferase ATX1 dynamically regulates fiber secondary cell wall biosynthesis in Arabidopsis inflorescence stem
Nucleic Acids Research


- Altmetric
Secondary wall thickening in the sclerenchyma cells is strictly controlled by a complex network of transcription factors in vascular plants. However, little is known about the epigenetic mechanism regulating secondary wall biosynthesis. In this study, we identified that ARABIDOPSIS HOMOLOG of TRITHORAX1 (ATX1), a H3K4-histone methyltransferase, mediates the regulation of fiber cell wall development in inflorescence stems of Arabidopsis thaliana. Genome-wide analysis revealed that the up-regulation of genes involved in secondary wall formation during stem development is largely coordinated by increasing level of H3K4 tri-methylation. Among all histone methyltransferases for H3K4me3 in Arabidopsis, ATX1 is markedly increased during the inflorescence stem development and loss-of-function mutant atx1 was impaired in secondary wall thickening in interfascicular fibers. Genetic analysis showed that ATX1 positively regulates secondary wall deposition through activating the expression of secondary wall NAC master switch genes, SECONDARY WALL-ASSOCIATED NAC DOMAIN PROTEIN1 (SND1) and NAC SECONDARY WALL THICKENING PROMOTING FACTOR1 (NST1). We further identified that ATX1 directly binds the loci of SND1 and NST1, and activates their expression by increasing H3K4me3 levels at these loci. Taken together, our results reveal that ATX1 plays a key role in the regulation of secondary wall biosynthesis in interfascicular fibers during inflorescence stem development of Arabidopsis.
INTRODUCTION
The shape and function of plant cells are largely determined by the cell wall. Almost all plant cells have a rigid primary wall surrounding the plasma membrane, but only some special cell types can synthesize secondary cell wall between the primary wall and plasma membrane when the cell elongation and expansion stop (1). Secondary cell walls, mainly composed of lignin, cellulose and hemicelluloses (xylan and glucomannan), play important roles in plant growth and development, such as the dehiscence of anthers and silique pods, mechanical support, water transport and a barrier against invasive pathogens (2–4). In addition, secondary cell wall accounts for most of plant biomass that is a major renewable bioenergy source for plants in the world (5).
Over the past decades, genetic and molecular studies have revealed that the secondary wall biosynthesis is precisely regulated by a multi-level transcriptional regulatory network (1,6). Several NAC (NAM, ATAF1/2 and CUC2) transcription factors have been identified as the first layer of the master switch genes for the secondary wall development. In Arabidopsis thaliana, NAC SECONDARY WALL THICKENING PROMOTING FACTOR1 (NST1) functions redundantly with SECONDARY WALL-ASSOCIATED NAC DOMAIN PROTEIN1 (SND1) in regulating the deposition of secondary walls (7,8). Simultaneous mutations of NST1 and SND1 resulted in a severe reduction in secondary cell wall thickening in the fiber cells (7,8). Both NST1 and SND1 bind to the secondary wall NAC binding element (SNBE) sites in the promoters of MYB46, MYB83 and MYB103, which serve as the second-level master regulators controlling secondary wall biosynthesis, and improve the biosynthesis of main components of fiber secondary cell walls (9,10). In addition, VASCULAR-RELATED NAC DOMAIN6 (VND6) and VND7 also act as master regulators to specially regulate vessel differentiation in xylem tissues of Arabidopsis (11). Ectopic expression of VND6 and VND7 activates metaxylem and protoxylem formation, respectively (11,12). Therefore, how to strictly regulate the expression of these NAC master switch genes during secondary wall synthesis in sclerenchyma cells is very important for plant growth and development.
Previous studis have shown that the NAC master switch factors of secondary wall biosynthesis are controlled by their upstream factors during stem development (13,14). For instance, Arabidopsis MYB26 positively regulates the expression of NST1 and NST2 for activating the endothecium secondary wall formation (4). Several negative regulators have also been reported to control the expression of the NAC master switch genes. The mutation of Arabidopsis WRKY12 led to ectopic deposition of secondary wall thickening in pith cells (13). Further analysis indicated that WRKY12 negatively regulates the expression of NST2 and zinc-finger transcription factors (C3H14 and C3H14L), resulting in inhibiting secondary wall biosynthesis in pith cells (13,15). Recently, E2Fc, a key upstream regulators of VND6 and VND7 screened by a large scale of yeast one-hybrid screen, was shown to function as a transcriptional repressor or activator to regulate the secondary wall biosynthesis in a dose-dependent manner (14). Despite the importance of the NAC master regulators in switching on or off the secondary wall biosynthesis, our knowledge of the precisely regulatory mechanisms controlling the expression of these NAC master switch genes in different cell types is still elusive.
Increasing evidences have shown that epigenetic regulation is involved in vascular patterning and secondary cell wall biosynthesis (16,17). A suite of genes associated with de novo methylation and methylation maintenance are co-expressed with cell wall biosynthesis-related genes in root vasculature in Sorghum bicolor (18). In woody species, the histone variant EgH1.3 from Eucalytus grandis is able to regulate lignin biosynthesis through interaction with EgMYB1 transcription factor during wood formation (19). Genome-wide analysis of the histone methylations in developing xylem of E. grandi revealed that a large number of secondary wall regulator genes, including NST1 and SND1, were highly enriched with H3K4 trimethylation (H3K4me3) (17,20). However, how H3K4me3 at these NAC master regulators is established and regulated during secondary wall formation remains largely unknown.
Extensive studies have shown that histone lysine methylation plays a critical role in epigenetically regulating various biological processes (21,22). Histone methylation modifications are mainly established by the evolution-conserved SET-domain family proteins (23–25). Seven Trithorax group (TrxG) methyltransferases, ATX1, ATX2, ATX3, ATX4, ATX5, SDG2 and SDG25, have been proposed to direct the H3K4 methylation in Arabidopsis (26,27). Among them, ATX1 has been shown to tri-methylate H3K4, and loss of ATX1 led to hypomethylated H3K4me3 on FLOWERING LOCUS C (FLC), reduced FLC expression and promoted flowering (28). ATX1 was also identified to be involved in H3K4 tri-methylation on genes that are required for meristem homeostasis of shoot and root apex, leaf and floral organ development (24,29–31), as well as for the transcriptional activation of stress-response genes (32,33). Although histone methylation modifications play critical roles in secondary wall biosynthesis, the functions of these H3K4-histone methyltransferases in regulating the H3K4me3 levels at the NAC master regulators remain to be elucidated.
In this study, we identified that Arabidopsis ATX1 is involved in the positive regulation of secondary wall biosynthesis in interfascicular fibers through its histone methylation activity. Genome-wide analysis indicated that, with Arabidopsis inflorescence stem development, the transcription levels of genes associated with secondary wall synthesis were up-regulated coordinately with the increased levels of H3K4 methylation. Loss-of-function mutation in ATX1 disrupts the secondary wall thickening of the interfascicular fiber cells. We further demonstrated that ATX1 is an upstream regulator of the NAC master switch factors, NST1 and SND1, controlling secondary cell wall synthesis and fiber differentiation during stem development. Taken together, our findings uncover a novel mechanism by which an H3K4 methyltransferase regulates the transcriptional programming of secondary wall biosynthesis in interfascicular fibers during Arabidopsis inflorescence stem development by directly modulating H3K4me3 levels of NST1 and SND1.
MATERIALS AND METHODS
Plant materials and growth conditions
Arabidopsis thaliana Columbia ecotype (Col-0) was used as the wild-type. Mutants atx1-2 (SALK_149002C), atx1-4 (SAIL_409_A10) atx2-2 (SALK_117262), atx3-2 (SAIL_582_H12), atx4-1 (SALK_060156), sdg2-4 (SALK_120450), sdg25-1 (SALK_149692C), snd1 (SALK_015495C), nst1 (SALK_120377C) were ordered from the Nottingham Arabidopsis Stock Centre. Mutant atx5-2 (SAIL_705_H05) was obtained from Dr Yan He (China Agricultural University) and Dr Zhengyi Xu (Northeast Normal University). The nst1 snd1 double mutant was produced by genetic hybridization of nst1 with snd1. Arabidopsis seeds were sterilized in 75% (v/v) ethanol for 30 s, 10% (v/v) sodium hypochlorite solution for 10 min, and then washed by sterilized water for several times, finally dispersed on Murashige and Skoog (MS) medium. After exposure to white light (80 μm−2 s−1) for 10 days and long-day (LD, 16 h of light, 8 h of dark, 18°C), 75% relative humidity condition in a chamber, the seedlings were transferred into soil and grew in the greenhouse in a long day condition (16 h of light, 8 h of dark, 22°C).
Gene cloning, plasmid construction and generation of transgenic plants
To construct the vectors of ATX1pro:Myc-ATX1, ATX1pro:NST1 and ATX1pro:SND1, 2400 bp upstream sequence of ATX1 was amplified from the genomic DNA of A. thaliana by PCR. The coding sequences of ATX1, NST1 and SND1 were amplified from cDNA obtained by reverse transcription of RNA of A. thaliana, respectively. The ATX1 promoter was fused with the coding sequence of ATX1 with Myc label, NST1 and SND1, respectively, and cloned into a modified pCAMBIA-1305.1 vector (GenBank: AF354045.1), in which hygromycin resistance gene has been replaced with kanamycin resistance genes, and the GFP reporter gene was removed.
To generate the promoter-GUS reporter constructs, the promoters of ATX1, ATX2 (−2091 to +1), ATX3 (−2280 to +1), ATX4 (−2165 to +1), ATX5 (−2150 to +1), SDG2 (−2973 to +1) and SDG25 (−2854 to +1) were amplified by PCR and fused with the GUS reporter into pCAMBIA-1305.1, respectively. To construct 35S:Flag-ATX1, the coding sequence of ATX1 was amplified and cloned into a pCXSN-Flag vector (34).
All plant binary constructs were transformed into Agrobacterium tumefaciens cells (strain GV3101). The ATX1pro:ATX1, ATX1pro:Myc-ATX1, ATX1pro:NST1, and ATX1pro:SND1 constructs were stably introduced into the atx1-2 mutant using the floral dip method (35), respectively. Similarly, the 35S:Flag-ATX1 construct was transformed into the wild-type and snd1 nst1, and the ATX1pro:GUS, ATX2pro:GUS, ATX3pro:GUS, ATX4pro:GUS, ATX5pro:GUS, SDG2pro:GUS and SDG25pro:GUS were transformed into wild-type plants described above.
RNA extraction and RT-qPCR
Total RNA was extracted from stems using Biospin Plant Total RNA Extraction Kit (Bioflux, China). Single-strand complementary DNA (cDNA) was synthesized using Primescript RT reagent kit with gDNA Eraser (Takara, Dalian, China). Quantitative real time-PCR (RT-qPCR) reactions were performed with gene-specific primers and the SYBR Premix Ex Taq (Takara, Dalian, China) on a TP800 Real-Time PCR System (Takara, Japan). Primer sequences for RT-qPCR analysis are listed in Supplementary Data Set 8.
Microscopy
For histochemical staining, the basal internode of Arabidopsis inflorescence stems grown to 20 cm was harvested. The stems were fixed with formalin-acetic acid-alcohol (FAA) and embedded in paraffin after dehydration with gradient ethanol. Semi-thin sections (15 μm) were cut using Ultra-Thin Semiautomatic Microtome (FINESSE 325, Thermo). These sections were dewaxed with xylene and rehydrated with gradient ethanol and then observed with OLYMPUS DP73 microscope after staining with 0.1% toluidine blue.
For transmission electron microscopy, the basal stem of Arabidopsis grown to 20 cm was fixed with glutaraldehyde and embedded in spon-812 resin (36). Embedded plant materials were sectioned into 90 nm-thick sections and stained by uranium acetate and lead citrate, then observed with Talos F200X transmission electron microscope. The images were analyzed using ImageJ software (National Institutes of Health, USA; https://imagej.nih.gov/ij/) for quantifying morphological parameters of cells.
Chromatin immunoprecipitation and library preparation
The stem samples were collected at different developing stages from Arabidopsis Col-0, atx1-2 and ATX1pro:Myc-ATX1/atx1-2 plants, respectively. The harvested stems were cross-linked with 1% formaldehyde in a vacuum and ground into powder in liquid nitrogen before Chromatin immunoprecipitation (ChIP). ChIP was performed as described previously (37,38) with three biological replicates. Chromatin was fragmented to ∼500 bp by ultrasound and immunoprecipitated using H3K4me3 specific antibody (Millipore, 04-745), Flag (Sigma, A8592) and Myc (Sigma, M4439), respectively. The immunoprecipitated DNA (5 ng) was used for the ChIP-seq DNA library preparation or RT-qPCR analysis. The immunoprecipitated chromatin was quantified by RT-qPCR using the specific primers given in Supplementary Data Set 8 and calculated to the relative enrichment compared with input. A ChIP-seq library was constructed by Novogene Corporation (Beijing, China).
Transcriptome sequencing
Transcriptome library was constructed by Beijing Genomics institute (Shenzhen, China). DNase I was used to digest double-stranded and single-stranded DNA in total RNA. Magnetic beads were used to purify and recover the reaction products. RNase H was used to remove the rRNA. Purified mRNA was fragmented into small pieces with fragment buffer. cDNA was synthesized using random hexamer primers and M‐MuLV Reverse Transcriptase (RNase H), and then ligated with adaptors. Then PCR was performed with Phusion High-Fidelity DNA polymerase. The libraries were sequenced on a BGISEQ500 platform (BGI-Shenzhen, China), and paired-end reads were generated.
The sequencing reads were filtered using trimmomatic and aligned to Arabidopsis genome (TAIR10) using HISAT (Hierarchical Indexing for Spliced Alignment of Transcripts) (39) and Bowtie2 (40) with default parameters. Gene expression was defined by RSEM (41) and estimated by FPKM. Differential expression analysis between two conditions/groups was performed using the DESeq R package (1.10.1) (42). The resulting P values were adjusted using the Benjamini and Hochberg's approach for controlling the false discovery rate (42). Genes with expression difference more than 1.5 times, P value < 0.01, and FDR < 0.01 were considered as differentially expressed genes. To analyze gene expression patterns during the stem development, their mRNA levels (FPKM) in stage I, II and III were used as the row data. Then, log2 was taken for the ratio on expression levels of genes between stages II or III and I. Then the calculated data were analyzed using Short Time-series Expression Miner (STEM) with default parameters.
ChIP-seq
ChIP-seq reads were aligned to the A. thaliana genome (TAIR 10) using BWA (Burrows Wheeler Aligner) (43) with default parameters and only uniquely mapped reads were kept. MACS2 (version 2.1.0) peak calling software was used to identify regions of enriched intervals over the background. A q-value threshold of 0.05 was used for all data sets. Different peak analysis was based on the fold enrichment of peaks in different experiments. When the odds ratio between two groups was more than 1.2-fold, this peak was determined as a different peak. To determine genes with co-regulation of transcription and H3K4me3 modification during the stem development, the row data of fold changes in their mRNA (FPKMFC) and H3K4me3 levels (FoldEnrichFC) were normalized by quantiles to make two distributions statistically comparable. Hierarchical clustering figure was generated by Python data visualization library seaborn (http://seaborn.pydata.org/index.html).
GO enrichment analysis
GO enrichment analysis was performed using agriGO (44) with Fisher's exact test. P values, R factors and gene numbers were visualized as Bubble Chart using the OmicShare tools (www.omicshare.com/tools).
In situ hybridization
The basal stem of 6-week-old wild-type plants were harvested and fixed with FAA and embedded in paraffin after dehydration with gradient ethanol. Cross-sections of 15 μm thickness using Ultra-Thin Semiautomatic Microtome (FINESSE 325, Thermo) were used for hybridization with both the antisense and sense probes for ATX1 transcript. A 369-bp cDNA fragment of ATX1 transcripts was amplified using primers listed in Supplementary Data Set 8, and then cloned into pGEM-T Easy vector (Promega). The probes were synthesized and labelled using a DIG RNA Labeling Kit (Roche) following the vendor's recommendations. Pretreatment of stem sections, hybridization and immunological detection were performed as described previously (45). Hybridization was carried out overnight at 50°C.
Western blot
To determine the Myc-ATX1 protein concentrations, 0.1 g of stem samples at different developmental stages for wild-type, atx1-2 and ATX1pro:Myc-ATX1 plants were analyzed by Western blot using a Myc-specific antibody (Sigma, M4439). The Tublin protein detected by anti-alpha-Tublin (Sigma, T5168) was used as an internal reference. ImageJ software was used to quantify the inimmunolabeled signals.
Statistical analysis
Data were analyzed by one-way ANOVA with Tukey's honestly significant difference test or Student's t-test.
Accession Numbers
The accession numbers of genes used in this study are as follows: ATX1 (AT2G31650), ATX2 (AT1G05830), ATX3 (AT3G61740), ATX4 (AT4G27910), ATX5 (AT5G53430), SDG2 (AT4G15180), SDG25 (AT5G42400), NST1 (At2g46770), SND1 (At1g32770), WRKY70 (AT3G56400), LTP (AT2G15050) and ACTIN7 (AT5G09810).
RESULTS
H3K4me3 methylation dynamically regulates secondary wall biosynthesis
In order to observe the secondary cell wall formation in inflorescence stem of Arabidopsis thaliana, we collected sequentially developing stem samples. Microscopic observations of stem sections from the apex to the base of the inflorescence stem showed that secondary cell wall in interfascicular fibers are fully developed in stage IV (Figure 1A). To unravel the transcriptional level of genes involved in secondary wall biosynthesis during inflorescence stem development, we selected the stem samples from stages I to III for transcriptome analysis. All differentially expressed genes by RNA-seq were clustered into eight categories according to their expression profiles at the different stages by using Short Time-series Expression Miner software (STEM) (Figure 1B, Supplementary Data Set 2). As shown in Figure 1B, 2475 genes were classified into category 7, which represents genes up-regulated in the early stages (II versus I) during the inflorescence stem development, whereas only 754 genes (category 5) were activated in the later stages (III versus II), and 963 genes (category 8) were continuously increased from stages I to III.

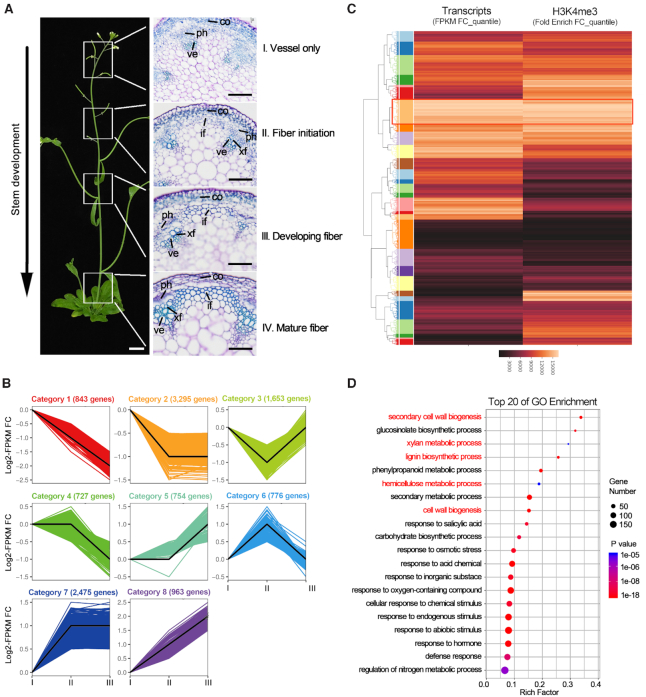
Global analysis of dynamic changes of H3K4me3 and mRNA levels during the inflorescence stem development of Arabidopsis. (A) The inflorescence stem of 6-week-old Arabidopsis thaliana were dived into four fragments from the apex to bottom, i.e. 0–3 cm (stage I, no interfascicular fibers), 5–7 cm (stage II, fiber initiation), 10–12 cm (stage III, developing interfascicular fibers), 18–20 cm (stage IV, mature interfascicular fibers with thickened cell walls). if: interfascicular fiber; co: cortex; xf: xylary fiber; ve: vessel; ph: phloem. The scale bar of the whole plant is 1 cm and the scale bars of the sections are 40 μm. (B) Heatmaps of gene expression profiles in the wild-type stem (stage I, II and III) was performed through STEM (83) on the OmicShare tools platform (http://www.omicshare.com/tools) based the RNA-seq data. These data from stage II to III were normalized by taking log2 in comparison to stage I. The minimum variation of gene expression between two developmental stages was 2-fold (P< 0.05). (C) Hierarchical clustering of RNA-seq and H3K4me3 ChIP-seq of the wild-type stem (stage II versus I). The column vectors were colored by the rankings of normalized fold change of genes. The row vectors which represent genes were divided into 30 clusters (1–30, from top to bottom) by centroid method. Clusters are highlighted by an additional row color column on the left of the heatmap. The red rectangle box represents cluster 7 that conducted to GO analysis. (D) Gene ontology (GO) enrichment analysis for genes of cluster 7. The x-axis showed the enrichment degree of each GO term. The color gradation indicates the P-value of each GO term. The top three enriched GO pathways were GO:0009834 (R factor = 0.34) for secondary cell wall biogenesis, GO:0045491 (R factor = 0.29) for xlyan metabolic process and GO:0009809 (R factor = 0.26) for lignin biosynthetic process.
We further determined the expression patterns of 74 genes associated with secondary wall formation (1,46,47) during the inflorescence stem development in the RNA-seq data. These genes are mainly enriched in category 7, followed by in category 8, and activated at the early stage of the stem development (Supplementary Figure S1, Supplementary Table S2). Among them, 57 members, including NST1, SND1, MYB46 and MYB83, are clustered into category 7 (Supplementary Figure S2). In contrast, some genes involved in cambium cell proliferation, including KANADI3 (KAN3), CLAVATA3/ESR-RELATED44 (CLE44) and REDUCED IN LATERAL GROWTH1 (RUL1) (48–50), are activated at the later stem development stage and clustered into category 5 (Supplementary Figure S2). These results suggest that these genes controlling secondary cell wall biosynthesis in interfascicular fibers are transcriptionally activated at the early stage of the stem development.
Increasing evidence has shown that transcriptional activation directed by H3K4 tri-methylation is very important for multiple developmental processes and environmental responses in plants (51,52). To reveal the possible regulatory role of H3K4me3 methylation in the inflorescence stem development of Arabidopsis, ChIP-seq was performed by using the stem fragments of stages I and II (Supplementary Data Set 3). Compared with the RNA-seq data obtained above, the Venn diagram revealed a high correlation between the up-regulated genes and the set of H3K4me3 hypermethylated genes at stage II versus I (Supplementary Figure S3, Supplementary Data Set 4). To identify genes with the same transcriptional patterns and H3K4me3 level changes during the stem development, we ranked them in an ascending order by their normalized fold changes in mRNA or H3K4me3, respectively. Next, we used the gene rankings in the hierarchical clustering to reveal the global co-regulation patterns of mRNA- and H3K4me3-fold changes. Out of 30 clusters, cluster 7 represents the genes with a most closely correlation between up-regulated transcription and hypermethylated at H3K4me3 (Figure 1C).
To further investigate the functions of these H3K4 hypermethylated genes, which are up-regulated from stages I to II, we performed a Gene Ontology (GO) enrichment analysis for cluster 7 genes and found that the top three enriched GO pathways were involved in secondary wall biogenesis, xlyan metabolic and lignin biosynthetic process (Figure 1D). In these GO pathways, we identified that both the transcription and H3K4me3 levels of two NAC master switch genes, NST1 and SND1, involved in fiber secondary wall thickening (7,8) and other transcriptional regulators, including SND2, MYB20, MYB63 and KNAT7 (1,6,53), were significantly increased in stage II versus I (Supplementary Figure S4A). By contrast, VND6 and 7, which are key regulators for vessel secondary wall formation (11,54,55), were not marked by H3K4me3 in either stage I or II (Supplementary Figure S4B). These results suggest that the dynamic increase of tri-methylation on H3K4 is involved in the specific activation of secondary wall biosynthetic genes during the fiber differentiation stage of the inflorescence stem.
Spatial and temporal expression pattern of ATX1 in interfascicular fibers
It has been reported that seven histone lysine methyltransferases, including ATX1, 2, 3, 4, 5, SDG2 and SDG25, are responsible for the establishment of methyl-H3K4 in Arabidopsis (56,57). To determine which member of these histone methyltransferases is involved in the regulation of secondary wall biosynthesis, spatial and temporal expression patterns of these H3K4 methyltransferase genes were analyzed during the inflorescence stem development. We firstly examined the dynamic expression levels of these genes from stage I to IV by RT-qPCR analysis. All histone lysine methyltransferase genes except for SDG2 were up-regulated in stage II, compared with that in stage I (Figure 2A and B, Supplementary Figure S5A). We next generated transgenic plants harboring all seven H3K4 methyltransferase gene promoters fused to the β-glucuronidase (GUS) reporter gene, respectively. GUS staining showed that ATX2, ATX3 and ATX4 were mainly expressed in the cortical and phloem cells at the developing inflorescence stem, while the expression of SDG2 and SDG25 was restricted in the cortical cells (Supplementary Figure S5B). By contrast, ATX1pro:GUS showed strong expression in the cortical cells at the apex of the stem (stage I), and specific expression in interfascicular fibers (from stage II to IV) rather than in vessel tissues (Figure 2C). To further investigate the expression profiles of ATX1, in situ mRNA hybridization also verified that, in the developing inflorescence stem, ATX1 mRNAs were specifically accumulated in interfascicular fiber cells (Figure 2D). These results indicate that the expression of ATX1 is developmentally associated with secondary wall biosynthesis in the interfascicular fibers.
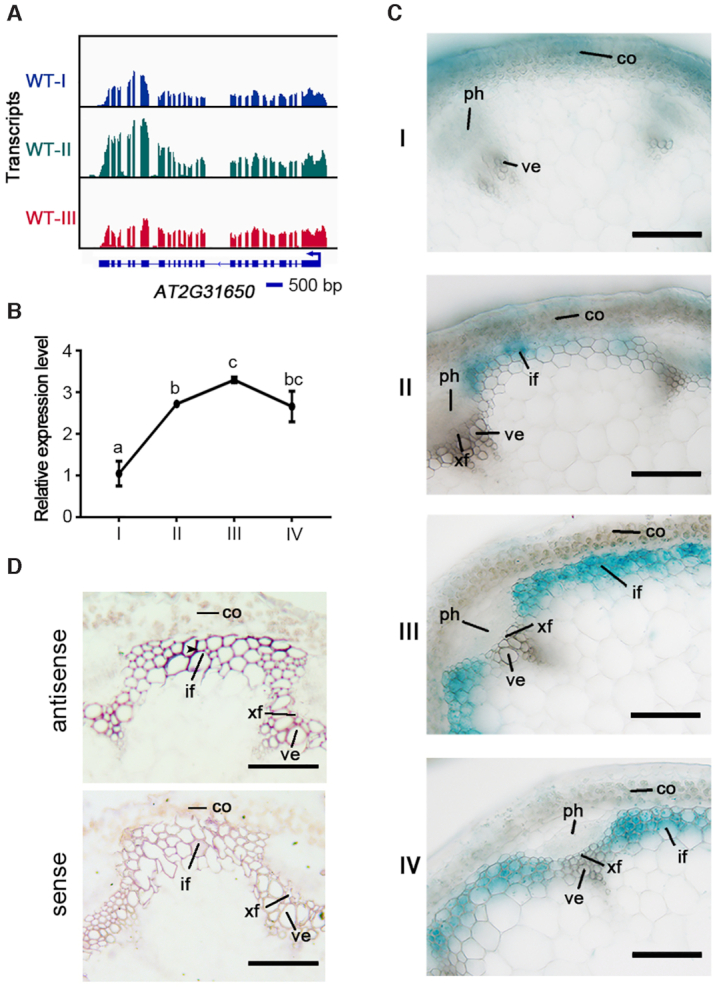
The spatial and temporal expression patterns of ATX1 in the developing stem of Arabidopsis. (A) Genome tracks of RNA-seq for ATX1 in the developing stem (from stage I to III) of wild-type plants. (B) RT-qPCR analysis of ATX1 expression in the inflorescence stem from stage I to IV. Relative expression was normalized to that of ACTIN7 (ACT7). Different letters indicate significant differences among different developmental stages of the stem based on one-way ANOVA (P < 0.05). (C) GUS staining of ATX1pro:GUS transgenic plants were used to analyze the spatial and temporal expression pattern of ATX1 in inflorescence stems from stage I to IV. Three independent lines of ATX1pro:GUS were analyzed by staining here and all of them showed consistent pattern of GUS signal. (D) In situ localization of ATX1 in inflorescence stems of wild-type plants. The stem of stage III was cross-sectioned for hybridization with antisense and sense probes of ATX1. Scale bars = 40 μm.
ATX1 positively regulates the secondary wall formation in interfascicular fibers
To determine the regulatory roles of these H3K4-specific methyltransferases in the secondary wall formation during Arabidopsis inflorescence stem development, the mutants of atx1, 2, 3, 4, 5, sdg2 and sdg25 were grown and their phenotypes were analyzed. Compared with the wild-type, two independent loss-of-function mutant alleles of ATX1 exhibited lodging phenotypes (Figure 3A). Cross sections of the basal stems revealed that the wall thickness of interfascicular fibers in the atx1-2 and atx1-4 mutants were reduced to 64.93% and 67.20% of that in the wild-type, respectively, whereas the cell wall thickness of the xylem fibers and vessels were not influenced by ATX1 mutation (Figure 3B and C). To further confirm the effect of ATX1 on secondary wall deposition of interfascicular fibers, the ATX1 genomic DNA driven by its native promoter (−2400 to +6931 bp) was introduced into the background of the atx1-2 mutant (COM-1) (Supplementary Figure S6). The lodging phenotype and thinner cell walls were rescued by complementation with the ATX1 gene (Figure 3A−C, Supplementary Figure S7). Overexpression of ATX1 under the control of the CaMV 35S promoter resulted in 59.75% and 30.59% increase in secondary wall thickness in interfascicular fibers and xylem fibers, compared with the wild-type control, respectively, but had no obvious effects on vessel cells (Figure 3B and C, Supplementary Figure S7). These results indicate a positive correlation between ATX1 expression and the cell wall thickness in interfascicular fibers within the inflorescence stem of transgenic plants. On the contrary, the mutants of atx2, 3, 4, 5, sdg2 and sdg25 did not display lodging stem or deficient in secondary wall deposition in interfascicular fibers (Supplementary Figure S8). These results indicate that ATX1 is required for the secondary cell wall formation in the interfascicular fiber, consistent with its restricted expression patterns in this tissue.
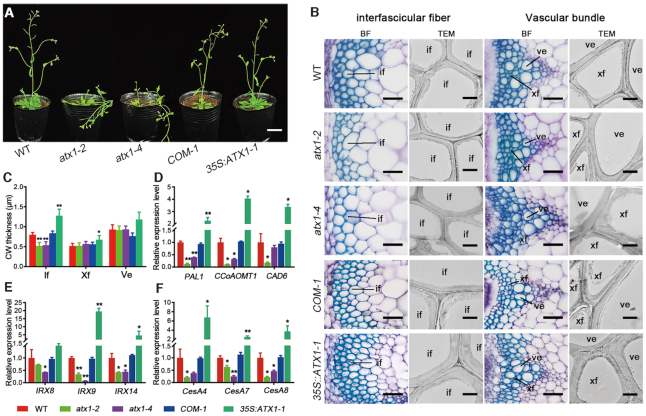
ATX1 promotes the secondary cell wall synthesis in interfascicular fiber cells. (A) Phenotypes of 6-week-old wild-type, atx1-2 and atx1-4 mutants, COM-1 (complementation) and 35S:ATX1 transgenic plants. (B) Cross sections of the basal stem of wild-type, atx1-2, atx1-4, COM-1 and 35S:ATX1-1 transgenic plants. The interfascicular regions (left) and vascular bundles (right) were observed under the bright field (BF) after stained with toluidine blue or transmission electron microscopy (TEM), respectively. (C) Statistics of secondary cell wall (CW) thickness of fibers and vessels in the inflorescence stem of wild-type, atx1-2, atx1-4, COM-1 and 35S:ATX1-1 transgenic plants. Error bars represent ± SD (n = 15). (D−F) Relative expression of lignin (D), cellulose (E) and xylan (F) biosynthetic genes in the stem of wild-type, atx1-2, atx1-4, COM-1 and 35S:ATX1-1 transgenic plants. Relative expression was normalized to that of ACT7 and set to 1 in the wild-type. Asterisks indicate a significant difference using the Student's t-test (*P < 0.05; **P < 0.01). co: cortex; if: interfascicular fiber; ph: phloem; ve: vessel; xf: xylem fiber. Scale bars = 3 cm in (A), 40 μm in photo taken under BF, 2 μm in photo taken under TEM.
Further phloroglucinol-HCl and Calcofluor White staining and xylan antibody immunolocalization revealed that the deposition of lignin, cellulose and xylan was reduced in the interfascicular fiber cell walls of the atx1-2 and atx1-4 mutants, but increased in 35S:ATX1 transgenic plants compared with the wild-type control (Supplementary Figure S9). Quantitative analysis of secondary wall components also showed that the contents of lignin, cellulose and hemicellulose in interfascicular fibers were decreased by 7.5%, 6.8% and 16.5% in atx1-2, respectively, compared with the wild-type, while increased by 31.4%, 3.5% and 6.6% in transgenic 35S:ATX1 plants, respectively (Supplementary Table S1). Furthermore, the expression of lignin biosynthetic genes (PAL1, CCoAOMT1 and (CAD6) (58), xylan biosynthetic genes (IRX8, IRX9 and IRX14) (59–62), and cellulose biosynthetic genes (CesA4, CesA7 and CesA8) (63–65), were down-regulated in atx1-2 and atx1-4 mutants, but up-regulated in 35S:ATX1 transgenic plants in comparison to the wild-type (Figure 3D−F). These results indicate that ATX1 could promote the secondary cell wall formation in interfascicular fibers by positively regulating the biosynthesis of the main secondary cell wall components.
ATX1 directly associates with the chromatin of NST1 and SND1 to modulate their H3K4me3 and transcript levels
In order to determine ATX1-targeted genes that are involved in the regulation of the secondary cell wall thickening in interfascicular fiber cells at the genome-wide scale, we performed a transcriptome analysis on the developing inflorescence stem (stage II) from 6-week-old wild-type and atx1-2 plants. A total of 3221 genes were down-regulated (|fold change| ≥ 1.5, P < 0.01, FDR<0.01) in atx1-2, compared with the wild-type (Figure 4A, Supplementary Data Set 5). To investigate whether these down-regulated genes in atx1-2 are directly associated targets of ATX1, we carried out an H3K4me3 chromatin immunoprecipitation followed by sequencing (ChIP-seq). In the atx1-2 mutant, H3K4me3 levels were reduced for 554 genes compared with wild-type plants (Figure 4A, Supplementary Data Set 6). The down-regulation and H3K4me3 hypomethylation were overlapped on 107 genes (Figure 4A, Supplementary Data Set 7), including the target genes of ATX1 reported previously, such as WRKY70 and LTP (66), suggesting that ATX1 is directly associated with these 107 genes and positively regulate H3K4me3 levels at these loci in wild-type plants. Among these ATX1-assoicated genes, 26 were also transcriptionally up-regulated and hypermethylated at the early stage (II versus I) of the inflorescence stem development in wild-type plants (Figure 4B, Supplementary Table S3). Interestingly, among these 26 genes, we found two genes encoding known NAC master switches for secondary wall biosynthesis, NST1 and SND1 (7,8) (Figure 4C, Supplementary Figure S10A). Meanwhile, 57 of ATX1-associated genes, including WRKY70, were not up-regulated during the stem development (Supplementary Figure S10C). In addition, some secondary wall regulators, such as SND2, MYB20, MYB63 and KNAT7 (6,53,67,68), were shown to be up-regulated and hyper-H3K4 tri-methylated during the stem development (stage II versus I) in the wild-type, but the elevations in transcription and methylation levels of these genes were not abolished in atx1-2 (Supplementary Figure S10B), suggesting that these genes were not directly regulated by ATX1.
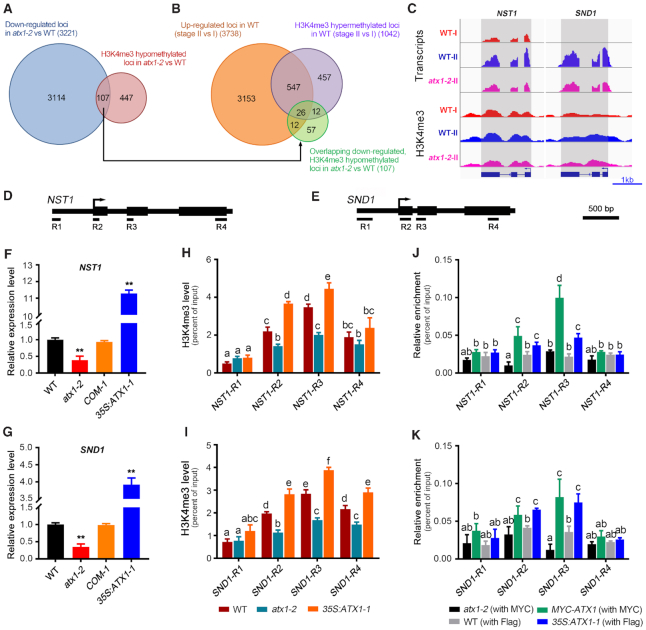
The transcription and H3k4me3 methylation levels of NST1 and SND1 are up-regulated by ATX1. (A) Venn diagram showing the overlap among genes that are down-regulated in atx1-2 by RNA-seq (|foldchange| > 1.5, P < 0.01) and H3K4me3 hypomethylated genes in atx1-2 compared with the wild-type by ChIP-seq (|foldchange| > 1.2, q-value < 0.05). (B) Venn diagram showing the overlaps among the overlapped genes in (A), the up-regulated genes in wild-type plants (stage II versus I, |foldchange| > 1.5, P < 0.01), and the H3K4me3 hypermethylated genes in wild-type plants (stage II versus I). (C) Genome tracks of RNA-seq and anti-H3K4me3 ChIP-seq data for the loci of NST1 and SND1 in the different stem developmental stages (I and II) of the wild-type and atx1 mutant. (D and E) Diagrams for their gene structures of NST1 and SND1, and the regions of NST1 (R1: −529 ∼ −426 bp; R2: +12 ∼ +95 bp; R3: +514 ∼ +671 bp; R4: +1792 ∼ +1920 bp) and SND1 (R1: -564 ∼ −343 bp; R2: +33 ∼ +156 bp; R3: +264 ∼ +400 bp; R4: +1324 ∼ +1459 bp) were used for ChIP-qPCR analysis, respectively. (F and G) RT-qPCR analysis of NST1 (F) and SND1 (G) expression levels in wild-type, atx1-2, COM-1 and 35S:ATX1-1. Relative expression was normalized to that of ACT7 and set to 1 in wild-type plants. (H and I) ChIP-qPCR analysis of H3K4me3 methylation status at the loci of NST1 (H) and SND1 (I) in wild-type, atx1-2 and 35S:ATX1-1 plants. (J and K) ChIP-qPCR analysis of the association of ATX1 with the loci of NST1 (J) and SND1 (K) using Myc-ATX1 (ATX1pro:Myc-ATX1/atx1-2) and 35S:ATX1-1 (35S:Flag-ATX1) hybridized with Myc or Flag antibody, respectively. Wild-type plants were used as a control. Different letters in H, I, J and K indicate significant differences among genotypes and regions of chromatin based on one-way ANOVA (P < 0.05). Asterisks indicate a significant difference with respect to wild-type for mutant or transgenic plants using Student's t-test (*P < 0.05; **P < 0.01).
Gene expression analysis revealed that the transcript levels of NST1 and SND1 were remarkably down-regulated in the developing stem of atx1-2 and restored to near wild-type levels in the genetic complementation line (Figure 4F and G). Whereas the expression of NST1 and SND1 were increased by 11- and 4-fold in transgenic 35S:ATX1-1 plants, respectively (Figure 4F and G). Several pairs of primers covering approximately 200 base-pair (bp) regions of the NST1 and SND1 loci were designed for ChIP-qPCR (Figure 4D and E). We found that H3K4me3 levels at the R2 region nearby the transcription start site and the R3 region in the second exon of NST1 were distinctly decreased in atx1-2, but increased in transgenic 35S:ATX1-1 plants, compared with the wild-type, while these at the promoter region (R1) and 3′ end (R4) of the gene body were not changed (Figure 4H). Similar results were obtained in the locus of SND1 (Figure 4I). To further verify the direct binding of ATX1 to the loci of NST1 and SND1, we generated transgenic plants harboring ATX1pro:Myc-ATX1 under the background of atx1-2 or 35S:Flag-ATX1 under the background of the wild-type Columbia (Col), respectively. ChIP-qPCR analysis revealed the specific association of the Myc- and Flag-ATX1 proteins with the NST1 and SND1 loci at the R2 and R3 regions (Figure 4J and K). These data indicate that ATX1 could directly bind at the loci of NST1 and SND1, thus promoting their transcription through the regulation of H3K4me3 levels on their chromatin.
ATX1 activates the expression of NST1 and SND1 by positively regulates their H3K4me3 levels during the stem development
Although NST1 and SND1 serves as master regulators for secondary wall thickening in fibers (10), how their expression is regulated during Arabidopsis inflorescence stem development remains largely unknown. To elucidate the role of ATX1 in regulating chromatin modifications of NST1 and SND1 during the stem development, we investigated the transcript accumulation and H3K4me3 levels of NST1 and SND1 during various developmental stages. Consistent with the expression pattern of ATX1 obtained above (Figure 2A), expression levels of NST1 and SND1, were barely detectable at stage I, and significantly increased in wild-type plants from stage I to III, but not distinctly changed in atx1-2 (Figure 5A and B). The expression levels of NST1 and SND1 in the late developmental stem (stage III) of atx1-2 were only approximately 0.21- and 0.31-fold of these in wild-type plants, respectively (Figure 5A and B). As a control, WRKY70, which acts as an activator of salicylic acid (SA)-induced genes and has been identified to be directly bound by ATX1 (66), were not up-regulated during the stem development in either the wild-type or atx1-2 mutant (Figure 5C). Next, we monitored the H3K4me3 levels of the R3 regions in the NST1 and SND1 loci at three developmental stages. In the apex (stage I) of the inflorescence stem of 6-week-old wild-type and atx1-2 plants, basal levels of H3K4me3 were detected at these loci (Figure 5A and B), indicating that ATX1 does not influence H3K4me3 modification of NST1 and SND1 at this stage. Compared with these at stage I, H3K4me3 level in the R3 regions of the NST1 and SND1 loci was significantly increased at stages II and III during the inflorescence stem development in wild-type plants, but not altered in atx1-2 (Figure 5A and B). Our results show that the increase in H3K4me3 and transcript levels of NST1 and SND1 during the inflorescence stem development largely depends on the presence of ATX1.
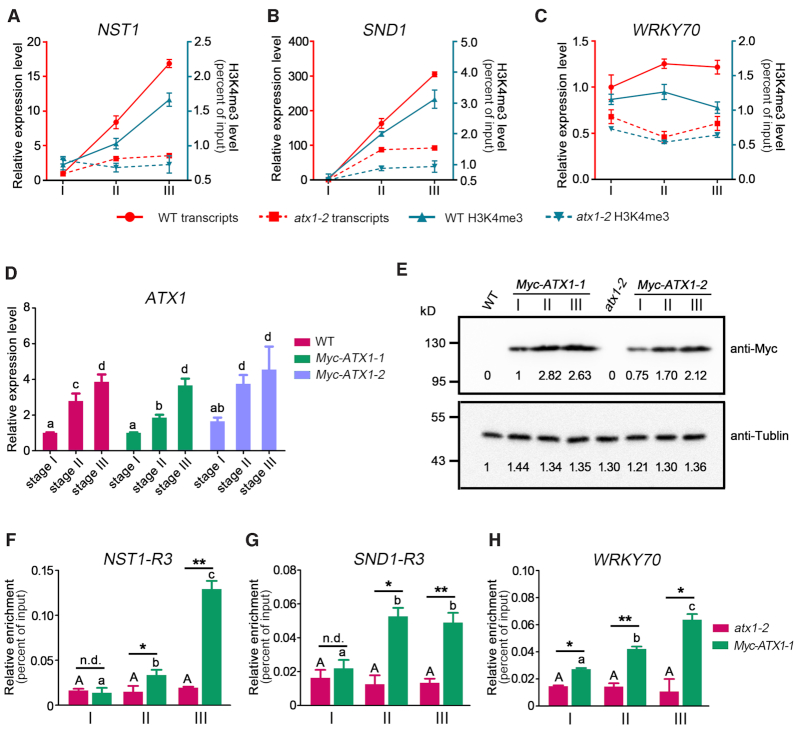
ATX1 dynamically regulates NST1 and SND1 expression during the stem development. (A-C) Expression and H3K4me3 levels of NST1 (A), SND1 (B), and WRKY70 (C) in wild-type and atx1-2 at the developmental stem (from stage I to III). The red lines and left Y-axis represent transcription levels. The blue lines and right Y-axis represent H3K4me3 modification. Relative expression was normalized to ACT7 and set to 1 in stage I of wild-type plants. (D) RT-qPCR analysis of transcription levels of ATX1 in wild-type and two of the ATX1pro:Myc-ATX1/atx1-2 transgenic lines at the developmental stem (stage I to III). Relative expression was normalized to ACT7 and set to 1 in wild-type plants. The different letters indicate significant differences among different genotypes based on one-way ANOVA (P < 0.05). (E) Myc-ATX1 protein levels in two of the ATX1pro:Myc-ATX1/atx1-2 transgenic lines (Myc-ATX1-1/2) at the indicated developmental stages of stems. Total protein extracts isolated from wild-type or atx1-2 plants were used as negative controls. Anti- alpha -tublin (Sigma, T5168) was used as a loading control. Anti-Myc antibody (Sigma, M4439) was used to detect Myc-ATX1. (F−H) ChIP-qPCR analysis using anti-Myc antibody to detect the direct association of ATX1 on the loci of NST1 (F), SND1 (G) and WRKY70 (H) at the indicated developmental stages of stems. The primers of the R3 regions of NST1 and SND1, and primer pair flanking the site of translation start site of WRKY70, were used for ChIP-qPCR analysis. Asterisks indicate a significant difference with respect to wild-type plants for each mutant or transgenic plants using Student's t-test (*P < 0.05; **P < 0.01; n.d., no significant different).
In order to further elucidate how ATX1 dynamically regulates their chromatin modifications during interfascicular fiber development, we determined the transcript level, protein abundance and chromatin association of ATX1 with NST1 and SND1 at different developmental stages of the inflorescence stem. ATX1 transcript levels were low in the stage-I stem of ATX1pro:Myc-ATX1 transgenic plants, in which the fused Myc-ATX1 gene driven by the ATX1 native promoter was introduced into the atx1-2 background, but substantially increased at stages II and III (Figure 5D), consistent with the developmental increase of endogenous ATX1 transcripts in the wild-type stem (Figure 2A). We also examined ATX1 protein levels in ATX1pro:Myc-ATX1 transgenic plants using anti-Myc antibody. Immunoblot analysis showed that Myc-ATX1 protein levels were markedly higher in the stage-II and -III stem fragments compared with the stage-I one (Figure 5E). With the increase of ATX1 protein level, the Myc-ATX1 protein levels associated with the NST1 and SND1 loci were also significantly higher at stages II and III than at stage I (Figure 5F and G). In contrast to NST1 and SND1, WRKY70 was not dynamically regulated by ATX1 during the stem developmental process (Figure 5C and H). These results indicate that ATX1 plays an important role in the establishment of H3K4me3 marks and transcriptional reprogramming of NST1 and SND1 for secondary wall biosynthesis of interfascicular fibers during the stem development through the dynamic association and methylation of their chromatins.
ATX1 promotes secondary cell wall biosynthesis in interfascicular fibers through activating the expression of NST1 and SND1
To investigate whether ATX1 regulates secondary cell wall biosynthesis of interfascicular fibers through NST1 and SND1, we introduced the ATX1 gene under the control of the CaMV 35S promoter into the snd1 nst1 double mutant. As shown in Figure 6A−D, overexpression of ATX1 failed to restore the lodging phenotype and the defect in secondary wall thickening in fibers of snd1 nst1. The transcript levels of ATX1 were significantly increased in transgenic plants carrying 35S:ATX1 under the background of the wild-type or atx1-2, compared with the corresponding nontransformed controls (Figure 6E, Supplementary Figure S11). Knockout of NST1 and SND1 also blocked the up-regulation of marker genes for secondary wall biosynthesis triggered by 35S:ATX1 (Supplementary Figure S13A−C).
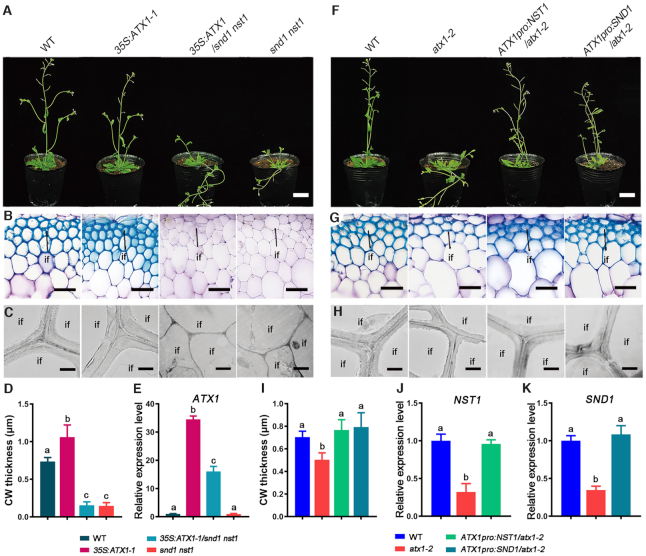
ATX1 regulates secondary wall biosynthesis in interfascicular fiber cells through promoting the expression of NST1 and SND1. (A) Phenotypes of wild-type, 35S:ATX1, 35S:ATX1/snd1 nst1, snd1 nst1. (B) Cross sections of interfascicular regions of wild-type, 35S:ATX1-1, 35S:ATX1/snd nst1 and snd1 nst1. (C) Transmission electron micrographs of interfascicular fiber cells of wild-type, 35S:ATX1-1, 35S:ATX1/snd1 nst1 and snd1 nst1. (D) Statistical analysis on secondary cell wall thickness of interfascicular fiber cells of wild-type, 35S:ATX1-1, 35S:ATX1/snd1 nst1 and snd1 nst1. (E) Expression levels of ATX1 in wild-type, 35S:ATX1-1, 35S:ATX1/snd1 nst1 and snd1 nst1. (F) Phenotypes of wild-type, atx1-2, ATX1pro:NST1/atx1-2 and ATX1pro:SND1/atx1-2. (G) Cross sections of interfascicular regions of wild-type, atx1-2, ATX1pro:NST1/atx1-2 and ATX1pro:SND1/atx1-2. (H) Transmission electron micrographs of interfascicular fiber cells of wild-type, atx1-2, ATX1pro:NST1/atx1-2 and ATX1pro:SND1/atx1-2. (I) Statistical analysis on secondary cell wall thickness of wild-type, atx1-2, ATX1pro:NST1/atx1-2 and ATX1pro:SND1/atx1-2. (J and K) Expression levels of NST1 (J) and SND1 (K) in wild-type, atx1-2, ATX1pro:NST1/atx1-2 and ATX1pro:SND1/atx1-2, respectively. Relative expression was normalized to ACT7 and set to 1 in wild-type plants. Different letters in D, E, I, J and K indicate significantly differences among different genotypes based on one-way ANOVA (P < 0.05).
To further determine whether NST1 and SND1 were downstream of ATX1 in controlling secondary wall biosynthesis of the fibers, we transformed the NST1 and SND1 genes driven by the ATX1 promoter into the atx1-2 mutant, respectively (Supplementary Figure S12). We found that the introduction of the ATX1pro:NST1 or ATX1pro:SND1 gene could restore the lodging phenotype and the defect in secondary wall thickening in interfascicular fibers caused by ATX1 mutation (Figure 6F-I, Supplementary Figure S12). In addition, the down-regulation of secondary cell wall biosynthetic genes in atx1-2 was also restored by the ectopic expression of NST1 or SND1 (Figure 6J and K, Supplementary Figure S13D−F). These results demonstrate that NST1 and SND1 were located in the downstream of ATX1 in the regulatory network controlling secondary cell wall biosynthesis in interfascicular fibers.
DISCUSSION
As an extensively reported epigenetic mark for transcriptional initiation, H3K4 tri-methylation levels are found to change dynamically during plant growth and development (69). However, the dynamic changes in H3K4me3 levels during stem development remains elusive. In this study, we examined the changes in transcription and H3K4 tri-methylation profiles along the axis of inflorescence stems. We identified a group of genes associated with secondary wall biosynthesis and their H3K4me3 methylation and transcription levels were significantly increased in the early stage of Arabidopsis inflorescence stem development (Figure 1). Loss-of-function mutation of ATX1, which specifically methylates H3K4me3 in Arabidopsis, resulted in a marked reduction of secondary wall thickening in interfascicular fibers (Figure 3). RNA-seq and ChIP-seq analysis showed that the master switch genes for secondary cell wall biosynthesis in interfascicular fibers, NST1 and SND1, are regulated by ATX1 during stem development through modulating their H3K4me3 levels (Figure 4, Supplementary Figure S10). Further biochemical analyses demonstrated that ATX1 directly binds to the chromatin regions of SND1 and NST1, and up-regulates their transcription and H3K4me3 levels to improve secondary wall biosynthesis (Figure 5). This finding is supported by the genetic evidences that the effects of ATX1 on fiber secondary cell wall are totally blocked by snd1 nst1 double mutation, as well as the deficiency phenotype in secondary wall synthesis of the atx1 mutant could be bypassed by ectopically expressing either NST1 or SND1 (Figure 6). Taken together, these results indicate that ATX1-drived H3K4me3 methylation of NST1 and SND1 is involved in the dynamic regulation of the secondary wall synthesis during Arabidopsis stem development. Our findings extend the knowledge about epigenetic regulation of reprogramming of chromatin modification states associated with cell differentiation in plant organ development (69–71).
Global transcriptional profiling using microarrays to identify genes involved in fiber and xylem vessel differentiation has previously been reported in vascular plants. Hertzberg et al. (2001) profiled changes in gene expression in different stages of secondary xylem differentiation in poplar (72). Oh et al. (2003) and Ko et al. (2004) determined genes that are preferably expressed during the transition from primary to secondary growth of Arabidopsis stems (73,74). Ehlting et al. (2005) and Brown et al. characterized global changes in gene expression along the mature gradient of Arabidopsis stem by microarrays (75,76). In our study, the secondary generation sequencing, a real full-genome-wide approach, was used to characterize changes of both global transcription and H3K4 tri-methylation along the developmental gradient of Arabidopsis inflorescence stems (Figure 1). Although Ehlting et al. have determined a series of stem segments corresponding to the different developmental stages (76), in their experiments, the Arabidopsis ecotype Landsberg erecta was used, with shorter in primary stem and less branches compared with the Columbia ectype plants we used in this study. To dissect fiber differentiation and secondary wall biosynthesis in the stem of Arabidopsis Columbia ectype, we took a serial section of 20 cm primary stem from the apex to base with 1 cm erial interval, and observed secondary wall deposition after histological staining (Figure 1). RNA sequencing of these sequential developing stem samples revealed that ATX1 expression is elevated during the transition from primary to secondary cell wall synthesis in interfascicular fibers (Figure 2).
Although ATX1, as a H3K4 tri-methyltransferase, plays important roles in root, leaf and flower organ development and stress responses (28,29,31–33,66,77), its role in stem development has not been reported. In this study, we found that loss-of-function mutation of the ATX1 gene led to a drastic reduction in both secondary wall thickness and components of the interfascicular fibers, but did not affect vessel development (Figure 3, Supplemental Table S1). The genetic complementation assay demonstrated that ATX1 driven by its own promoter could rescue the phenotype of the atx1 mutant (Figure 3), whereas constitutive expression of ATX1 resulted in ectopic deposition of secondary wall components in both interfascicular and xylem fibers (Figure 3, Supplementary Figure S9). ATX1 is predominantly expressed in the interfascicular fibers, but not in the xylem fibers (Figure 2), suggesting that it specially regulates the secondary wall synthesis of the interfascicular fibers. In eukaryotic cells, H3K4 methylation is established by a conserved histone methyltransferases subgroup (known as TrxG family) (26). There are seven members, including ATX1, 2, 3, 4, 5, SDG2 and SDG25, in Arabidopsis (26,27). Among them, ATX3, ATX4 and ATX5 are homologous of ATX1 with the same enzyme activity of H3K4me3, and play a redundant role to ATX1 in regulating vegetative and reproductive growth of Arabidopsis (78). In our study, promoter-GUS assay revealed that ATX3 have an alternative expression pattern in xylem fibers (Supplementary Figure S5), implying that ATX3 may be a substitute histone methyltransferase in xylem fibers for promoting secondary cell wall synthesis.
Although the transcriptional regulator networks of secondary wall biosynthesis have been well characterized (6–8), little is known about the molecular mechanisms controlling the expression of the NAC master regulators during vascular development. In the present study, NST1 and SND1 were identified to be directly targeted by ATX1, which could regulate their H3K4me3 and expression levels (Figure 4D−K). Furthermore, the gradual increase of both H3K4 tri-methylation and transcription levels of NST1 and SND1 were largely depend on the presence of ATX1 during the stem development (Figure 5A−D), indicating that ATX1 is required for activation of NST1 and SND1 transcription. However, it is still unknown how ATX1 is able to recognize and bind specifically to the chromatin of NST1 and SND1 during the stem development. Extensive studies have shown that histone modifiers could associate with their target loci through either a direct interaction with DNA or histone, or the recruitment by other partner proteins (52). For example, JMJ14 interacts with two NAC domain-containing transcription factors, NAC050 and NAC052, through its FYRN (F/Y-rich N terminus) and FYRC (F/Y-rich C terminus) domains, and thus be recruited by them to their target genes (79,80). ATX1 also contains FRYN and FYRC domains, but its DNA binding domain has not been identified yet (57), suggesting that ATX1 may be specifically recruited to NST1 and SND1 chromatins through physical interaction with other partner factors. Therefore, the identification of cofactors interacting with ATX1 will be helpful to comprehensively understand the mechanism of targeting specificity of histone methyltransferases in plants.
Previous studies have shown that NST1 and SND1 function redundantly as the master regulators in the first layer of the secondary cell wall synthesis regulatory network in xylem fibers during stem development (7,8). SND1 directly binds to the promoter of MYB46, which is the secondary level master switch downstream of the NAC master regulators (81), and activates its expression in Arabidopsis (7,82). Our results showed that ATX1 could regulate H3K4me3 levels of NST1 and SND1 during inflorescence stem development (Figure 4H and I). We further uncovered the genetic relationship between ATX1 and NST1/SND1 in the regulation of secondary wall thickening in interfascicular fibers through genetic and molecular analysis. Loss-of-function of NST1 and SND1 inhibited the ATX1-driven secondary wall synthesis in interfascicular fibers (Figure 6A−D), suggesting that ATX1 promotes secondary wall formation of the fiber cells, at least partially depending on NST1 and SND1. (Figure 6F−I). Therefore, we speculate that ATX1 epigenetically modulates the secondary wall biosynthesis in interfascicular fibers by regulating the H3K4me3 levels of NST1 and SND1, consistent with their predominant roles in secondary cell wall formation (7,8).
Collectively, like its animal counterpart, Arabidopsis ATX1 plays multiple roles in different development processes (31,77). In this study, our results reveal a novel role of ATX1 in the regulation of the secondary wall biosynthesis in interfascicular fibers by dynamically methylating H3K4 at the loci of NST1 and SND1 and activating their transcription during Arabidopsis inflorescence stem development. Our findings provide evidence for the epigenetic regulation of secondary wall biosynthesis, and thus contribute to a comprehensive understanding of how the secondary wall thickening in interfascicular fibers is regulated during vascular tissue development.
DATA AVAILABILITY
All data are available from the corresponding author upon request. The primers used in the study to confirm the observed novel isoforms can be found in Supplementary Data set 8. The fastq sequences for all libraries have been deposited in the GenBank database under the accession codes GSE153705.
ACKNOWLEDGEMENTS
We thank Yan He (China Agricultural University) and Zhengyi Xu (Northeast Normal University) for atx5-2 mutant seeds used in this study. We also appreciated Dr. Hongchun Yang (Wuhan University), Xinhua He (Southwest University) and Vincent L. Chiang (Northeast Forest University) for their critical view of this manuscript.
Authors’ contributions: K.L. and D.F. designed the research. X.W., D.F., D.W., L.K., Q.Z. and X.Y., performed the research. X.W. D.F. and W.X. analyzed data. X.W., D.F. and K.L. wrote this paper.
SUPPLEMENTARY DATA
Supplementary Data are available at NAR Online.
FUNDING
National Natural Science Foundation of China [31870657, 31670669, 31300990]; Graduate Research and Innovation Projects of Chongqing [CYB17075]; Fundamental Research Funds for the Central Universities [XDJK2020B036]. Funding for open access charge: National Natural Science Foundation of China [31670669].
Conflict of interest statement. None declared.
REFERENCES
1.
2.
3.
4.
6.
7.
8.
9.
10.
11.
12.
13.
14.
15.
16.
17.
18.
19.
20.
21.
23.
24.
25.
26.
27.
28.
29.
30.
31.
32.
33.
34.
35.
36.
37.
38.
39.
40.
41.
42.
43.
44.
45.
46.
47.
48.
49.
50.
51.
52.
53.
54.
55.
56.
57.
58.
59.
60.
61.
62.
63.
64.
65.
66.
67.
68.
69.
70.
71.
72.
73.
74.
75.
76.
77.
78.
79.
80.
81.
82.