 Systematic evaluation of the effects of genetic variants on PIWI-interacting RNA expression across 33 cancer types
Nucleic Acids Research


The authors wish it to be known that, in their opinion, the first three authors should be regarded as Joint First Authors.

- Altmetric
PIWI-interacting RNAs (piRNAs) are an emerging class of non-coding RNAs involved in tumorigenesis. Expression quantitative trait locus (eQTL) analysis has been demonstrated to help reveal the genetic mechanism of single nucleotide polymorphisms (SNPs) in cancer etiology. However, there are no databases that have been constructed to provide an eQTL analysis between SNPs and piRNA expression. In this study, we collected genotyping and piRNA expression data for 10 997 samples across 33 cancer types from The Cancer Genome Atlas (TCGA). Using linear regression cis-eQTL analysis with adjustment of appropriate covariates, we identified millions of SNP-piRNA pairs in tumor (76 924 831) and normal (24 431 061) tissues. Further, we performed differential expression and survival analyses, and linked the eQTLs to genome-wide association study (GWAS) data to comprehensively decipher the functional roles of identified cis-piRNA eQTLs. Finally, we developed a user-friendly database, piRNA-eQTL (http://njmu-edu.cn:3838/piRNA-eQTL/), to help users query, browse and download corresponding eQTL results. In summary, piRNA-eQTL could serve as an important resource to assist the research community in understanding the roles of genetic variants and piRNAs in the development of cancers.
INTRODUCTION
PIWI-interacting RNAs (piRNAs), a class of small non-coding RNAs with 24–31 nucleotides, are mainly expressed in the mammalian germline and have vital functions, including repressing the activity of transposable elements by binding to PIWI proteins (1–3). In addition, several studies found that piRNAs also occur and function in human somatic tissues (4), and investigated aberrant piRNA expression in some cancer types, indicating the potential roles of piRNAs in the development of human cancers (5–8).
It is known that single nucleotide polymorphisms (SNPs), the most common type of germline variants, play vital roles in human diseases, including cancers (9). In the past decade, genome-wide association studies (GWASs) have identified multiple SNPs associated with human cancers (9,10). Previous studies have found that these cancer risk-associated SNPs may be involved in the development of cancers by influencing the expression levels of nearby genes (10). Therefore, expression quantitative trait locus (eQTL) analysis, a method for linking SNPs to gene expression, has been demonstrated to be a powerful approach to understanding the effects and molecular mechanism of functional SNPs (11). Currently, multiple eQTL databases have been constructed for evaluating the effects of SNPs on gene expression (e.g. Genotype-Tissue Expression project [GTEx] and PancanQTL), DNA methylation (e.g. Pancan-meQTL), alternative splicing (e.g. CancerSplicingQTL) and other quantitative phenotypes (12–15). However, there is no database that provides an eQTL analysis between SNPs and piRNA expression. Therefore, it is necessary to construct a piRNA-eQTL database to further understand the functional roles of SNP-piRNA pairs in the biological processes of tumorigenesis.
Previous studies have found that somatic mutations also played an important role in the development of cancer (16). In addition to mutations in protein-coding regions, these studies described the landscape of non-coding mutations in cancer, particularly in promoter and enhancer regions, and their role in regulating gene expression and protein functions (16,17). Therefore, it is noteworthy that somatic mutations would also affect gene expression extending in piRNAs (18). However, in this study, we primarily aimed to investigate the effects of germline variants on piRNA expression using The Cancer Genome Atlas (TCGA) program, and developed a user-friendly database for cis-piRNA eQTL analysis across 33 cancer types.
MATERIALS AND METHODS
Genotype data collection, imputation and processing
We obtained access to the raw genotype data from TCGA database (https://tcga-data.nci.nih.gov/tcga/), which included 906 600 SNPs using the Affymetrix SNP 6.0 array. We subsequently imputed the non-genotyped SNPs from normal blood or normal tissue samples based on the 1000 Genomes Project (Phase I, version 3, 1092 individuals) using IMPUTE2 (19). GTOOL was used to convert imputed data into the PLINK format with a threshold of 0.9. A series of filtering criteria for SNPs (including non-imputed and imputed genotypes) on autosomal chromosomes were then carried out as follows: (i) minor allele frequency (MAF) < 0.05; (ii) call rate < 95%; (iii) Hardy–Weinberg Equilibrium (HWE) P-value < 1 × 10⁻⁶ and (iv) imputation confidence score (info score) < 0.3 (Supplementary Materials; Figure 1).

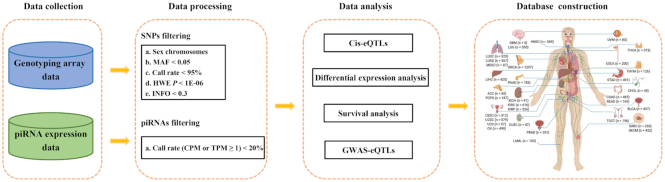
Summary of the study design.
piRNA expression data collection and processing
Raw small RNA sequencing data were also obtained from TCGA database, and we recreated the raw FASTQ files based on the BAM file using bedtools2 (20). Subsequently, the FASTQ files were trimmed based on the criterion of ‘Phred quality score ≥ 20’ and ‘reads length ≥ 21 nucleotides’ to obtain high quality reads corresponding to piRNAs via FASTX-Toolkit (http://hannonlab.cshl.edu/fastx_toolkit/) (6). All reads were then realigned to the reference genome (hg38) using STAR with custom piRNA reference transcriptome data from the piRBase database (version 2.0, http://www.regulatoryrna.org/database/piRNA/) (21), and the counts of each piRNA were summarized using featureCounts (22). In the piRBase database, all piRNA sequences were mapped to its latest genome using Bowtie software with parameter ‘-v 1 -a –best –strata’ in order to obtain the potential origin of every piRNA. piRNAs were referred to as gene- or repeat-related according to the overlapping of piRNA genome loci with RefSeq genes or repeat elements. Considering that several piRNAs may have different locations, we used counts per million mapped reads (CPM) and transcripts per million reads (TPM) to measure the total level (total number: 8 123 075) and transcript level (total number: 12 207 141) of each piRNA, respectively. Only the piRNAs with a CPM or TPM ≥ 1 and that were expressed in ≥ 20% of samples were retained and transformed using log2(x + 1) for further analyses.
Identification of cis-piRNA eQTLs
For each cancer type, we merged the genotype and piRNA expression data (transcript level) to perform eQTL analysis in tumor and normal tissues with more than 15 samples. The piRNA location (hg38) was transformed to match the location (hg19) of genotype data by LiftOver (https://genome.sph.umich.edu/wiki/LiftOver).
We performed the cis-piRNA eQTL analysis using R package Matrix eQTL in a linear regression model with the adjustment of sex, age, principal components (PCs, Supplementary Materials) and probabilistic estimation of expression residuals (PEER) factors (23). The top 5 PCs (extracted from genotype data using EIGENSOFT), and PEER factors (30 and 5 factors calculated using PEER from tumor and normal expression data, respectively) served as covariates in the model (24,25). Cis-eQTLs were defined if the SNP was within 1 Mb from the location of the piRNA. To retain more potential SNPs associated with piRNA expression, SNPs with P-value < 0.05 were defined as eSNPs (also known as eQTLs), and the corresponding piRNAs were defined as epiRNAs. Additionally, to control the type I error, we also used the false discovery rate (FDR) for multiple testing with the p.adjust function in R software.
Differential expression and survival analyses
Student's t-tests for independent (i.e. unpaired) and paired samples were performed to compare the expression of piRNAs (total level) between tumor and tumor-adjacent normal tissues. Furthermore, we carried out survival analysis to evaluate the associations of piRNAs (total level) and eSNPs with the overall survival probability in tumor samples. A log-rank test and Kaplan–Meier (KM) curve were used to examine the prognostic differences among different subgroups stratified by piRNA expression (high versus low level with different thresholds) or genotype (homozygous genotype AA versus heterozygous genotype AB and homozygous genotype BB).
Identification of GWAS-associated eSNPs
We included all GWAS-identified SNPs from the GWAS catalog (http://www.ebi.ac.uk/gwas/, August 2019) (26), and extended the GWAS-associated linkage disequilibrium (LD) SNPs based on the 1000 Genomes Utah Residents with Northern and Western European Ancestry (CEU) population using PLINK 1.90 (ld-window-kb 500 –ld-window-r2 0.5). GWAS-associated eSNPs were defined as the eSNPs overlapping with GWAS-identified SNPs and LD SNPs.
Pan-cancer analysis
We also designed a ‘Pan-cancer analysis’ page, where users can submit a batch of SNPs and/or piRNAs to (i) investigate the piRNA expression levels across 33 cancer types; (ii) display all significant SNP-piRNA pairs across 33 cancer types; (iii) identify other quantitative phenotypes associated with the eSNPs by combination of the PancanQTL, Pancan-meQTL and ncRNA-eQTL databases (13,14,27); and (iv) find published cancer-associated piRNAs by referring to the ‘cancer related data’ module of the piRBase database (21).
RESULTS
Summary of piRNA expression and genotype data
We collected 10 997 samples with small RNA sequencing data from 33 cancer types, and the sample size ranged from 5 in glioblastoma multiforme (GBM) to 1207 in breast invasive carcinoma (BRCA; Supplementary Table S1).
For the total level of piRNAs, there was an average of 19 430 piRNAs for each cancer type, ranging from 10 031 for kidney chromophobe (KICH) to 40 642 for acute myeloid leukemia (LAML; Table 1). Among these piRNAs, we identified an average of 11 608 (P for independent samples < 0.05) or 10 074 (P for paired samples < 0.05) differentially expressed (DE) piRNAs. In addition, an average of 2987 survival-associated piRNAs (P-value for log-rank test < 0.05) were identified, most of which were also differentially expressed in the majority of cancers.

| Cancer type | No. of samples | No. of piRNAsa | No. of DE piRNAsb | No. of survival-piRNAsc | ||
|---|---|---|---|---|---|---|
| Tumor | Normal | Independent | Paired | |||
| ACC | 80 | 0 | 20 185 | - | - | 5933 |
| BLCA | 409 | 19 | 14 898 | 9928 | 9253 | 1079 |
| BRCA | 1078 | 104 | 20 102 | 17 843 | 15 258 | 1874 |
| CESC | 307 | 3 | 15 180 | 6592 | 1137 | 2146 |
| CHOL | 36 | 9 | 15 782 | 13 235 | 11 540 | 496 |
| COAD | 444 | 8 | 19 928 | 14 434 | 10 177 | 2620 |
| DLBC | 47 | 0 | 21 343 | - | - | 261 |
| ESCA | 184 | 13 | 17 933 | 11 374 | 10 976 | 1317 |
| GBM | 0 | 5 | 21 070 | - | - | - |
| HNSC | 523 | 44 | 21 159 | 15 402 | 13 603 | 1087 |
| KICH | 66 | 25 | 10 031 | 8165 | 7530 | 550 |
| KIRC | 516 | 71 | 18 912 | 18 376 | 16 475 | 6156 |
| KIRP | 291 | 34 | 13 995 | 9559 | 11 709 | 1589 |
| LAML* | 103 | 0 | 40 642 | - | - | 7460 |
| LGG | 512 | 0 | 25 828 | - | - | 16 439 |
| LIHC | 372 | 50 | 19 568 | 15 999 | 15 358 | 6150 |
| LUAD | 513 | 46 | 15 354 | 12 475 | 9270 | 5228 |
| LUSC | 478 | 45 | 20 202 | 18 981 | 14 598 | 531 |
| MESO | 87 | 0 | 14 294 | - | - | 5351 |
| OV | 489 | 0 | 27 004 | - | - | 2044 |
| PAAD | 178 | 4 | 10 840 | 1621 | 1660 | 3563 |
| PCPG | 179 | 3 | 15 033 | 9111 | 6061 | 2134 |
| PRAD | 494 | 52 | 14 316 | 13 695 | 13 513 | 90 |
| READ | 161 | 3 | 21 379 | 14 772 | 7247 | 505 |
| SARC | 259 | 0 | 14 311 | - | - | 3401 |
| SKCM | 98 | 2 | 26 428 | 1068 | - | 2010 |
| STAD | 436 | 41 | 16 358 | 13 305 | 13 465 | 1319 |
| TGCT | 150 | 0 | 25 543 | - | - | 506 |
| THCA | 506 | 59 | 16 248 | 10 777 | 9996 | 1716 |
| THYM | 124 | 2 | 21 763 | 5139 | 329 | 3893 |
| UCEC | 538 | 33 | 16 793 | 13 531 | 12 395 | 2833 |
| UCS | 57 | 0 | 23 023 | - | - | 787 |
| UVM | 80 | 0 | 25 753 | - | - | 4508 |
aThe number of piRNAs in the total level.
bDifferentially expressed genes, P-value for Student's t-test < 0.05.
c P-value for log-rank test <0.05 based on the median value of piRNA expression.
*Primary blood derived cancer-peripheral blood.
For the transcript level of piRNAs, the piRNA expression data were merged with genotype data for the eQTL analysis in tumor and normal samples, respectively. The matched sample size is summarized in Table 2, ranging from 36 for cholangiocarcinoma (CHOL) to 989 for BRCA in tumor samples, and from 2 for skin cutaneous melanoma (SKCM) or thymoma (THYM) to 69 for kidney renal clear cell carcinoma (KIRC) in normal tissues. After quality control, an average of 3.6 million SNPs and 18 543 piRNAs were obtained in each cancer type.
| Cancer type | No. of samples | No. of SNPs | No. of piRNAsa | Tumorb | Normalb | ||||||||||
|---|---|---|---|---|---|---|---|---|---|---|---|---|---|---|---|
| Tumor | Normal | Tumor | Normal | Pairs | epiRNAs | eSNPs | Survival-eSNPsc | GWAS-eSNPs | Pairs | epiRNAs | eSNPs | Survival-eSNPsc | GWAS- eSNPs | ||
| ACC | 78 | 0 | 3 481 471 | - | 19 782 | 2 525 254 | 19 053 | 26 604 | 1 346 | 11 666 | - | - | - | - | - |
| BLCA | 407 | 19 | 3 650 579 | 3 219 231 | 14 315 | 1 977 106 | 13 691 | 30 362 | 1 645 | 12 595 | 1 445 699 | 13 691 | 21 899 | 960 | 8 246 |
| BRCA | 989 | 46 | 3 517 721 | 3 622 285 | 19 660 | 2 782 788 | 18 799 | 33 859 | 1 702 | 12 901 | 2 552 732 | 18 801 | 22 563 | 1 069 | 9 085 |
| CESC | 287 | 3 | 3 684 885 | - | 14 708 | 1 994 427 | 14 001 | 26 756 | 1 158 | 9 133 | - | - | - | - | - |
| CHOL | 36 | 9 | 3 400 798 | - | 15 298 | 1 676 961 | 14 767 | 21 739 | 652 | 7 449 | - | - | - | - | - |
| COAD | 415 | 8 | 3 649 339 | - | 18 690 | 2 577 009 | 17 737 | 36 195 | 1 545 | 12 839 | - | - | - | - | - |
| DLBC | 43 | 0 | 3 626 087 | - | 20 898 | 2 615 695 | 20 091 | 27 986 | 1 466 | 9 845 | - | - | - | - | - |
| ESCA | 181 | 13 | 3 718 825 | - | 17 184 | 2 098 675 | 16 542 | 28 410 | 2 003 | 10 594 | - | - | - | - | - |
| GBM | 0 | 0 | - | - | - | - | - | - | - | - | - | - | - | - | - |
| HNSC | 507 | 44 | 3 666 167 | 3 732 544 | 19 866 | 2 509 600 | 18 927 | 35 680 | 2 515 | 13 635 | 2 148 748 | 18 854 | 27 654 | 1 468 | 1 1236 |
| KICH | 66 | 25 | 3 649 126 | 3 711 532 | 9 329 | 1 154 364 | 8 751 | 15 759 | 988 | 6 426 | 1 074 197 | 8 675 | 16 646 | 779 | 7 066 |
| KIRC | 512 | 69 | 3 515 746 | 3 690 139 | 17 885 | 2 513 857 | 16 874 | 31 866 | 1 508 | 11 390 | 2 064 152 | 17 033 | 25 884 | 1 136 | 10 942 |
| KIRP | 288 | 34 | 3 671 497 | 3 466 168 | 13 131 | 1 593 697 | 12 703 | 24 787 | 922 | 8 329 | 1 789 072 | 12 569 | 18 298 | 620 | 7 580 |
| LAML* | 103 | 0 | 3 655 032 | - | 39 934 | 5 012 068 | 38 811 | 56 189 | 3 235 | 21 664 | - | - | - | - | - |
| LGG | 507 | 0 | 3 646 049 | - | 25 186 | 3 600 789 | 24 000 | 50 578 | 2 449 | 18 402 | - | - | - | - | - |
| LIHC | 372 | 50 | 3 556 581 | 3 624 422 | 19 064 | 2 575 614 | 18 315 | 33 045 | 2 849 | 12 077 | 2 363 850 | 18 222 | 30 708 | 2 866 | 11 503 |
| LUAD | 509 | 46 | 3 645 917 | 3 709 191 | 13 511 | 1 731 615 | 12 919 | 27 305 | 1 205 | 9 639 | 1 412 292 | 12 994 | 19 539 | 808 | 6 608 |
| LUSC | 477 | 45 | 3 597 912 | 3 691 326 | 18 888 | 2 455 751 | 18 049 | 35 408 | 1 812 | 13 310 | 2 485 952 | 18 049 | 30 732 | 1 294 | 11 034 |
| MESO | 87 | 0 | 3 608 334 | - | 14 188 | 1 569 972 | 13 619 | 21 318 | 1 019 | 7 744 | - | - | - | - | - |
| OV | 482 | 0 | 3 675 726 | - | 25 226 | 4 056 118 | 24 213 | 46 825 | 3 250 | 18 127 | - | - | - | - | - |
| PAAD | 172 | 4 | 3 646 425 | - | 10 665 | 1 201 125 | 10 171 | 23 846 | 956 | 8 298 | - | - | - | - | - |
| PCPG | 179 | 3 | 3 605 369 | - | 13 840 | 1 624 625 | 13 447 | 25 757 | 1 252 | 9 524 | - | - | - | - | - |
| PRAD | 492 | 52 | 3 640 633 | 3 539 859 | 13 854 | 1 796 309 | 13 402 | 28 336 | 1 068 | 10 138 | 1 487 462 | 13 402 | 21 577 | 755 | 8 432 |
| READ | 146 | 3 | 3 658 240 | - | 20 147 | 2 602 277 | 19 107 | 35 834 | 1 687 | 14 072 | - | - | - | - | - |
| SARC | 257 | 0 | 3 564 336 | - | 13 084 | 1 433 798 | 12 464 | 23 233 | 1 331 | 8 977 | - | - | - | - | - |
| SKCM | 98 | 2 | 3 649 256 | - | 25 485 | 2 938 720 | 24 206 | 36 926 | 2 266 | 14 484 | - | - | - | - | - |
| STAD | 411 | 40 | 3 656 610 | 3 961 248 | 15 797 | 1 887 475 | 15 190 | 31 155 | 1 520 | 11 982 | 2 196 782 | 15 190 | 27 507 | 1 069 | 9 800 |
| TGCT | 150 | 0 | 3 680 238 | - | 24 584 | 3 489 875 | 23 678 | 39 863 | 1 433 | 14 919 | - | - | - | - | - |
| THCA | 501 | 58 | 3 672 289 | 3 483 004 | 14 997 | 2 141 813 | 14 392 | 35 985 | 1 628 | 13 665 | 1 787 163 | 14 423 | 26 337 | 1 421 | 10 122 |
| THYM | 122 | 2 | 3 679 062 | - | 21 240 | 2 649 802 | 20 329 | 33 589 | 1 610 | 12 151 | - | - | - | - | - |
| UCEC | 519 | 32 | 3 623 109 | 3 491 658 | 15 457 | 2 181 794 | 14 875 | 32 023 | 1 510 | 10 937 | 1 622 960 | 14 835 | 23 876 | 902 | 8 606 |
| UCS | 55 | 0 | 3 385 763 | - | 22 230 | 2 391 166 | 21 318 | 27 722 | 1 793 | 9 757 | - | - | - | - | - |
| UVM | 80 | 0 | 3 769 109 | - | 25 259 | 3 564 692 | 24 243 | 38 124 | 1 863 | 14 003 | - | - | - | - | - |
aThe number of piRNAs in the transcript level.
b P-value for eQTL analysis < 0.05.
c P-value for log-rank test < 0.05.
*Primary blood derived cancer-peripheral blood.
Identification and exploration of cis-piRNA eQTLs
For each cancer type, the average associations of 2.4 and 1.8 million cis SNP-piRNA pairs were identified in tumor and normal samples, respectively. For tumor tissues, we identified 76 924 831 significant pairs in 32 cancer types (P-value < 0.05), ranging from 1 154 364 pairs for KICH (with 8751 epiRNAs and 15 759 eSNPs) to 5 012 068 pairs for LAML (with 38 811 epiRNAs and 56 189 eSNPs; Table 2). For normal tissues, we identified 24 431 061 significant pairs in 13 cancer types (P-value < 0.05), ranging from 1 074 197 pairs for KICH (with 8675 epiRNAs and 16 646 eSNPs) to 2 552 732 pairs for BRCA (with 18 801 epiRNAs and 22 563 eSNPs; Table 2). By comparing tumor and normal SNP-piRNA pairs in 13 cancer types, we only identified an average of 117 681 shared pairs, indicating the distinct differences of cis-piRNA eQTL results in human tumor and normal tissues. In addition, to better control the type I error, we provided the P-value at FDR = 0.1 for each cancer in Supplementary Table S2, where we identified 1 660 892 significant SNP-piRNA pairs (FDR ≤ 0.1) in tumor tissues and 114 511 pairs (FDR ≤ 0.1) in normal tissues.
In addition, among these potential eSNPs identified in tumor tissues, we found 53 186 survival-associated eSNPs (ranging from 652 for CHOL to 3250 for ovarian serous cystadenocarcinoma [OV]) and 380 672 GWAS-associated eSNPs (ranging from 6426 for KICH to 21 664 for LAML) in different cancer types. For normal tissues, we identified 15 147 survival-associated eSNPs (ranging from 620 for kidney renal papillary cell carcinoma [KIRP] to 2866 for liver hepatocellular carcinoma [LIHC]) and 120 260 GWAS-associated eSNPs (ranging from 6608 for lung adenocarcinoma [LUAD] to 11 503 for LIHC) in different cancer types.
Web design and interface
Based on the above results, we constructed a user-friendly database, piRNA-eQTL (http://njmu-edu.cn:3838/piRNA-eQTL/, which can also be accessed at http://222.190.246.206:3838/piRNA-eQTL/), using R package Shiny. In this database, we designed four modules to display the results of cis-piRNA eQTLs (tumor and normal tissues), differential expression analysis, survival analysis and GWAS-related eQTLs (tumor and normal tissues), respectively (Figure 1). Users can browse each module simply by clicking the corresponding module. For example, the user can select a cancer type, and input an SNP ID and piRNA name of interest to search for corresponding results in the four modules (Figure 2A). In addition, we also designed a ‘Pan-cancer analysis’ page, where users can submit a batch of SNPs and/or piRNAs to perform pan-cancer analysis (Supplementary Figure S1). The ‘About’ page provides more details about the function of this database.
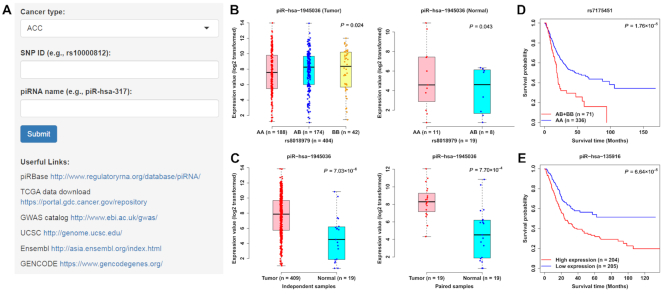
Overview of piRNA-eQTL database. (A) Advanced search box. (B) Example of eQTL boxplots on the ‘Cis-eQTLs’ page. (C) Example of differentially expressed boxplots on the ‘Differential expression analysis’ page. (D, E) Example of Kaplan–Meier (KM) plots on the ‘Survival analysis’ page.
Data browsing and querying of the four modules
On the ‘cis-eQTLs (Tumor)’ or ‘cis-eQTLs (Normal)’ page, a table with the chromosome ID, SNP ID, SNP genomic position, SNP alleles, piRNA name, statistic, beta value (effect size of the SNP on piRNA expression) and eQTL P-value is displayed on this page. When the user selects a cancer type or enters a piRNA name or SNP ID, the table will be rebuilt to display the query results. Users can download the results of cis-piRNA eQTLs for each cancer type by clicking the ‘Download’ button. In addition, users can select one SNP-piRNA pair and click the ‘Plot’ button, and a vector diagram of the boxplot is provided to display the association between the SNP genotypes and piRNA expression. For example, our analysis showed that piR-hsa-1945036 expression in individuals carrying the rs8018979 genotype AA (i.e. GG) is significantly lower than that in individuals carrying the rs8018979 genotype AB (i.e. GA) or BB (i.e. AA) in bladder urothelial carcinoma (BLCA) tumor tissues (P = 0.024); however, there was a reverse eQTL association in BLCA normal tissues (P = 0.043; Figure 2B).
On the ‘Differential expression analysis’ page, the search boxes are designed for retrieving the specific cancer type and piRNA. A table with comparison type (independent and paired Student's t-test), piRNA name, mean CPM value in tumor tissues, mean CPM value in normal tissues, fold change, statistic and Student's t-test P-value is provided. In addition, two boxplot diagrams are used to display the difference in the piRNA expression between independent and paired tumor and normal samples. For example, the expression of piR-hsa-1945036 in tumor tissues was significantly higher than that in normal tissues for BLCA (P for independent samples = 7.03 × 10⁻⁶; P for paired samples = 7.70 × 10⁻⁴, Figure 2C).
On the ‘Survival analysis’ page, the search boxes are designed for retrieving the specific cancer type, piRNA or eSNP. For piRNA, a table with the piRNA name, median survival time (months) for high- and low-expressed groups, and log-rank P-value is provided. Users can also select a different threshold value (i.e., percentile) from the slider box to split patients into high- and low-expressed groups. For eSNP, a table with the SNP ID, median survival time (months) for patients with different genotypes, and log-rank P-value is provided. Additionally, two diagrams of KM plot are provided to display the associations of piRNA expression and SNP genotypes with the overall survival probability. For example, our analysis showed that BLCA patients with the eSNP rs7175451 AB (i.e. TA) or BB (i.e. AA) genotypes have shorter survival time than patients with rs7175451 AA (i.e. TT) genotype (P for log-rank test = 1.76 × 10⁻⁵, Figure 2D). Higher expression of piR-hsa-135916 was significantly associated with a worse prognosis of BLCA patients (P for log-rank test = 6.64 × 10⁻⁵, Figure 2E).
On the ‘GWAS-eQTLs (Tumor)’ or ‘GWAS-eQTLs (Normal)’ page, a table with the SNP information, regulated piRNA and related GWAS traits is displayed. Search boxes are designed for retrieving specific cancer types, SNPs and piRNAs. In addition, users can select a different LD threshold value from the slider box to explore more potential eSNPs associated with GWAS traits. For example, the BRCA-associated eSNP rs7175451 was in the LD region of rs7170930 (r2 = 0.855), which was a potential GWAS-identified SNP for response to cytadine analogues (cytosine arabinoside) (28).
Pan-cancer analysis
On the ‘Pan-cancer analysis’ page, we provided three modules, including ‘Pan-cancer piRNA expression profile’, ‘Summary of pan-cancer eQTL analysis (Tumor)’ and ‘Summary of pan-cancer eQTL analysis (Normal)’ (Supplementary Figure S1). In the ‘Pan-cancer piRNA expression profile’ module, the search boxes are designed for retrieving a batch of piRNAs. A table with the piRNA name, tissue type, mean CPM value in 33 cancer types and P-value for the ANOVA test is provided. In addition, two boxplot diagrams are used to display the piRNA expression level across 33 cancer types in tumor and normal samples, respectively. Furthermore, users can search cancer-specific cis-piRNA eQTL results by selecting a cancer type. For example, the expression profile of piR-has-317 is shown in Supplementary Figure S2A, which can help users better investigate the piR-has-317 expression level in 33 cancer types; additionally, users can search cancer-specific piR-hsa-317-associated eQTL results by selecting a cancer type (e.g. BLCA; Supplementary Figure S2B).
In the ‘Summary of pan-cancer eQTL analysis (Tumor) ’ or ‘Summary of pan-cancer eQTL analysis (Normal)’ modules, the search boxes are designed for retrieving a batch of SNPs and/or piRNAs to display the results of three sub-modules, including ‘Summary of pan-cancer eQTL results’, ‘eSNP-associated quantitative phenotypes’ and ‘Cancer-associated piRNAs’. For the ‘Summary of pan-cancer eQTL results’ module, a table with the cancer type, chromosome ID, SNP ID, SNP genomic position, SNP alleles, piRNA name, statistic, beta value (effect size of the SNP on piRNA expression) and eQTL P-value is displayed, and a boxplot diagram is used to display the significant eQTL pairs across 33 cancer types. For example, all significant SNP-piR-hsa-317 pairs in 33 cancer types are shown in Supplementary Figure S3.
For the ‘eSNP-associated quantitative phenotypes’ module, a table with the cancer type, chromosome ID, SNP ID, SNP genomic position, SNP alleles, piRNA name, statistic, beta value (effect size of the SNP on piRNA expression), eQTL P-value, phenotype source, SNP alleles for phenotype, phenotype type, phenotype name, beta value (effect size of the SNP on quantitative phenotypes) and eQTL P-value for the phenotype is displayed, and a boxplot diagram is used to display the number of quantitative phenotypes across 33 cancer types. As shown in Supplementary Figure S4, the eSNPs associated with piR-hsa-317 were associated with multiple quantitative phenotypes (including genes, lncRNAs and CpG sites) in 33 cancer types. For example, the rs10823260 C allele was associated with increased expression levels of piR-hsa-317 (beta = 0.030; P = 0.019) and STOX1 (beta = 0.24; P = 4.51 × 10⁻⁸) in BRCA tumor tissues.
For the ‘Cancer-associated piRNAs’ module, a table with the cancer type, chromosome ID, SNP ID, SNP genomic position, SNP alleles, piRNA name, statistic, beta value, eQTL P-value, piRNA associated cancer and related PubMed ID is displayed. For example, the rs10215854 A allele was associated with a decreased expression level of piR-hsa-29218 in BLCA tumor tissues; besides, piR-hsa-29218 was also reported to play a crucial role in the development of bladder cancer (7).
DISCUSSION
In this study, we systematically performed cis-eQTL, differential expression, survival and GWAS-eQTL analyses by combining piRNA expression and genotype data in 33 cancer types. Finally, we constructed a user-friendly database called piRNA-eQTL for users to query, browse and download corresponding results. Millions of tables and plots (e.g. boxplots for eQTL and differential expression analyses, and KM plots for survival analysis) are provided in this online database.
Compared to previous eQTL databases, our database has several strengths. First, this is the first eQTL database to systematically evaluate the effects of genetic variants on piRNA expression across 33 cancer types. Second, considering the distinct differences in eQTLs between tumor and normal tissues (29), we provide cis-piRNA eQTL results for both tumor and normal tissues, which can help users better identify cancer-specific eQTLs. Third, we also provide the ‘differential expression analysis’ and ‘survival analysis’ modules, which are useful to help understand the potential roles of piRNAs in the development of cancers. Fourth, we used the piRBase database as our reference data. Compared to previous piRNA reference databases (e.g. fRNAdb and piRNABank) (30,31), piRBase is the first database that systematically integrates various piRNA associated data to support piRNA functional analysis, and the numbers of piRNAs have been increased. In addition, a major limitation of this database is that the piRNA expression level may not be very accurate because these data are obtained from small RNA sequencing (miRNA-Seq) data, and small RNA-Seq data are not enriched for piRNAs neither enriched for any other class. Notably, piRNA-specific RNA-Seq data are needed for further studies in non-coding RNA areas. Additionally, the sample size of normal tissues is limited for some cancer types. In particular, eQTL results with sample sizes <100 should be interpreted with caution; therefore, in our future studies, we will update the piRNA-eQTL database to provide more accurate cis-piRNA eQTL results with sufficient sample size by incorporating other databases (e.g. Gene Expression Omnibus [GEO] dataset). Furthermore, given that previous studies have demonstrated the influence of somatic mutations (e.g. single-nucleotide variants [SNVs], small insertions and deletions, genomic rearrangements and structural variations) on gene expression (32), a systematic analysis between somatic mutations and piRNA expression needs to be further performed and incorporated into this database.
CONCLUSION
In summary, piRNA-eQTL is the first online database for providing cis-piRNA eQTL results by integrating genotype and piRNA expression data across 33 cancer types, and this database could serve as an important resource to assist the research community in understanding the roles of genetic variants and piRNAs in the development of human cancers.
DATA AVAILABILITY
The raw genotype and small RNA sequencing data have been deposited in The Cancer Genome Atlas (TCGA) program. All other relevant data are available on the piRNA-eQTL website.
ACKNOWLEDGEMENTS
We thank The Cancer Genome Atlas (TCGA) program for sharing raw small RNA sequencing and genotype data.
SUPPLEMENTARY DATA
Supplementary Data are available at NAR Online.
FUNDING
National Natural Science Foundation of China [81822039, in part]; Priority Academic Program Development of Jiangsu Higher Education Institutions (Public Health and Preventive Medicine). Funding for open access charge: None.
Conflict of interest statement. None declared.
REFERENCES
1.
2.
3.
4.
5.
6.
7.
8.
9.
10.
11.
12.
13.
14.
15.
16.
17.
18.
19.
20.
21.
22.
23.
24.
25.
26.
27.
28.
29.
30.
31.