 The nature of the modification at position 37 of tRNAPhe correlates with acquired taxol resistance
Nucleic Acids Research


The authors wish it to be known that, in their opinion, the first two authors should be regarded as Joint First Authors.

- Altmetric
Acquired drug resistance is a major obstacle in cancer therapy. Recent studies revealed that reprogramming of tRNA modifications modulates cancer survival in response to chemotherapy. However, dynamic changes in tRNA modification were not elucidated. In this study, comparative analysis of the human cancer cell lines and their taxol resistant strains based on tRNA mapping was performed by using UHPLC–MS/MS. It was observed for the first time in all three cell lines that 4-demethylwyosine (imG-14) substitutes for hydroxywybutosine (OHyW) due to tRNA-wybutosine synthesizing enzyme-2 (TYW2) downregulation and becomes the predominant modification at the 37th position of tRNAphe in the taxol-resistant strains. Further analysis indicated that the increase in imG-14 levels is caused by downregulation of TYW2. The time courses of the increase in imG-14 and downregulation of TYW2 are consistent with each other as well as consistent with the time course of the development of taxol-resistance. Knockdown of TYW2 in HeLa cells caused both an accumulation of imG-14 and reduction in taxol potency. Taken together, low expression of TYW2 enzyme promotes the cancer survival and resistance to taxol therapy, implying a novel mechanism for taxol resistance. Reduction of imG-14 deposition offers an underlying rationale to overcome taxol resistance in cancer chemotherapy.
INTRODUCTION
Over 170 ribonucleic acids (RNA) modifications have been identified in messenger RNA (mRNA), ribosome RNA (rRNA), transfer RNA (tRNA), micro RNA (miRNA) and others (1). These RNA modifications exhibit chemical diversities and are known to play important roles in the regulation of biological functions under both physiological and pathological conditions (2–4). One such example is the dynamic regulatory function of N6-methyladenosine (m6A) on methylation and demethylation of mRNA, which significantly impacts on the transcription and translation processes (5). Besides, RNA modifications may be participating in diverse biological processes under a variety of conditions (3,6–8), indicating that the current understanding of RNA modifications is still limited.
tRNAs are non-coding RNAs typically of 76–90 nucleotides in length and are the most abundant in containing modified nucleotides among the various types of RNAs. During maturation, canonical nucleotides at specific positions (D-loop, T-loop and anti-codon loop) in the tRNA molecule can be modified by simple reactions such as methylation, hydroxylation, and acetylation, or by complex hyper-modifications via a cascade of enzymatic reactions (9,10). These modifications contribute to the stability of the L-shape tertiary structure and codon-anticodon interactions. The nucleotides at the 34th and 37th positions are usually modified to ensure accurate recognition of codon and prevent frameshift mutation (11–14). Recent studies show that tRNA modifications may alter in response to stress and may be related to human diseases such as cancer, mitochondrial disorder and type 2 diabetes (4,15–18). For example, tRNA modifications changed significantly when yeast was treated with hydrogen peroxide (H2O2), sodium hypochlorite, and sodium arsenite (19). Moreover, exposure to H2O2 induced an increase in 5-methylcytosine (m5C) at the anticodon first position of tRNALeu (CAA) catalyzed by tRNA methyltransferase 4, leading to the upregulation of RPL22A, a leucine (UUG codon)-rich protein that has a significant correlation with oxidative stress resistance (20). Modified uridines, 5-methoxycarbonylmethyluridine (mcm5U) and 5-methoxycarbonylmethyl-2-thiouridine (mcm5s2U) located at 34th position of tRNAArg (UCU) and tRNAglu (UUC), respectively, is linked to resistance to DNA damage caused by paromomycin (21). Additionally, it has been shown that BRAF-expressing melanoma cells are dependent on the enzymes (ELP3, CTU1, and CTU2) that modify uridine at 34th position of tRNAs for survival, and concurrent inhibition of these enzymes and mitogen-activated protein kinases (MAPK) signaling synergizes to cause cell death in these melanoma cells (22). As activation of the PI3K signaling pathway, which causes resistance to MAPK inhibitor, such as vemurafenib and trametinib, markedly increases the expression of these enzymes, which promote glycolysis and expression of HIF1α protein. Therefore, these authors concluded that these enzymes promote the survival of melanoma cells and resistance to therapy by regulating specific mRNA translation (22).
Drug resistance leading to treatment failure is a major clinical challenge in cancer therapy (23). Currently, evidence supporting a link between RNA modifications and chemotherapy resistance is scarce (17,22,24). Other than the MAPK inhibitor-resistance in BRAFV melanoma cells being reversed by the silencing of ELP3, CTU1 or HIF1α (22), knockdown of NSUN2 and METTL1, the enzymes that catalyze m5C and N7-methylguanosine (m7G) in tRNA, is reported to enhance the cytotoxicity of 5-fluorouracil (5-Fu), while not affecting cisplatin and taxol-induced cytotoxicity (24). However, these findings do support the idea that resistance to some cancer therapies may be related to tRNA modifications and thus reprogramming of tRNA modifications may provide insight into cancer therapy and overcoming drug resistance. Paclitaxel (taxol), a taxane natural product from genus Taxus, and its derivatives (Docetaxel and Abraxane) are widely used as standard first-line chemotherapeutic drugs for various types of solid tumors such as cervical, lung and ovarian cancer (25). The overall mechanisms of taxol resistance are unclear but appear to be complex (26). Overexpression of P-glycoprotein (p-gp), which promotes drug efflux, has been suggested as one of the mechanisms (27). The metabolism in taxol resistant cancer cells may appear to be reprogrammed to meet the altered needs of this malignant phenotype as an adaptation to the microenvironment (28,29). To date, whether or not taxol resistance affects the levels of tRNA modifications and how tRNA modifications contribute to taxol resistance remain unexplored.
Current sequencing technologies are unable to directly detect most tRNA modifications due to the removal of modifications during reverse transcription. Although several improvements including immunoprecipitation, chemoselective alteration and antibody crosslinking may be performed in next-generation sequencing, only a few methods are able to detect modifications with single-nucleotide resolution (30,31). In contrast, with epi-transcriptome sequencing technologies, LC–MS based RNA profiling allows, at least theoretically, identification of all modifications and sequence of oligonucleotides (32). Although it is difficult to identify long RNA sequence (>30 nt) accurately in the LC–MS approach owing to limitations in resolution and sensitivity, this approach can make an important contribution to RNA mapping and characterization of new RNA modifications (33,34). Being Used in combination with multiple endonucleases (RNase T1, cusativin, and RNase MC1), LC–MS is applicable for RNA characterization in general, as RNA mixture is degraded into several signature products which can be easily and accurately mapped according to sequence information (35–38). For nucleoside analysis by nano-LC–MS, the detection limit may reach down to femtomole levels (39). The sensitivity can be further improved through chemical tagging (40,41), suggesting that this approach may expand current knowledge and understanding into epi-transcriptomic marks by monitoring the dynamic change of RNA modifications.
In the current study, it was hypothesized that alteration of tRNA modifications may have an important role in taxol resistance. A tRNA mapping approach based on ion-pair LC-MS and RNase T1 digestion was used to comprehensively explore the differences between human cervical carcinoma (HeLa), human lung adenocarcinoma (A549) and human ovarian cancer (A2780) cell lines and their taxol-resistant counterparts.
MATERIALS AND METHODS
Chemicals and reagents
Methanol and acetonitrile were of MS grade from Merck (Darmstadt, Germany). Formic acid (MS grade), hexafluoro-2-propanol (HFIP, ≥99.0%), trimethylamine (TEA, ≥99.5%), Transcriptor Universal cDNA Master kit, protease Inhibitor Cocktail, phosphatase inhibitor, phosphodiesterase I and II from Crotalus adamanteus venom were purchased from Sigma-Aldrich (St. Louis, MO, USA). TRIzol reagent, mirVana™ miRNA isolation kit, Pierce™ Streptavidin-coated magnetic beads, RNase I and RNase T1 were purchased from Thermo Fisher Scientific (Waltham, MA, USA). A low-range ssRNA ladder and shrimp alkaline phosphatase were purchased from New England Biolabs (Beverly, MA, USA). RPMI-1640 medium, fetal bovine serum (FBS), penicillin, streptomycin and puromycin were obtained by Gibco (Carlsbad, CA, USA). RNase A was purchased from Takara Biotechnology (Dalian, China). Reference standards, 4-demethylwyosine (imG-14), wyosine (imG) and isowyosine (imG2), were provided by 9dingchem Co., Ltd (Shanghai, China). The purity was more than 98%. Taxol (purity ≥ 98%) was supplied by AdooQ bioscience (Nanjing, China). Ultrapure water (18.25 MΩ·cm) was produced using a Milli-Q system from Millipore (Millipore, Bedford, MA, USA).
Cell culture and establishment of acquired taxol resistant strain
Human cervical carcinoma cell line (HeLa), human lung adenocarcinoma cell line (A549) and Human ovarian cancer cell line (A2780) were purchased from the ATCC and their taxol resistant strains (HeLa/T, A549/T and A2780/T) were obtained from KeyGen Biotech Co., Ltd. (Nanjing, China). All cells were cultured in RPMI-1640 medium supplemented with 10% FBS, 100 U/ml penicillin, and 100 mg/ml streptomycin at 37°C in a 5% CO2. Taxol was added into the medium of taxol resistant strains at a final concentration of 600 nM.
Taxol-resistant cells (HM-A2780/T) were established by exposing A2780 cells to taxol starting at 20 nM and then increased by 20 nM every 2 weeks to a final concentration of 180 nM (42). A2780 cells were used as control. Approximately 2 × 10⁶ cells were harvested every 2 weeks washed twice with ice-cold PBS, and then resuspended in 1 ml TRIzol reagent. The IC50 value for the cytotoxic effect of taxol and tRNA-wybutosine synthesizing enzyme-2 (TYW2) protein was determined every 8 weeks.
HeLa cells with stable TYW2 knockdown was supplied by GeneCopoeia (Guangzhou, China). Briefly, the shRNA target sequence for TYW2 was 5′-CCAGCGATACAGAGAATATCT-3′. The target shRNA and scrambled control were ligated into psi-LVRU6GP. The lentivirus vector was pEZ-Lv105. HeLa cells were infected with the TYW2 knockdown lentivirus or scramble shRNA lentivirus. Cells were cultured in RPMI-1640 medium supplemented with 10% FBS and 1 μg/mL puromycin. Quantitative real-time PCR (RT-qPCR) and Western blotting analysis were carried out to evaluate the TYW2 knockdown efficiency.
RNA extraction and tRNA isolation
Total RNA was extracted from cells using the TRIZOL Reagent method. Small RNA (<200 nt) isolation was performed on mirVana™ miRNA isolation kit according to the manufacturer's protocol. Total tRNA was purified by a modified polyacrylamide gel electrophoresis method as described previously (43).
tRNAphe was isolated from the small RNA mixture by affinity method as described previously (43). Briefly, biotinylated capture DNA probe, 5′-biotin-TTCAGTCTAACGCTCTCCCAACTGAGCTAT-3′ was incubated with the small RNA mixture at 65°C for 2 h. The biotinylated DNA-tRNAphe duplex covalently immobilized on Pierce™ Streptavidin-coated magnetic beads. tRNAphe was released by incubation at 70°C in RNase-free water. Approximately 2 mg of small RNA mixture yielded 5 μg of purified tRNAphe.
RNase digestion
Total tRNAs or purified tRNAphe was incubated at 95°C for 3 min and then immediately cooled on ice. The RNA samples were digested with RNase T1 (50U/μg RNA) or RNase A (1 ng/μg RNA) in 220 mM ammonium acetate buffer at 37°C for 2 h. The reaction was terminated by incubation at 70°C for 10 min. The reaction mixture was lyophilized and reconstituted in 60 μl ion-pair mobile phase A for tRNA mapping.
For tRNA modification analysis, 15 μg of RNA samples were pre-incubated in reaction buffer (1 × CutSmart® Buffer containing 2 mM ZnCl2) at 37°C for 10 min. An enzyme cocktail containing RNase I (10 U), phosphodiesterase I and II (0.05 U) was added. After 3 h, shrimp alkaline phosphatase (2 U) was added and incubation continued for another 1 h. The reaction was terminated by incubation at 70°C for 10 min. The reaction mixture was lyophilized and reconstituted in 50 μl water containing 0.1% formic acid for further qualitative and quantitative analysis.
LC–MS/MS analysis
LC–MS/MS analysis of digested tRNA products was performed using an Agilent UHPLC 1290 system coupled with 6545 quadrupole time-of-flight (Q-TOF) mass spectrometer (Agilent Technologies, Santa Clara, CA, USA). Oligonucleotide separation was carried out with an ACQUITY UPLC OST C18 Column (130Å, 2.1 × 100 mm, 1.7 μm, Waters, MA, USA) and an ion-pair (IP) mobile phase system consisted of 100 mM HFIP, 15 mM TEA and methanol in water (pH 8.5). Elution was performed at a flow-rate of 0.2 ml/min with a methanol concentration gradient as follows: 1% for 1.50 min, 1–19% over 15 min, 19–30% over 3.5 min and finally 30% for 2 min. The column temperature was set at 60°C and, the injection volume was 20 μl.
Agilent 6545 ESI-Q-TOF-MS was operated in the negative mode in the range of m/z 600–3200 for MS1 scan at a scan rate of 2 spectra/s and m/z 300–1800 for MS2 at a scan rate of 3 spectra/s. The acquisition mode was set at auto MS/MS mode with collision energy from 10 to 65 eV. The instrument parameters applied were as follows: drying gas temperature 320°C, flow rate 12 l/min, nebulizer pressure 35 psi, sheath gas temperature 350°C, sheath gas flow rate 12 l/min, capillary voltage 3500 V, nozzle voltage 1700 V, fragmentor voltage 220 V, skimmer voltage 65 V and octopole RF peak 750 V.
Ribonucleoside analysis was performed on an Agilent 1290 UHPLC tandem 6550 Q-TOFMS system and an Agilent 1290 UHPLC tandem 6490 triple quadrupole (QQQ) MS system. The instrumental and analytical parameters are shown in supplemental material A.
qPCR analysis
Relative expression of TYW2 mRNA was determined by the 2−ΔΔCt method using quantitative real-time PCR (RT-qPCR). Approximately 2 μg RNA (>200 nt) was reversely transcribed for cDNA synthesis by Transcriptor Universal cDNA Master kit according to the manufacturer's protocol. RT-qPCR was performed using the GoTaq qPCR Master Mix (Promega, Mannheim, Germany) in ViiA7 Real-Time PCR System (Applied Biosystems, Warrington, UK). All primers were obtained from Beijing Genomics Institute (Beijing, China) and the primer sequences are as follow: GAPDH (forward primer: 5′-TGAAGGTCGGAGTCAACGGATT-3′, reverse primer: 5′-CGTTCTCAGCCTTGACGGT-3′), and TYW2 (forward primer: 5′-TGTGTCTTGAGGTGAGTCGC-3′ and reverse primer: 5′-CCACTGCTTGGCTTGGAAAC-3′).
Western-blots analysis
Cells were lysed in 1× RIPA buffer with a protease inhibitor cocktail and phosphatase inhibitor (Roche, Mannheim, Germany). Total protein was quantified using the Pierce BCA Protein Assay Kit (Thermo Fisher Scientific). Samples (20 μg) was separated by 10% SDS-polyacrylamide gels and then transferred to polyvinylidene difluoride (PVDF) membranes (EMD Millipore, MA, USA). After blocking with 5% BSA in TBST buffer, the PVDF membrane was incubated with an anti-GAPDH antibody (Cell signaling, #5174, 1:1200 dilution) and anti-TYW2 antibody (ATLAS Antibody, HPA023939, 1:900 dilution) overnight at 4°C. PVDF membranes were washed with TBST buffer three times then incubated with secondary antibody (IRDye® 800CW Goat anti-Rabbit IgG, Abcam, ab216773, 1:8000 dilution) for 1 h at room temperature. Protein detection was carried out by the Odyssey CLx Imaging System (Li-COR Biosciences, Belfast, ME, USA).
Cell viability and colony formation assay
Cell viability was determined by the MTT assay. Approximately 4 × 10³ cells in 100 μl were seeded in 96-well plates and incubated at 37°C overnight for cell adhesion. Then, cells were treated with taxol at varying concentrations for 48 h. Subsequently, 50 μl of 3-(4,5-dimethylthiazol-2-yl)-2,5-diphenyltetrazolium bromide (MTT, 1 mg/ml) was added to each well. The medium was removed after 4 h, and then 150 μl DMSO was added to each well. The absorbance at 570 nm was determined by a SpectraMax 190 microplate reader (Molecular Devices, Sunnyvale, CA, USA). Dose–response curves were plotted with cell viability and taxol concentrations.
Colony formation assay with minor revision was performed as described previously (44). In each well, 200 cells in 0.5 ml were seeded in 24-well plates for 24 h. Then, cells were exposed to different concentrations of taxol from 0 to 10 nM for 48 h and were subcultured in a taxol-free medium for 7 days. Colonies were stained by a crystal violet solution after fixation with 4% paraformaldehyde solution.
Data analysis
An in-house database on tRNA digested products derived from Homo sapiens was established based on open sources of Transfer RNA database tRNAdb (http://trnadb.bioinf.uni-leipzig.de/DataOutput/) and Modomics (https://iimcb.genesilico.pl/modomics/) and Mongo-Oligo Mass Calculator (https://mods.rna.albany.edu/masspec/Mongo-Oligo). The molecular formulae of tRNA digested products were calculated by a simple program written in R language. tRNA mapping was processed using the ‘Find by formula’ algorithm in Agilent MassHunter Workstation Software with mass accuracies of <5 ppm between the theoretical mass and calculated mass for multi-charged ions. The sequence information was principally deduced by c- and y-type series ions in Collision-induced dissociation (CID) spectra and additionally confirmed by RNAModmapper in ‘Fixed sequence modification mapping’ with a maximum tolerance of 0.5 Da for fragment ions (45). The gray value was measured using ImageJ software (NIH, Bethesda, USA). The IC50 values and statistical analysis by Student's t-test were calculated using Prism 7.0 (GraphPad, USA).
RESULTS
Comprehensive tRNA mapping in HeLa and HeLa/T cells
Acquired taxol resistance is a common phenomenon in clinical cancer therapy, over time this chemotherapeutic agent becomes increasingly ineffective. To examine the difference between wild type cancer cells and taxol-resistance strains in terms of tRNAs and their modifications, wild type HeLa cell and taxol-resistance HeLa cell (HeLa/T) were selected for tRNA mapping analysis. Total tRNA mixtures extracted from HeLa and HeLa/T cells were subjected to RNase T1 digestion followed by IP-UHPLC-QTOF-MS analysis. As RNase T1 specifically degrades single-stranded RNA at guanosine residues, its digestion products are not expected to cover the whole sequence of tRNAs. However, the majority of these products were unique for corresponding tRNAs. A total of 77 digestion products from 22 human tRNAs were tentatively assigned in HeLa and HeLa/T cells according to our in-house database. The interpretation of high-resolution MS data is listed in Supplementary Table S1. The peak areas of signature digestion products were normalized to the peak area of TψCG, which is a conserved RNase T1 digestion product that was derived from multiple tRNAs. Figure 1A shows the heatmap comparing digestion products of tRNAPhe in HeLa and HeLa/T cells. The volcano plot (Figure 1B), which compares the fold change and P-value, indicates that A[Cm]U[Gm]AA[OHyW]AΨCUAAAG, a unique digestion product of tRNAPhe, is the most downregulated in HeLa/T cells. On the other hand, D[acp3U]AG is the most upregulated. However, none of the other digestion products attained a difference between HeLa and HeLa/T cell with log2 FC and log10P-value >3 and 1.13 (P = 0.05), respectively. Therefore, these findings support the idea that the sequence or modifications in HeLa/T tRNAPhe might have been altered when compared to HeLa tRNAPhe.

![tRNA mapping data of HeLa and HeLa/T cells. Heat map showing the upregulation and downregulation of RNase T1 signature digestion products in HeLa versus HeLa/T cells (A). [Each cell (n = 3 batches) was extracted for IP-UHPLC-QTOF-MS analysis in parallel. The relative peak area was calculated by peak area of digested product/ peak area of TψCG.]. Volcano Plot showing the fold change and statistical significance of the differences between HeLa and HeLa/T cells (B). [Red triangle = upregulated product, blue rhombus = downregulated, and grey dots = no significant change.]](/dataresources/secured/content-1765762298978-5d4a4229-5d7a-4a1e-becc-9ea237dead1d/assets/gkaa1164fig1.jpg)
tRNA mapping data of HeLa and HeLa/T cells. Heat map showing the upregulation and downregulation of RNase T1 signature digestion products in HeLa versus HeLa/T cells (A). [Each cell (n = 3 batches) was extracted for IP-UHPLC-QTOF-MS analysis in parallel. The relative peak area was calculated by peak area of digested product/ peak area of TψCG.]. Volcano Plot showing the fold change and statistical significance of the differences between HeLa and HeLa/T cells (B). [Red triangle = upregulated product, blue rhombus = downregulated, and grey dots = no significant change.]
Identification of the tRNAphe variants from taxol resistant strains
tRNAphe was purified from small RNAs as described in Materials and Methods. tRNAphe from HeLa and HeLa/T cells was analyzed by IP-UHPLC–QTOF–MS. The molecular weights, obtained via spectral deconvolution that converted multi-charged ions into a singly charged one, of HeLa tRNAphe was 24957.20 amu, which is consistent with that of the reported sequence. In comparison, the HeLa/T tRNAphe was found to be 203 amu less at 24754.20 amu (Figure 2A and B). The mutant sequence (4952.72 amu) was confirmed at the anti-codon arm by RNase T1 digestion. In addition, a minor mutant sequence (4966.76 amu) was also observed (Figure 2C and Supplementary Table S2). The MS2 spectra and data annotation are shown in supplemental material B. However, the location of the mutant site was still not determined due to insufficient MS2 data of c- and y-type ions.
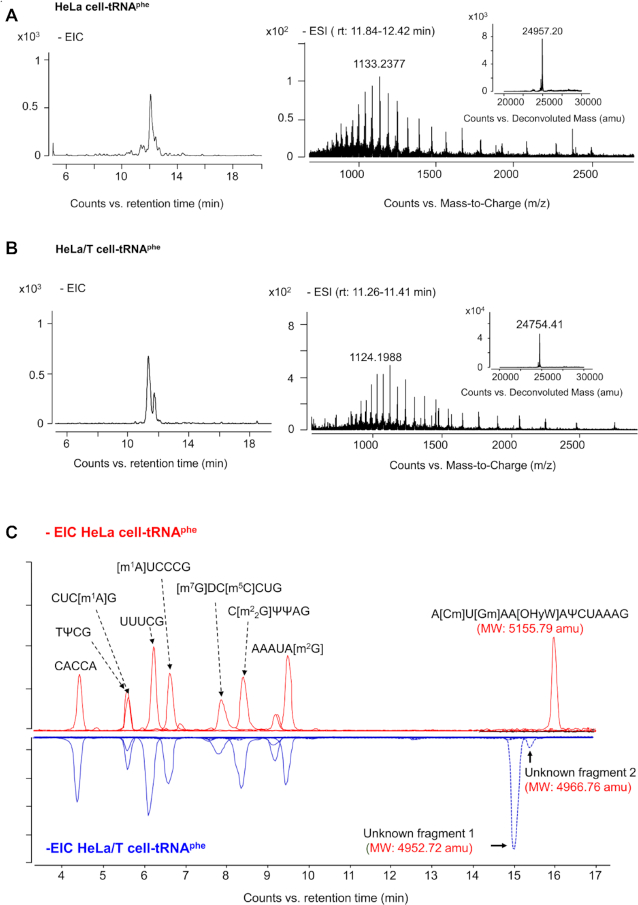
The chromatogram, mass spectrum and deconvoluted mass spectrum of individual tRNAphe isolated from HeLa cells (A) and HeLa/T cells (B). Profiling of the RNase T1-digestion products of tRNAphe isolated from HeLa cells and HeLa/T cells (C).
RNase A digestion generated shorter oligonucleotides when compared with those generated by RNase T1 digestion. The anti-codon arm of tRNAphe was cleaved into two major fragments, AGA[Cm]U and [Gm]AA[OHyW]Aψ (Figure 3A). Figure 3B shows that the intensity of AGA[Cm]U was found to be the same between HeLa and HeLa/T, whereas the intensity of [Gm]AA[OHyW]Aψ was about 50 times lower in HeLa/T. The mutant sequence was narrowed down to six nucleotides at the 34th–39th position. The MS2 spectrum of [Gm]AA[OHyW]Aψ was unequivocally mapped as shown in Figure 3C. Using this spectrum as reference, MS2 analysis of mutant sequences in HeLa/T revealed that OHyW at position 37 was modified (Figure 4A and Table 1). Interestingly, the MS2 data (Table 1) of the three fragments (HeLa fragment, HeLa/T fragment-1, and -2) presents the same a4-B type ions. Therefore, the molecular weights of modified nucleotides at position 37 of tRNAphe variants are 323 and 337 Da, respectively, indicating that imG-14, imG and imG2 are possible candidates.
![The secondary structure of tRNAphe in HeLa cells (A). Extract ion chromatograms (EICs) of tRNAphe anti-codon fragments (AGA[Cm]U and [Gm]AA[OHyW]AΨ) together with their intensity in HeLa cells and HeLa/T cells (B). The CID MS2 spectra of characteristic fragments (positions 34–39) in HeLa cells (C). [The product ions related to sequence information are assigned in MS2 spectra.]](/dataresources/secured/content-1765762298978-5d4a4229-5d7a-4a1e-becc-9ea237dead1d/assets/gkaa1164fig3.jpg)
The secondary structure of tRNAphe in HeLa cells (A). Extract ion chromatograms (EICs) of tRNAphe anti-codon fragments (AGA[Cm]U and [Gm]AA[OHyW]AΨ) together with their intensity in HeLa cells and HeLa/T cells (B). The CID MS2 spectra of characteristic fragments (positions 34–39) in HeLa cells (C). [The product ions related to sequence information are assigned in MS2 spectra.]
![The CID MS2 spectra of characteristic fragments (34th–39th position) in HeLa/T cell (A). [The product ions related to sequence information are assigned in MS2 spectra.]. EICs of characteristic RNase A digestion products (m/z 1025.6510 and m/z 1032.6593, z = –2) in three taxol-resistant strains as compared to the corresponding wild type cells (B).](/dataresources/secured/content-1765762298978-5d4a4229-5d7a-4a1e-becc-9ea237dead1d/assets/gkaa1164fig4.jpg)
The CID MS2 spectra of characteristic fragments (34th–39th position) in HeLa/T cell (A). [The product ions related to sequence information are assigned in MS2 spectra.]. EICs of characteristic RNase A digestion products (m/z 1025.6510 and m/z 1032.6593, z = –2) in three taxol-resistant strains as compared to the corresponding wild type cells (B).

| Digestion products | Precursor ions (m/z) | a type ions | c type ions | w type ions | y type ions | ||||
|---|---|---|---|---|---|---|---|---|---|
| [Gm]AA[OHyW]AΨ | [M-3H]3−751.1259 | a1 | N.D | c1+H2O | 376.0658 | w1 | 402.9962 | y1 | 323.0271 |
| (HeLa Fragment) | [M-2H]2−1127.19146 | a2 | N.D | c2 | 687.1061 | w2 | 732.0464 | y2 | 652.0797 |
| Position 34–39 | a3 | N.D | c3 | 1016.1574 | w3 | N.D | y3-OHyW | 846.0765 | |
| a4-OHyW | 1130.1880 | c4-OHyW | 1210.1584 | w4 | N.D | y4 | N.D | ||
| a5 | N.D | c5 | N.D | w5 | N.D | y5 | N.D | ||
| [Gm]AA[imG-14]AΨ | [M-3H]3- 683.4321 | a1 | N.D | c1+H2O | 376.0650 | w1 | 402.9951 | y1 | 323.0288 |
| (HeLa/T Fragment-1) | [M-2H]2− 1025.6513 | a2 | N.D | c2 | 687.1054 | w2 | 732.0454 | y2 | 652.0791 |
| Position 34–39 | a3 | N.D | c3 | 1016.1587 | w3 | N.D | y3 | 1035.1394 | |
| a4-[imG-14] | 1130.1920 | c4 | 1400.2192 | w4 | N.D | y4 | N.D | ||
| a5 | N.D | c52− | 864.1325 | w5 | N.D | y5 | N.D | ||
| [Gm]AA[imG/imG2]AΨ | a1 | N.D | c1+H2O | 376.0665 | w1 | 402.9932 | y1 | 323.0273 | |
| (HeLa/T Fragment-2) | [M-3H]3- 688.1031 | a2 | N.D | c2 | 687.1060 | w2 | 732.0461 | y2 | 652.0808 |
| Position 34–39 | [M-2H]2− 1032.6588 | a3 | N.D | c3 | 1016.1593 | w3 | N.D | y3- imG/imG2 | 846.0762 |
| a4-imG | 1130.1880 | c4-imG/imG2 | 1210.1598 | w4 | N.D | y4 | N.D | ||
| a5 | N.D | c5 | N.D | w5 | N.D | y5 | N.D | ||
N.D: not detected
The signature digestion products of tRNAphe variants, possibly [Gm]AA[imG-14]Aψp (1025.6510 [z = –2]) and [Gm]AA[imG/imG2]Aψp (1032.6593 [z = –2]), were also detected in two other taxol resistant strains (A549/T and A2780/T), while neither were found in wild type cells except for a small amount of [Gm]AA[imG-14]Aψp in A2780 (Figure 4B). Through UHPLC-QTOF-MS analysis of nucleosides obtained from complete hydrolysis of total tRNAs extracted from wild type and taxol resistant cells, it was revealed that imG-14 and imG were the major wyosine derivatives in taxol resistant strains (supplemental material A) based on their retention time values of reference standards together with high-resolution MS data, isotope distribution, and fragmentation patterns. Therefore, it is concluded that the anti-codon loop (34th–39th position) of the two tRNAphe variants in taxol resistant strains is [Gm]AA[imG-14]Aψ and [Gm]AA[imG]Aψ.
Dynamic changes of TYW2 and imG-14 during taxol resistance induction
In Eukaryotes, wybutosine derivatives are generated through a specific biosynthetic pathway involving enzymes such as TRM5 and TYW1-TYW5, and TYW2 is primarily responsible for the formation of wybutosine derivatives in tRNAphe (46,47). imG-14 is an important precursor for the biosynthesis of OHyW. A strong relationship between imG-14 and TYW2 deletion has been reported in the literature (47). On the basis of our results, we could speculate that deposition of [Gm]AA[imG-14]Aψ and [Gm]AA[imG]Aψ in taxol resistant strains may be associated with inhibition of the biosynthetic pathway of OHyW by the downregulation of TYW2. The possible biosynthetic pathway of OHyW in the wild-type cancer cells and taxol resistant strains is presented in Figure 5.
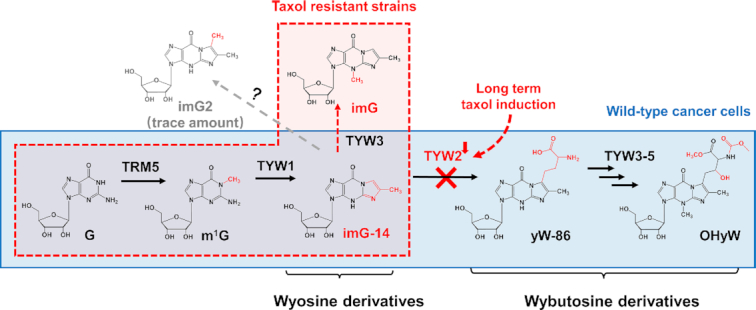
A schematic showing the biosynthetic pathway of OHyW in wild type cancer cells (blue area) and taxol resistant strains (red area).
Without exception, a significant decline on the expression of TYW2 was observed in all 3 taxol resistant strains when compared to the corresponding wild types (Figure 6A and B). In MRM mode, imG-14, imG2, and imG could be detected in these cells (Figure 6C). The levels of imG-14 and imG were consistently higher by multiple folds in taxol resistant strains than in wild types. In contrast, the levels of imG2 were either slightly higher or about the same between resistant and control cells. These findings are consistent with OHyW being replaced by imG-14 and imG in taxol- resistant strains.
![Relative expression of TYW2 mRNA in taxol resistant strains vs wild type control (A). [Data are presented as mean ± SD, **** P< 0.0001, Student's t-test]. Western-blot analysis of TYW2 expression in taxol resistant strains vs wild type control (B). MRM chromatograms of imG-14 (m/z 322.0→190.0) and imG (m/z 336.0→204.0) in wild type and taxol resistant cells (C). [N.D. = not detected]](/dataresources/secured/content-1765762298978-5d4a4229-5d7a-4a1e-becc-9ea237dead1d/assets/gkaa1164fig6.jpg)
Relative expression of TYW2 mRNA in taxol resistant strains vs wild type control (A). [Data are presented as mean ± SD, **** P< 0.0001, Student's t-test]. Western-blot analysis of TYW2 expression in taxol resistant strains vs wild type control (B). MRM chromatograms of imG-14 (m/z 322.0→190.0) and imG (m/z 336.0→204.0) in wild type and taxol resistant cells (C). [N.D. = not detected]
As described in Materials and Methods, A2780 cells were treated with incremental doses of taxol for 16 weeks to develop taxol resistance, as shown by the diminishing cytotoxic potency of taxol (Figure 7A). At week 16, IC50 value was 1363 nM as compared to 341 nM in the control. These resistant cells were designated as HM-A2780/T cells. Analysis by qPCR and LC–MS revealed that TYW2 mRNA expression and imG-14 levels started to decrease and increase, respectively, about 6–8 weeks into the taxol treatment. By 16 weeks, TYW2 expression was reduced to about 57% of control while imG-14 levels increased 10-fold (Figure 7B). In support, the decline of TYW2 protein expression was also observed (Figure 7C). Accordingly, the downregulation of TYW2 that occurs during the development of taxol resistance explains the accumulation of imG-14 in tRNAphe as the biosynthetic pathway to OHyW is blocked (Figure 5).
![IC50 values of the cytotoxic effects of taxol on A2780 cells treated with incremental doses of taxol over 16 weeks (A). [The increase in IC50 indicated the development of taxol resistance.] The time course of increase in imG-14 levels in A2780 cells treated with incremental doses of taxol over 16 weeks (B). TYW2 expression in A2780 cells treated with incremental doses of taxol over 16 weeks at the mRNA level (left) and protein (right) levels (C). [Data are presented as mean ± SD, *P< 0.05, **P < 0.01, Student's t-test.]](/dataresources/secured/content-1765762298978-5d4a4229-5d7a-4a1e-becc-9ea237dead1d/assets/gkaa1164fig7.jpg)
IC50 values of the cytotoxic effects of taxol on A2780 cells treated with incremental doses of taxol over 16 weeks (A). [The increase in IC50 indicated the development of taxol resistance.] The time course of increase in imG-14 levels in A2780 cells treated with incremental doses of taxol over 16 weeks (B). TYW2 expression in A2780 cells treated with incremental doses of taxol over 16 weeks at the mRNA level (left) and protein (right) levels (C). [Data are presented as mean ± SD, *P< 0.05, **P < 0.01, Student's t-test.]
Knockdown of TYW2 caused decreased taxol-induced cytotoxicity
Consistent with findings described above, TYW2 knockdown HeLa cells (TYW2 KD cells) showed increased imG-14 levels (Figure 8A). Importantly, TYW2 knockdown significantly diminished the cytotoxic effects of taxol on these cells with the IC50 value increased from 28 nM in control to 178 nM in TYW2 KD (Figure 8B). Consistent with the cell viability results, the number of colonies formed in TYW2 KD cell was visually more than that of the control after exposure to taxol (Figure 8C). Together, these results strongly suggest a causal relationship between TYW2 expression and taxol resistance.
![Effects of TYW2 knockdown on the ImG-14 levels, cytotoxic potency of taxol in HeLa cells (A). [Expression of TYW2 was markedly decreased after knockdown while the imG-14 levels increased by 7-fold. Data are presented as mean ± SD, ***P< 0.001, ****P< 0.0001, Student's t-test]. The dose–response curves of the cytotoxic effects of taxol in control and TYW2 knockdown HeLa cells (B). [The IC50 value was significantly increased following TYW2 knockdown. Cell viability was measured after taxol treatment for 48 h by MTT assay. Data are presented as mean ± SD, **P< 0.01, Student's t-test]. Colony formation assay performed in 24-wells plates after taxol treatment demonstrating a decrease in taxol potency in TYW2 knockdown HeLa cells (C).](/dataresources/secured/content-1765762298978-5d4a4229-5d7a-4a1e-becc-9ea237dead1d/assets/gkaa1164fig8.jpg)
Effects of TYW2 knockdown on the ImG-14 levels, cytotoxic potency of taxol in HeLa cells (A). [Expression of TYW2 was markedly decreased after knockdown while the imG-14 levels increased by 7-fold. Data are presented as mean ± SD, ***P< 0.001, ****P< 0.0001, Student's t-test]. The dose–response curves of the cytotoxic effects of taxol in control and TYW2 knockdown HeLa cells (B). [The IC50 value was significantly increased following TYW2 knockdown. Cell viability was measured after taxol treatment for 48 h by MTT assay. Data are presented as mean ± SD, **P< 0.01, Student's t-test]. Colony formation assay performed in 24-wells plates after taxol treatment demonstrating a decrease in taxol potency in TYW2 knockdown HeLa cells (C).
DISCUSSION
In this study, multiple LC–MS approaches were applied to investigate the dynamic changes of tRNA modifications in taxol resistant cancer cells. It has been clearly demonstrated for the first time that (i) imG-14 is the predominant modification at the 37th position in tRNAphe of taxol resistant strains instead of OHyW in wild type strains; (ii) chronic exposure of A2780 cancer cells to taxol induced drug resistance, meanwhile suppressed TYW2 expression and interrupted the OHyW biosynthetic pathway leading to increased imG-14 and (iii) silencing of TYW2 is a cause of cellular resistance to taxol-induced cytotoxicity.
The most common feature of tRNAphe (GAA) across all three domains of life is that the nucleotide at the 37th position was a modified guanosine (46,48). Notably, modifications at this position showed chemical diversity in different species. Higher life forms present a more complex structure at this position according to the evolutionary scenario (49). In Archaea, the predominant modified guanosine was wyosine derivatives, such as imG-14, imG, imG2 and mimG, while wybutosine derivatives with complex structures are found in most eukaryotic organisms (46,48,49). In eukaryotes, the modification at the 37th position of tRNAphe shows more complex structure than those in Archaea. The tRNA modifying enzymes TYW4 and TYW5 which are responsible for formation of hypermodified wybutosine derivatives, such as OHyW in human, are absent in Archaea (47,50). The formation of wyosine or wybutosine derivatives is subjected to one or more enzymatic steps in a specific order. In Archaea, Taw3 and aTrm5a (Taw22) are responsible for the formation of imG and imG2, respectively, whereas the homolog of aTrm5a (Taw22) has not yet been found in eukaryotes (48). TYW3 which catalyzes the methylation of N7 of imG-14 and yW-86 in eukaryotes (48,49) is a homolog of Taw3 of yeast. This may be an explanation for imG formation in taxol resistant strains.
The function of TYW2 is to install the basic skeleton of wybutosine in tRNAphe via the transfer of the 3-amino-3-carboxypropyl group from S-adenosylmethionine (SAM) to the C7 position of imG-14 (50). The present results suggest that this process was blocked by chronic exposure to taxol (Figure 5). Alternatively, 3-amino-3-carboxypropyl group is also the metabolic substrates for 3-(3-amino-3-carboxypropyl) uridine (acp3U) formation (51). This might explain the upregulation of D[acp3U]AG in HeLa/T (Figure 1B). Based on the IC50 value, TYW2 expression, and imG-14 content in cancer cells (summarized in Table 2), chronic exposure to taxol induces the downregulation of TYW2 that leads to an increase in imG-14. This transformation is accompanied by an increase in IC50 values of taxol, i.e. a decrease its cytotoxic potency. It can be suggested that imG-14 level and TYW2 expression may be used as markers for taxol-resistance. The consequences of OHyW absence due to the absence of TYW2 should be elucidated in future works.
| Cells | TYW2 expression (fold change) | imG-14 (ng/106 cells) | IC50 of taxol (nM) |
|---|---|---|---|
| HeLa (wild type) | 100% | 0.013 ± 0.001 | 10.763 ± 1.198 |
| HeLa/T | 2.426 ± 1.544% | 4.650 ± 0.273 | 56560 ± 16760 |
| scrambled control | 100% | 0.011 ± 0.004 | 28.737 ± 22.618 |
| TYW2 knockdown | 34.387 ± 3.387% | 0.070 ± 0.011 | 178.533± 33.419 |
| A2780 (wild type) | 100% | 0.229 ± 0.062 | 341.901 ± 42.750 |
| HM-A2780/T (8 weeks) | 79.220 ± 1.861% | 0.535 ± 0.119 | 668.167± 65.586 |
| HM-A2780/T (16 weeks) | 57.018 ± 1.544% | 3.021 ± 0.120 | 1363.270 ± 361.822 |
| A2780/T | 3.019 ± 6.012% | 24.445 ± 2.869 | 7193.334 ± 3618.213 |
| A549 (wild type) | 100% | N.D | 23.511 ± 3.868 |
| A549/T | 0.298 ± 0.401 | 1.917 ± 1.047 | 4911.0347 ± 586.128 |
N.D: not detected.
Although several studies indicated that the reprogramming of tRNA modifications was correlated with chemotherapy resistance (17,22), the precise mechanism remains to be elucidated. The central finding of the present study that reprogramming of OHyW via downregulation of TYW2 is just such a mechanism in taxol resistance. Therefore, though speculative, such tRNA modifications might regulate cellular sensitivity towards taxol in the following ways: (i) frameshifting induced by changes of tRNA modifications, (ii) new functions of tRNA modification enzymes, and (iii) regulation by tRNA-derived fragments (tRFs).
tRNA modifications at the 37th position can enhance the stability of anticodon-codon interactions and prevent translational misreading from frameshift (12,52). Lack of m1G37 induced-frameshift has a huge impact on the growth of organisms and led to metabolic disorders (53–56). Consistently, loss of N6-threonylcarbamoyladenosine (t6A) at the 37th position has been reported to potentiate the sensitivity of yeast in response to multiple stresses (57). Several yeast strains with mutant alleles of the TEF2 gene may show +1 or –1 programmed ribosomal frameshifting and different reactions (sensitivity or resistance) to antibiotic agents (58). Importantly, m1G37 methylation of tRNApro reportedly affect gram-negative bacterial resistance to antibiotics through regulating drug efflux pump and membrane permeability barrier (59), reflecting that translational misreading might alter drug sensitivities. Although knockout of TYW2 has, as reported, no significant effect on the growth rate of yeast (60), it can increase frameshifting efficiency and frequency (61). The descending order of frameshifting frequency in yeast is G, m1G, imG-14 and yW (61). Extending from these findings, it may be inferred that the frameshifting efficiency of imG-14 in taxol resistant strains is theoretically higher than OHyW in wide type cells. Moreover, the latest study showed that loss of TYW2 increases the -1 programmed ribosome frameshifting frequency and is associated with poor survival in colorectal cancer patients (62). Taken together, TYW2 downregulation induced chemotherapy (taxol)-resistance may be another possible explanation for poor clinical outcomes in patients. Further studies are required to correlate frameshift and taxol-resistance.
Besides modifying tRNA, tRNA modification enzymes are also involved in other biological processes (63–65). For example, PUS10, which installs pseudouridine (Ψ) in the TΨC loop, can affect the expression of miRNA through promoting pri-miRNA processing (63). Additionally, tRNA methyltransferase 9 protein (trm9, a U34 modification enzyme) in yeast is related to resistance towards DNA damage (66). A human trm9-like protein inhibits tumor growth in vitro and in vivo by regulating LIN9 and HIF-1α (65). Resistance to MAPK therapeutic agents can be reversed by decreasing HIF-1α via silencing of U34 modification enzymes (22). Interestingly, high levels of TYW2 has been found in breast cancer and castration-resistant prostate cancer (67,68), whereas TYW2 related tRNAphe modifications were not reported to be different between normal mouse tissues and TYW2 overexpressing tumor tissues (47). To the best of our knowledge, TYW2 downregulation-induced taxol resistance is a novel finding, which may open a possible avenue to overcome acquired taxol-resistance in the clinical setting.
tRNA cleavage occurs in response to stress (69,70). Notably, tRFs generated by cleavage by various enzymes such as angiogenin possess distinct functions (71). Hypoxic stress-induced endogenous tRFs have been reported to inhibit the metastatic progression of breast cancer cells in a miRNA-like manner (72). tRNA modifications appeared to protect tRNA against stress-induced cleavages (73,74). Lack of m5C may promote tRF formation and enhance the sensitivity of tumors towards 5-FU (75). Information on tRFs in taxol resistant strains is lacking in the current literature. It is not clear whether or not depositions of imG-14 have an influence on tRF formation in response to taxol. On the other hand, reports have shown that miRNAs can promote or confer resistance to cancer therapy (76,77). Hence, it might be conceivable that tRFs such as tRFphe influence cancer cell susceptibility to drug therapy, perhaps, in a manner similar to those of miRNAs.
In summary, this is the first study which examines the association between tRNA modifications and taxol resistance employing tRNA profiling based on LC-MS. The results offer valuable insights into new mechanisms of chemotherapy resistance and potential mechanism by which drug resistance may be overcome. TYW2 expression and imG-14 level may be served as biomarkers of taxol-resistance. By this token, reprogramming of tRNA modifications should be emphasized in drug resistance study.
ACKNOWLEDGEMENTS
We thank Prof. Yong Liang and Dr Liang-Yong Xia of the Faculty of Information Technology, Macau University of Science and Technology for providing program for the development of in-house MS database. We also thank the Department of Science and Technology of Guangdong Province, China for the support of Guangdong-Hong Kong-Macao Joint Laboratory of Respiratory Infectious Disease.
SUPPLEMENTARY DATA
Supplementary Data are available at NAR Online.
FUNDING
Macao Science and Technology Development Fund [015/2017/AFJ].Macao Science and Technology Development Fund [015/2017/AFJ].
Conflict of interest statement. None declared.
Notes
Present address: State Key Laboratory of Quality Research in Chinese Medicine, Macau University of Science and Technology, Avenida Wai Long, Taipa, Macau, China.
REFERENCES
1.
2.
3.
4.
5.
6.
7.
8.
9.
10.
11.
12.
13.
14.
15.
16.
17.
18.
19.
20.
21.
22.
23.
24.
25.
27.
28.
29.
30.
31.
32.
33.
34.
35.
36.
37.
38.
39.
40.
41.
42.
43.
44.
45.
46.
47.
48.
49.
50.
51.
53.
54.
55.
56.
57.
58.
59.
60.
61.
62.
63.
64.
65.
66.
67.
68.
69.
70.
71.
72.
73.
74.
75.
76.