 UniPath: a uniform approach for pathway and gene-set based analysis of heterogeneity in single-cell epigenome and transcriptome profiles
Nucleic Acids Research


- Altmetric
Recent advances in single-cell open-chromatin and transcriptome profiling have created a challenge of exploring novel applications with a meaningful transformation of read-counts, which often have high variability in noise and drop-out among cells. Here, we introduce UniPath, for representing single-cells using pathway and gene-set enrichment scores by a transformation of their open-chromatin or gene-expression profiles. The robust statistical approach of UniPath provides high accuracy, consistency and scalability in estimating gene-set enrichment scores for every cell. Its framework provides an easy solution for handling variability in drop-out rate, which can sometimes create artefact due to systematic patterns. UniPath provides an alternative approach of dimension reduction of single-cell open-chromatin profiles. UniPath's approach of predicting temporal-order of single-cells using their pathway enrichment scores enables suppression of covariates to achieve correct order of cells. Analysis of mouse cell atlas using our approach yielded surprising, albeit biologically-meaningful co-clustering of cell-types from distant organs. By enabling an unconventional method of exploiting pathway co-occurrence to compare two groups of cells, our approach also proves to be useful in inferring context-specific regulations in cancer cells. Available at https://reggenlab.github.io/UniPathWeb/.
INTRODUCTION
Single-cell RNA sequencing (scRNA-seq) and single-cell open-chromatin profiling help us to decipher cellular heterogeneity of activity of coding and non-coding genomic elements (1,2). The heterogeneity in the activity of genomic sites among single-cells is regularly used to estimate cellular composition in complex tissue, spotting rare cells and understanding the role of genes and transcription factors (2,3). However, new questions are being asked with the increase in throughput of scRNA-seq and single-cell open-chromatin profiling through ATAC-seq (single-cell assay for Transposase-Accessible Chromatin using sequencing). One such question is, how can we use single-cell transcriptome and epigenome profiles for new applications. Can single-cell epigenome and expression profile help in finding co-occurrence between the activity of a pathway and lineage potency of a cell? Can single-cell heterogeneity be used in choosing more specific target pathways for cancer therapeutics? The answers to such questions can be found by representing cell state-space of meaning functional terms which could also provide perspective about its role and dynamic behavior. However, most often tools meant for estimating the enrichment of gene-sets like GSEA (4), use differential gene expression between two groups of cells, and such approach does not solve the purpose of studying heterogeneity of activity of pathways at single-cell resolution.
Another category of methods like SVA (5), RUV (6), scLVM (3) and f-scLVM (7) provide relevance score for known and unknown dominating factors for a group of single-cells. Such methods do not provide enrichment and relevance of gene-sets in each single-cell like PAGODA (8) and AUCell (9). Earlier methods for aggregation of gene-expression in gene-sets were designed for microarray-based expression profiles (10) which tend to have different distribution and low sparsity. Hence, PAGODA was designed to tackle issues of variable and high drop-out rate among single-cells for calculation of gene-set scores. However, PAGODA is very slow, and it is not designed to handle scRNA-seq data with a relatively less heterogeneous collection of cells (e.g. all cells of the same type). Whereas, AUCell has been primarily used for identification of cells with the activity of one or two gene-sets at a time and generally it is not used for other analysis-step for scRNA-seq profiles such as clustering and temporal ordering. The main hurdle in calculating enrichment of multiple pathways for each single-cell has been the default dependency on read-count data of genes. The read-count values in single-cell profiles are often zero due to true low expression (non-active regions) or dropouts. Dropouts are defined as undetected true expression (activity) due to technical issues. The statistical modelling of read-count of a gene (or genomic site) across multiple cells is a non-trivial task, especially for single-cell open-chromatin and scRNA-seq profiles due to variability in the dropout rate and sequencing depth among cells (8,11). Moreover, before this study, there has been rarely any attempt to estimate pathway enrichment-scores for single-cells using their open-chromatin profiles for downstream analysis like clustering and pseudo-temporal ordering. Hence, there has been a need for a uniform method which can transform single-cell expression and open-chromatin profiles from both homogeneous and heterogeneous samples to gene-set activity scores.
In this study, we have addressed the challenge of representing single-cells in terms of pathways and gene-set enrichment-scores estimated using scRNA-seq and open-chromatin profiles despite cell-to-cell variability in dropout of genomic regions and sequencing depth. Unlike previously proposed methods for scRNA-seq profiles, we do not try to normalize or scale read-count of a gene across cells using parametric distributions like Poisson or negative binomial. Scaling read-count across cells with variable dropout rate and sequencing depth increases chances of artefacts. Therefore, we use a common null model to estimate adjusted pathway enrichment scores while handling scRNA-seq profiles (Supplementary Figure S1). Similarly, while using scATAC-seq profiles, we use the approach of highlighting enhancers by dividing read-counts of genomic sites with their global accessibility scores (Supplementary Figure S1). We benchmarked our methods and null models for estimating single-cell gene-set enrichment using several published scRNA-seq and scATAC-seq datasets. We tried to explore how using pathway scores can improve temporal-ordering of cells. However, we found that there is bias in temporal-ordering methods towards using read-count and gene-expression directly. Hence, we developed a method to perform pseudo-temporal ordering of single-cells using their pathway scores and showed its utility in avoiding known covariates in the form of gene-sets. Further, we applied UniPath on different data-sets to achieve results which could not be found using gene-expression directly.
MATERIALS AND METHODS
Calculating Enrichment of gene-sets for scATAC-seq profiles
Most of the regulatory sites in a cell, like insulators and active promoters tend to have high chromatin accessibility in the majority of cell types. However, to estimate differences among single-cells using open chromatin profiles, sites with cell-type-specific activity like enhancers could be more useful. Moreover, enhancers profiles can provide a more clear perspective about active pathways in a cell. Therefore, UniPath first normalizes the read-count of scATAC-seq profiles of each cell to highlight enhancers. For multiple organisms like human, mouse and Drosophila, bulk sample chromatin accessibility is available for many tissues and cell types. For example, for Human hg19 genome, we combined DNAse-seq and ATACseq peaks from ENCODE and IHEC consortiums (12), to achieve more than 1 million sites and calculated accessibility scores of combined peak list (see supplementary methods). The accessibility score is calculated for a site as the proportion of cell types or samples in which it was detected as an open-chromatin peak.
For tag-count pij of a peak i in a single-cell j, the normalization is done as
where ε stands for a pseudo-count and is the global accessibility score for peak i. Thus, the method of highlighting enhancers using global accessibility score does not need any inter-cell tag-count normalization. Using global accessibility scores also makes it possible to have a uniform transformation of scATAC-seq read-count matrix from different scientific groups without re-calculating tag-counts using the aligned DNA fragments (bam or sam files) on a common peak-list.For every cell, the peaks having high normalized tag-count are selected and used as a set of positives (foreground) and the set of all peaks is used as background. Usually, we use a threshold of 1.25 above global accessibility score for choosing foreground peak, but it could vary depending on stringency needed. The chosen peaks in the positive set are highly likely to be enhancers and regulatory sites with cell-type-specific activity. Then for every peak, a most proximal gene within 1Mbp is found, and peaks which do not have any gene within 1Mbp is dropped. UniPath has an option for two statistical methods to estimate enrichment of gene-sets using foreground peaks, namely binomial and hypergeometric tests. With a binomial test, to calculate statistical significance (P-value) for a gene-set m whose genes appear proximal to km out of n peaks in foreground set, we use the formula:
Here, pm represents the probability of genes from the gene-set m to appear as proximal to peaks in the background list. With the hypergeometric test, the calculation of statistical significance (P-value) is done using the formula:
where Km is the number of times genes of gene-set m appears as proximal to peaks in the background, and N is the total number of peaks in the background set. As above km represents the number of times out of n foreground peaks, the proximal genes are from gene-set m.Normalization free Gene-set enrichment for single-cell expression
For estimating the significance of enrichment of pathway (gene-set) using scRNA-seq, we use the logarithmic value of the expression (FPKM, TPM, RPKM, UMI-count) of genes and treat every cell independently from each other. Thus unlike other published methods, we avoid creating artefacts which can happen due to the unresolved issue of estimating the distribution of tag-count of a gene across multiple samples (or cells) for normalization. As scaling and normalization across different cells can create artefacts due to a variable level of noise and gene dropout rate among them. Rather, we use the widely accepted fact that within a sample (cell) non-zero expression (FPKM, TPM and RPKM) values of genes follow approximately log-normal distribution (see Supplementary Figure S2). We treated UMI-counts as expression, as UMI-counts are independent of gene-length bias (13). We modelled the distribution of log (gene-expression) as bimodal such that one mode corresponds to genes with zero count and other mode correspond to a normal distribution for genes with non-zero expression. Thus probability distribution function (pdf) for log (expression) value x in a cell can be written as
where N (x; μ, σ) represent Gaussian pdf for genes with non-zero expression (FPKM, TPM, UMI-count) and I(x = 0) is the indicator function, whereas p0 represents a fraction of genes with zero expression-value. Here, the fraction of genes with zero expression-value represents both true low expression as well as dropout (undetected expression). The variables μ and σ represent the mean and standard deviation respectively of logarithmic values of only non-zero expression (FPKM, TPM, UMI-count) in a single-cell. Thus, for every cell, we use its own value of μ and σ to convert the log scale value of non-zero expression of a gene into P-value (right-tailed) assuming Gaussian distribution. The reason for the conversion of gene-expression value to P-value is that it gives an advantage of combining them using Brown's method that can be used for P-values derived using Gaussian distribution. Thus we combine P-values of genes belonging to a gene-set using Brown's method (14). Brown's method is meant to combine P-values which have a dependence upon each other. Using Brown's method the combined P-value for a gene-set with k genes with non-zero expression can be given bywhere such that Pi is the P-value of log(expression) of gene i in a sample/cell and is the cumulative distribution function for the chi-square distribution . Here, f is the scaled degree of distribution and is calculated as (14). The value of c in equation (5) is calculated asThis procedure leads to the calculation of combined P-value for each gene-set in every cell. Covariance between log-P-values of genes is calculated by using their values in all the cells in the same data-sets. In order to have robust estimate not affected by just one or two genes, we use a threshold of minimum five genes with non-zero expression to calculate a combined P-value for a gene-set. However, combined P-values could also have many unwanted effects from house-keeping genes, promiscuously enriched gene-set and multiple hypothesis testing. Hence, we corrected the P-values with a permutation-based test using a null model.
In order to make a null model, we first randomly chose cells from multiple studies so that we can have an equal representation of multiple cell-type. The scRNA-seq profiles of these studies (Supplementary table S5) were downloaded from recount2 database (15), which provides counts/expression on the same ensemble gene list. The ensemble gene ids were converted to official gene symbols. Those ensemble genes whose official symbol was not available were dropped from the list. We performed hierarchical clustering of cells using genes selected on the basis of the criterion of coefficient-of-variation (16). We choose highly variable genes based upon the coefficient of variation in each bin when the genes are binned according to their mean value across all cells. In other words, we chose 500 features only for hierarchical clustering while making null model. Using dynamic cutting of the hierarchical tree, we achieved clusters (or classes) of cells. We chose 1000 pairs of cells such that in a pair the cells belonged to different clusters in hierarchical clustering based result. It was done to ensure heterogeneity in the null model. For each pair, we took an average expression value for all gene. Thus, the null model consisted of 1000 expression vectors (false cells), each being average of gene-expression profiles of two cells. For every false-cell vector in the null model, the combined P-values of gene-sets were calculated using the method mentioned above. Thus, for every pathway (gene-set) we achieved 1000 P-values corresponding to the number of false-cells in the null model. For a pathway (gene-set) to calculate adjusted P-value in the target cell, we take the proportion of cells in the null model, which had lower combined P-value than the target cell.
UniPath's approach of temporal ordering of cells using pathway scores
Nearly all methods for temporal-ordering of single-cells use read-count or gene-expression directly, however, gene-set scores have the potential to avoid covariate effect and provide weightage to meaning full pathway activity. Therefore, we developed a novel temporal ordering method which can work efficiently using the pathway scores of single-cells. Our method first performs hierarchical clustering of cells before finding the order among the clusters of cells, followed by distance weighting and learning minimum spanning tree. Such approach is based on the observation made by Zhicheng and Hongkai that applying minimum spanning tree detection directly on raw distances among cells like monocle-1 (17) can lead to a false connection between cells due to noise or other bias (18). However, we do not follow Zhicheng and Hongkai's approach completely as it does not provide true ordering at single-cell resolution. Hence, we developed an approach, such that after initial clustering of cells using pathway scores, we shrink (or weight) distances among every cell pair based on their belonging-ness to the same class and using neighborhood index among their classes. To calculate neighborhood index among classes, we first find top k nearest neighbor for every cell. Then for every class, we count the number of times its cells have top k neighbors in other classes. For example, if cells in class A has total M neighbors in others classes out of which mb cells are from a class B then we calculate neighborhood index of A with B (A -<B) as mb/M. We shrink the distances between the cells in class A and class B by mb/M. After two stages of shrinkage of distances among cells, we use a shrinked-distance matrix to find a minimum spanning tree. We plot the minimum spanning tree using the netbiov R library (19). The minimum spanning tree drawn using our approach has fewer chances to be influenced by noise as the distances among cells are shrunk using consensus information.
Differential co-occurrence analysis
We use a permutation test to estimate the significance of the difference of pathway co-occurrence among two groups of cells. For a pathway pair, we first calculate the difference between spearman correlation values of their enrichment scores (adjusted P-value) in two groups of cells. We call it a true difference. We perform random-shuffling of group-labels of cells and calculate the difference in spearman-correlation of enrichment scores among two shuffled groups. Thus, for a pair of pathways, we make a collection of a set of false-difference in correlations using shuffled groups. The P-value is calculated as a fraction of false-differences which are greater than the true difference in term of absolute value. Notice that, here, we use spearman correlation of adjusted P-value (pathway score), not just the combined P-value of gene-sets. Using adjusted P-value increases robustness as it becomes rank based scores which helps in filtering out effect due to only one or two genes. Thus, if two pathways are correlated using their adjusted P-value, the correlation has less chance to be affected by only one or two genes or outliers.
EXPERIMENTAL METHOD
Single-cell expression profiling for non-small lung cancer cells
The source and culture condition for Tumour sphere (TS) and Adherent cells (Adh) are mentioned in Wang et al. (20). Tumor sphere (TS) line derived from lung cancer patient were maintained in medium with DMEM/F12 (US Biomedical), 4mg/ml Bovine Serum Albumin (Sigma), Non-essential amino acids, sodium pyruvate (Life Technologies) and 20 ng/ml Epidermal Growth Factor, 4 ng/ml bovine Fibroblast Growth Factor and Insulin – Transferrin Selenium (Sigma).
Tumour sphere derived adherent (Adh) cells were grown in the same media as above, without EGF, bFGF, ITS and BSA. For Adh cells, media was supplemented with 10% fetal bovine serum.
RNA extraction, library construction, sequencing for NSCLC cells
NSCLC single-cells in suspension were dissociated using trypsin and loaded into C1 96 well-integrated microfluidic chip (IFC) as per manufactures guidelines. The single-cells were captured in C1 96 (large size) IFC using Fluidigm-C1 system. The captured single-cells were imaged using auto imaging fluorescent microscope to identify the viable single-cells and to omit the doublets. The reverse transcription and cDNA pre-amplification reagents were prepared using SMART-seq2 protocol and loaded into the IFC. Later, reverse transcription and cDNA amplification were processed using SMART-seq2 script automatically in C1-Fluidigm machine. After harvesting cDNA from C1 chip, the samples were quantified using picogreen assay and normalized to the range 0.2–0.3 ng/μl. The quality of the cDNA product was verified using high sensitivity DNA assay in Agilent bio-analyzer machine. The harvested single-cell cDNA was barcoded in 96 well plate using Nextera XT Library Prep kit (Illumina). Uniquely barcoded libraries from single-cells pooled together and sequenced using a HiSeq-Hi-output-2500 sequencer (Illumina). In total, there were 87 TS cells and 75 Adh cells.
RESULTS
For transforming scRNA-seq profiles to pathway scores, we treat each cell separately. Generally, in a single-cell, RPKM (read per Kilobase per million) or FPKM (fragment per kilo per million) value of genes have a bimodal distribution, where one of the modes is around zero, and other is for non-zero expression values. We used widely and theoretically accepted assumption that most of the time, non-zero RPKM and FPKM values within a sample (or cell) follow log-normal distribution (21). For a single-cell, we convert non-zero expression values (FPKM, RPKM, TPM, UMI-counts) of genes to P-values (right-tailed) using log-normal distribution (see Materials and Methods). UMI-counts do not need to be divided by gene-length to calculate gene-expression values (13); hence we use log-transformed UMI-counts to calculate P-values. The assumption of log-normal distribution for non-zero gene-expression values for a cell also has support from a report by Furusawa et al. (22) on the ubiquity of log-normal distributions in intra-cellular reaction dynamics. Moreover, skewed distributions often fit log-normal (23), which is also reflected by quantile–quantile (q–q) plots for FPKM, TPM and UMI-counts shown in Supplementary Figure S2. We apply Brown's method to combine P-values of genes in a gene-set to reduce the effect of covariation among genes (see Materials and Methods). The combined P-value for every gene-set is adjusted using a null background model made using a systematic approach (see Methods, Supplementary Figure S1A). The objective of P-value adjustment using a null model created by Monte-Carlo approach (see Methods) is to highlight cell-type-specific gene-set activity and reduce blurring due to background house-keeping function of cells. We call the adjusted P-value of a pathway (or gene-set) in a single-cell as its score.
Evaluation of UniPath's approach of transforming single-cell expression profiles to pathway enrichment scores
Due to the lack of gold standard, it is not trivial to assess gene-set enrichment methods for heterogeneous bulk samples. However, for single-cell from known cell-lines, the marker gene-set for cell-types can be used directly to test methods like UniPath. We used marker gene-sets for cell-types to compare our approach with existing methods PAGODA (8) and AUCell meant for scRNA-seq and GSVA (24). Systematic evaluation using scRNA-seq profiles from 10 studies (see Supplementary Table S1) revealed that most of the time UniPath was better than PAGODA, AUCell and GSVA in terms of estimating enrichment of gene-sets for correct cell-type as one among top 5 enriched terms (see supplementary methods). (Figure 1A, Supplementary Figure S3, Supplementary Table S1, Additional File 1). Notice that the purpose of using cell-type marker gene-set was to evaluate the correctness of enrichment of gene-sets for downstream analysis steps of clustering and temporal-ordering. To further clarify, we made a collection of gene-sets of non-immune related pathway terms, and as spike-in, we added two known gene-sets related to B cell. We also added two gene-set associated with T cells to the same collection (see Supplementary Table S2). We checked in what fraction of cells both relevant terms appeared in the top 5 enriched terms (supplementary methods, Figure 1B). With this control experiment for both B cell (25) and T cell (26), UniPath revealed the correct respective pathways in top 5 enriched terms with substantially better accuracy than PAGODA, AUCell and GSVA (Figure 1B, Supplementary Figure S4A, B). To have a further unbiased test, we used GSEA (4) to make reference list of significantly enriched gene-sets (FDR < 0.2) in the group of T cells w.r.t other cell types using mouse cell atlas (27) data-set. We used the reference gene-set as a list of positives for T cell to evaluate UniPath and other three methods in terms of their presence in the top 10 terms in every single T cell (supplementary methods). UniPath had a substantially higher level of presence of reference gene-sets (positives) among 10 term enriched terms in comparison to PAGODA, AUCell and GSVA (Figure 1B). Repeating the same experiments for B cells, we found similar results, highlighting the fact that UniPath is indeed superior in estimating cell-type-specific enrichment for gene-sets in single cells.


Evaluation of UniPath using scRNA-seq and scATACseq profiles. (A) Accuracy of highlighting correct marker gene-set in top enriched terms. The evaluation was performed using both homogeneous and non-homogeneous data-sets (Supplementary Table S1). Supplementary Figure S3 has more such examples. (B) Accuracy of results of pathway enrichment by UniPath and other three methods for B and T cell scRNA-seq profiles. For systematic evaluation, two figures are shown corresponding to two lists of gene-set. Sub-figures on top are made using a list consisting of non-immune pathways and two pathways (positives) relevant to T cell and other two gene-set for B cells (bar-plot). The figure below (box-plot) was made using a list of all gene-sets, but positives were decided independently based on GSEA applied to relevant cell types (T or B cell) in mouse cell atlas data-set. The count of positives in top 10 enriched terms in every cell is shown. (C) Consistency of UniPath based pathway-scores when B cells are grouped with epithelial or T cells in comparison to PAGODA. Gene-set enrichment scores provided by PAGODA change when the same cell is grouped with other cells. While UniPath's output remains consistent. (D) Evaluation of UniPath for highlighting correct gene-sets among top enriched term for single-cell ATAC-seq profile. Results are shown here for scATAC-seq profile of B cell (GM12878) and Monocyte. Here UniPath used global accessibility scores to highlight enhancers. (E) Consistency of UniPath based pathway enrichment score calculation using scATAC-seq. Here hematopoietic progenitor cells are grouped with B cells or monocytes. UniPath's approach of highlighting enhancers by using global accessibility score gives a more consistent result than mean based normalization (local accessibility score). Consistency allows uniform comparison and horizontal scalability.
We also assessed the consistency of enrichment of pathways by UniPath and the other three methods (PAGODA, AUCell, GSVA). We analyzed B cells (GM12878) scRNA-seq profile (28) while grouping them each time with different cell types. The scores for pathways and gene-sets from PAGODA and GSVA were not consistent (see Figure 1C, Supplementary Figure S4C–E) and for every cell, the output was dependent on the composition of cell type in the data-set. However, UniPath and AUCell based enrichment scores for a cell remains consistent and is not affected by other neighbouring cells (Figure 1C, Supplementary Figure S4C–E). Thus, UniPath also resolves the issues of highlighting correct gene-sets and relevant pathways with consistency for each single-cell irrespective of the level of heterogeneity of cell-types in the provided scRNA-seq data.
Gene-set enrichment with UniPath as an alternative dimension-reduction method for single-cell ATAC-seq profile
For the transformation of open chromatin profile of single-cells to pathway enrichment scores, UniPath first highlights enhancers by normalizing read-count on peaks using their global accessibility scores (Supplementary Figure S1B) (see Materials and Methods). For this purpose, it intersects peak list of given scATAC-seq profile with a pre-compiled list of genomic regions with pre-calculated global accessibility scores. The global accessibility score of a genomic site is proportional to the number of times it appeared as a peak in available bulk open-chromatin profiles. (see Materials and Methods). The motivation behind normalizing read-count of each peak using its global accessibility score is to have consistency and avoid adjustment of variability in sequencing depth and dropout rate. For every cell, genomic sites with high normalized read-count are chosen as foreground set. Then, for every cell, UniPath uses proximal genes of peaks in its foreground set to estimate statistical significance (P-value) of enrichment gene-sets using Hypergeometric or Binomial test. We call the P-value of enrichment of a pathway or gene-set as its score. We performed systematic evaluation using cell-type marker gene-set for both bulk ATAC-seq of -immune cells (29) and multiple single-cell ATAC-seq profiles (30,31). Most of the time, UniPath highlighted correct cell type among top 5 enriched gene-set for both bulk and single-cell ATAC-seq profiles (Figure 1D, Supplementary Figures S5 and S6). Making a global list of peaks with accessibility score is possible due to the availability of bulk open-chromatin profiles. In the absence of enough publicly available open-chromatin profiles for any species, one can also use UniPath by calculating local accessibility score (study-specific normalization). However, local accessibility scores are dependent on the composition of cells in the data-set and could lead to inconsistency in estimation of enrichment of gene-sets (shown in Figure 1E). Thus, UniPath calculates consistent and mostly correct enrichment scores for pathway and gene-sets for every cell using its scATAC-seq profile independently.
Handling dropout and batch effect and evaluation using visualization and clustering
Most often in single-cell scRNA-seq profile, there is heterogeneity in dropout rate among cells. Such dropout of genes could be random or systematic. The systematic dropout usually occurs due to differences in sequencing depth or RNA degradation level (frozen versus fresh) among different batches of samples. We tested whether UniPath is robust to systematic dropout variability among cells. We first simulated the systematic dropout rate using publicly available scRNA-seq data-sets (17,32) (Figure 2A) (see Methods). We found that applying PCA on raw read-count (or gene-expression) lead to artefactual cluster formation due to systematic dropout. Whereas, using UniPath based pathway scores, similar cells remained in the same cluster irrespective of the pattern in dropout rate (Figure 2A, Supplementary Figure S7A). When t-SNE scatter plot (Supplementary Figure S7B) was used to visualize scRNA-seq profile with 10% systematic simulated drop-out, UniPath based pathway scores provided robust results and similar type of cells grouped together. Whereas for the same data and gene-set, results from other similar methods (PAGODA, AUCcell, GSVA) showed an artefactual cluster for cells with systematic drop-out (Supplementary Figure S7B).
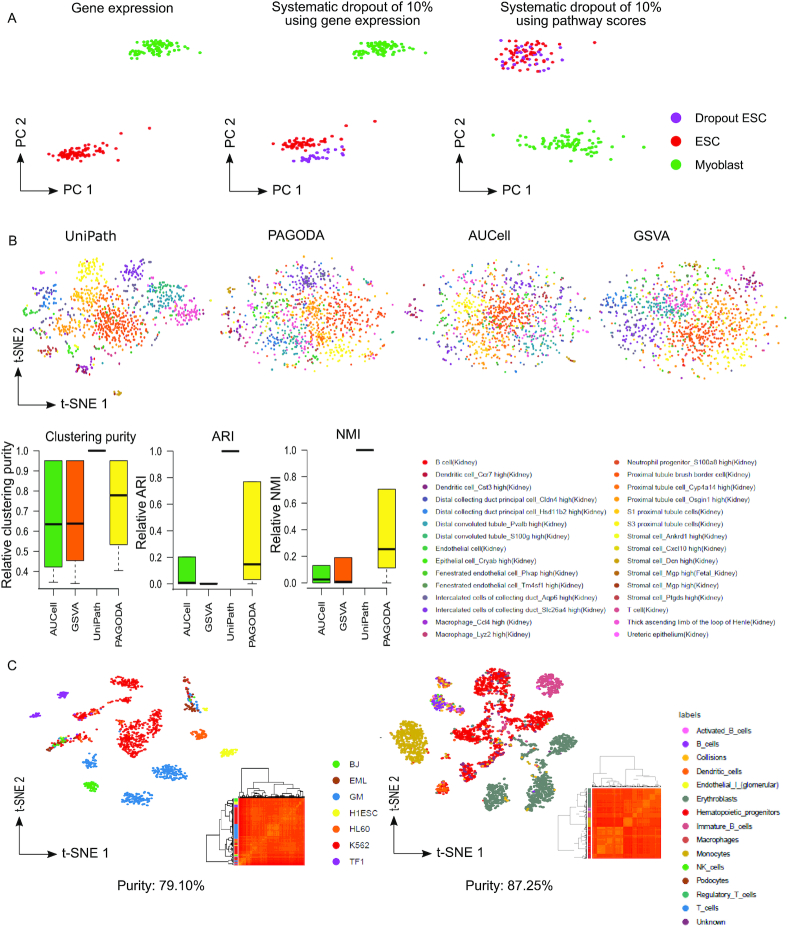
Reduction of the artefact by UniPath and clustering using pathway scores. (A) Principal component analysis (PCA) based visualization of data consisting of human embryonic stem cells (hESC) and Myoblast cells scRNA-seq profile. Here PCA was done using scRNA-seq based gene expression. Simulation of systematic dropout of 10% genes in few hESCs leads to the formation of a separate group of hESCs in PCA based visualization of raw gene expression. However, PCA based visualization using pathway score from UniPath shows a grouping of all ESCs in same cluster irrespective of systematic dropout. Similar results with original data-set from frozen sample is shown in Supplementary Figure S7. (B) t-SNE based visualization of scRNA-seq profiles after transformation to pathway scores for cells in the kidney from mouse cell atlas. Here, UMI-counts were used for calculating gene-set scores. The boxplot show efficiency of clustering at different values of ‘eps’ parameter of dbscan method. Three types of clustering efficiency quantification (clustering purity, adjusted rand index and normalized mutual information) are shown here. Actual cell-type annotations were used for calculating the clustering efficiency values which were then scaled relative to the corresponding value for UniPath at same ‘eps’ parameter in dbscan method. Thus only relative clustering-purity,relative-ARI and relative-NMI values are shown here. (C) Clustering purity of scATAC-seq profiles transformed into pathway space. Scatter plots of t-SNE coordinates for cells represented by pathway scores based transformation of scATAC-seq datasets (Cusanovish et al. (60) and Buenrostro et al. (30)) are shown here.
We further used an original data-set with systematic bias (drop-out) where scRNA-seq profiling was done for microglia using fresh cells and nuclei isolated from frozen tissue (33). Using only gene-expression based visualization with t-SNE, showed separate grouping of expression profiles from frozen cells. Even while using highly variant feature (genes) frozen cell profiles clustered together as a separate group in t-SNE plot. However, in t-SNE scatter plot made using UniPath's gene-set score, the expression profile of microglial cells from fresh and frozen sample showed high overlap (Supplementary Figure S7C–E). Besides being robust to systematic dropout, UniPath also allows correction for strong technical batch effect before calculating the adjusted P-value for the enrichment of pathways (see supplementary methods and Supplementary Figure S8A) using available tools. The framework of UniPath avoids normalization artefact due to sequencing depth and dropout rate; therefore, it could be used for efficient clustering of single-cell. During hierarchical-clustering, UniPath based gene-set scores provided comparable clustering-purity to raw expression based results (28,32) (Supplementary Figure S8B–D). Thus, for normal data-sets using genes-expression directly could provide comparable visualization and clustering purity, however, when there is systematic bias (such as frozen samples) UniPath-score is more useful than raw gene-expression for avoiding artefactual clusters.
We further compared visualization and clustering using pathway scores from 4 different methods for scRNA-seq profiles. We used t-SNE based visualization and performed dbscan (34) based clustering of t-SNE coordinates (supplementary methods). We tried using different values for eps parameter (for the radius of the neighbourhood) in dbscan. However, for almost all values of eps parameter of dbscan, UniPath based pathway scores provided better clustering purity. UniPath based clustering results also had higher values for adjusted rand Index (ARI) and normalized mutual information (NMI) than other three methods (PAGODA, AUCell, GSVA) (Figure 2B and Supplementary Figure S9). Due to better visualization and clustering, we found meaningful sub-groups of stromal cells in an organ (Uterus) in mouse cell atlas only while using UniPath scores (see Supplementary Figure S9C and supplementary information).
When hierarchical clustering was performed using pathway scores of imputed scATAC-seq profiles, it resulted in high clustering-purity (Figure 2C). We also compared visualization and clustering of scATAC-seq profiles with the outputs of two other tools (ChromVar and SCALE) (35) (36) which are used for handling scATAC-seq count but not for finding enrichment of gene-set. UniPath based pathways scores for imputed scATAC-seq profiles provided better or comparable visualization and clustering when compared to the output of ChromVar and SCALE (Supplementary Figure S10). Thus high accuracy in clustering with gene-set enrichment scores, proves that defining cell-states in terms of pathway enrichment using UniPath can also be a reliable method for classifying single-cell epigenome and transcriptome data-sets.
Pseudo-temporal ordering using pathway enrichment scores and visualizing the continuum of lineage potency and pathway co-occurrence
Pathway-scores based representation can provide new similarity measures among cells as well as help in avoiding few covariates like cell-cycle phase, tissue-microenvironment or culture conditions. However, current methods for temporal ordering (37) of cells are designed mainly to handle FPKM and read-counts of genes. Hence, we extended UniPath with a novel method for the pseudo-temporal ordering of single-cells which can utilize pathway scores based representations. For temporal ordering, we apply two levels of shrinking of distances between cells based on their pre-clustering and continuum among their classes before finding a minimum spanning tree (MST). To find a continuum between different classes, we use KNN based approach after initial clustering so that correct temporal ordering among clusters of cells can be determined (see methods). Without shrinkage of distances using pre-clustering and KNN based continuum, the MST could not capture correct temporal order in few cases (see Supplementary Figure S11A, B). Overall, we found that UniPath is indeed able to predict approximately correct order of cells using pathway scores derived from scATAC-seq and scRNA-seq profiles (see Figure 3 and Supplementary Figure S11).
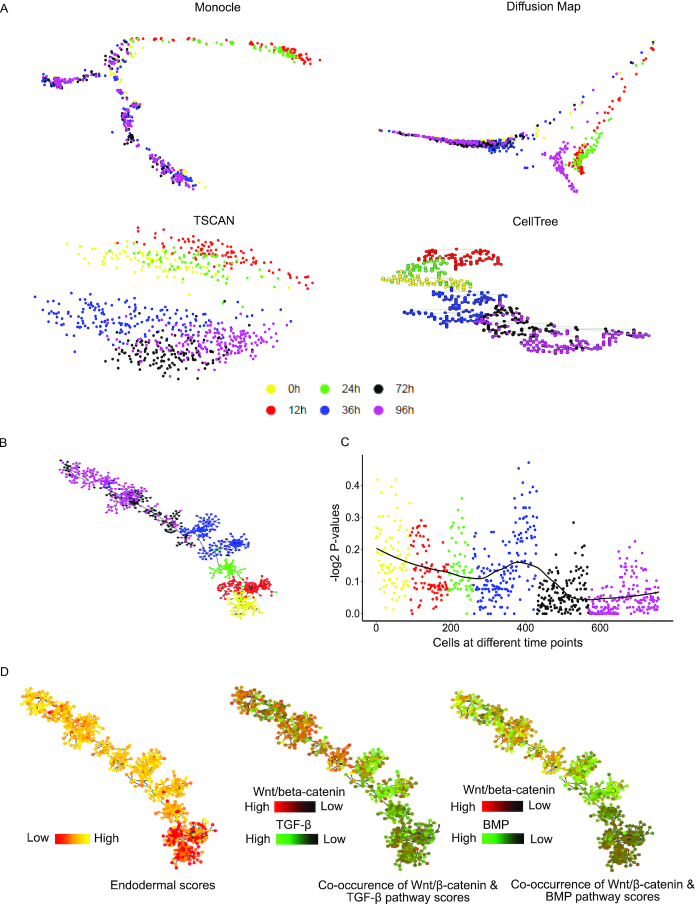
Pseudo temporal ordering using gene-set enrichment scores and visualization of potency and pathway co-occurrences. The dataset used here, consisted of cells collected at different time points (0,12, 24, 36, 72 and 96 h) of differentiation of human embryonic cells (hESC, 0 h) towards definitive endoderm (DE) (32) (96 h). (A) Imperfect prediction of temporal order using gene-expression by other tools. Monocle mixed 0 hours (hESCs) and 96 DE hours cells, Diffusion map also mixed 0 hour cells with 72 hours. TSCAN could not find a proper order in the sequence of 0, 12, 24, 36, 72 and 96 h, cellTree also could not find a proper temporal order among cells (B) Predicted temporal order of cells of differentiating human embryonic stem cells towards definitive endoderm. The order predicted is exactly according to true time-points of cells. (C) The enrichment score of gene-set for S phase in cells at different time points of differentiation. (D) The trend of endoderm lineage potency and co-occurrence of pathways at single-cell resolution on the temporally ordered tree of cells. The endodermal lineage gene-set score increases as the cells differentiate towards endoderm. In another plot, showing Wnt/beta-catenin and BMP pathway scores reveal that at mesendodermal stage at 24 and 36 hours, the BMP signaling pathway seems to be more enriched compared to WNT/beta-catenin, which is coherrent with previous reports (61). After 36 hours enrichment level of WNT/beta-catenin shows a slow increase towards the end of the temporally ordered tree.
We further used UniPath for temporal ordering of scRNA-seq profile of Human embryonic stem cells (hESC) and their differentiated states collected at time points of 0, 12, 36, 72 and 96 h during differentiation towards definitive endoderm (DE) (Figure 3) (32). Using other tools (monocle, TSCAN, DiffusionMap, CellTree) (17,18,38,39) for pseudo-temporal ordering with gene-expression (Transcript per million, TPM) matrix (Figure 3A), resulted in predicting wrong order of cells for the same data-set. However, with UniPath, when we dropped gene-set associated with cell cycle, we achieved the correct order of cells. We found that the score of gene-set for cell cycle (S phase is shown here) is higher at 0 and 12 h, possibly due to a high level of proliferation (Figure 3C). The S phase gene-set score kept decreasing as the cells differentiated towards endoderm (Figure 3C). However, at 36 h, we find two batches of cells such that one batch of cells had a much lower score of cell-cycle (S phase here) gene-set than the other. Such batches of cells hint about the possible impact of cell-cycle as a covariate during the prediction of temporal order. Besides handling known covariates, UniPath can also be used to visualize continuum of lineage potency and concurrence of two pathways on pseudo-temporally ordered tree (Figure 3D) (see methods). UniPath also enables analysis of co-occurrence pattern and detection of clusters of pathways which can be used to infer context-specific regulation (Supplementary Figures S12 and S13, supplementary information). Overall, UniPath tends to be beneficial for predicting correct temporal order of cells and making inference about stage-specific co-occurrence of pathways during differentiation of cells.
Enabling analysis of large atlas scale scRNA-seq data-set using pathway enrichment scores
The consistency due to the use of global null models by UniPath provides horizontal scalability in calculating scores for pathways for single-cells. Even with a single CPU, the computation time needed by UniPath is much less than PAGODA and GSVA on the same number of cells (Supplementary Figure S14A). The horizontal scalability, speed and consistency of UniPath allowed us to transform expression profiles (UMI-counts) of more than 61000 single-cells from mouse cell atlas (MCA) dataset (27), by dividing them into smaller groups of cells. We selected 49507 cells which have >800 genes with non-zero expression value (see supplementary methods). Further, t-SNE (40) based dimension reduction of pathway scores and subsequent application of dbscan (34) (Additional file 2), revealed a correct grouping of most of the cells according to their tissue (Figure 4A, Supplementary Figure S14B). As expected, some cells did not group with their source tissue cluster, but they formed a separate class. Such as immune cells from different organs grouped together in clusters 13, 14, 15 (see Figure 4A, Additional file 2).
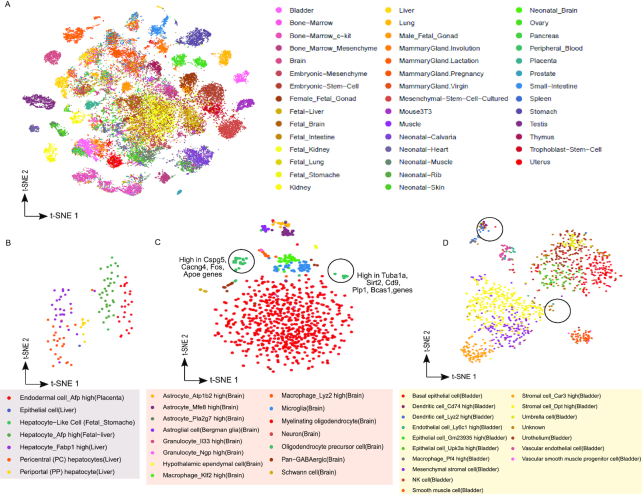
Analysis of atlas scale single-cell RNA-seq data-set using pathway scores. (A) Scatter plot of t-SNE results for 49507 cells of mouse cell atlas (MCA) data-set (27) represented using pathway scores. The transformation of MCA data-set to pathway enrichment scores was possible due to consistency and scalability provided by UniPath. The clusters detected using t-SNE output for MCA data-set are shown in Supplementary Figure S14B. For MCA data-set UMI-counts were used by UniPath to calculate pathway scores. (B) t-SNE scatter plot of cells co-clustering in cluster number 40. AFP high placenta endodermal cells and Afp+ hepatocytes do not overlap, but they lie closer to each other in t-SNE based plot. (C) t-SNE base scatter plot using pathway scores of cells from mouse brain. It shows two clusters of oligodendrocyte precursor cells along with their enriched genes. These two clusters of cells were labelled as a single cell-type in the original study by Han et al. (27) which relied on using raw gene-expression/read-count directly. (D) t-SNE based scatter plot for bladder cells in MCA data-set represented in terms of pathway enrichment scores. Two clusters of cells labelled as ‘unknown’ were visible. Cells in one of the two clusters were identified as cd74_high_dendritic cells.
Surprisingly, co-clustering of few non-immune cells from different tissues revealed convergence which has been rarely reported before by single-cell analysis but is supported by earlier scientific studies. Such as in our analysis, cluster 40 has Afp+ fetal liver hepatocytes as well as Afp+ placental endodermal cells which were reported to belong to different classes in the original study of MCA. Cluster 40 also has a few Fabp1+ hepatocytes. It has been previously shown, that placenta-derived multipotent cells (PDMCs) with the expression of Afp (see Figure 4B) gene, has endodermal features and can differentiate easily towards hepatocytes like cells (41). We compared both types of cells (Afp+ placental endodermal cells and Afp+ fetal liver hepatocyte) in cluster 40 with other cells in MCA. Among top 50 pathways more enriched in Afp+ placental endodermal cells (from cluster 40) 22 were also present in 50 most differentially upregulated pathways in hepatocytes cells of cluster 40 (additional files 3 and 4). These common 22 pathways (44% overlap) were mostly related to lipid metabolism (see Supplementary Table S3). However, there was certainly a difference between hepatocytes and Afp+ placental endodermal cells of cluster 40 in t-SNE based visualization. (Figure 4B).
Another example of convergence is cluster 3, which has virgin mammary gland luminal-epithelial cells (including alveoli cells) and glandular epithelial cells from uterus. An interesting example of convergence is cluster 52, that has Col10a1+ and Cmnd+ bonemarrow mesenchyme stromal, pre-osteoblast and chondrocytes cells. It is well-known that bonemarrow mesenchyme stromal (also known as mesenchymal stem cells (42)) has a high potency to transform to pre-osteoblast and chondrocytes cell state (43). In contrast to such a result, Cxcl1+ MSC from in vitro culture grouped with trophoblast stem cells in cluster 21. It can be noticed, that the cell types from different organs, converging in a major cluster, did not overlap completely with each other but formed their own sub-cluster within their major class (Figure 4B). However, the convergence to a major class shows a reduction of covariates due to underlying tissue microenvironment in gene-set scores, which caused cells with a similar state to group together. Overall UniPath, provided a new dimension to cluster cells and revealed that even though an organ has a specific type of cells for its functioning, it also has some cells with a regulatory state similar to cell-types from other parts of the body.
Revealing new minor classes using pathway scores and annotation of unlabeled cells
Feature extraction in terms of pathway scores can help to reduce noise, sparsity and effect of few covariates. Hence, it can help to highlight clusters of cells which might not get detected by using raw read-counts. Such as analysis using pathway scores of brain cells in MCA data-set, resulted in the detection of a new cluster among oligodendrocyte-precursor cells. Oligodendrocyte precursor cells belonging to the new small cluster had a higher expression for Tuba1a, Sirt2, Cd9, Plp1 and Bcas1 (Figure 4C). These genes are involved in the differentiation of oligodendrocyte-precursor toward mature oligodendrocytes (44–47). On the same trend, we found two new clusters of ‘unknown’ cells from the bladder in MCA data-set (Figure 4D). We could annotate cells in one of the newly detected clusters in the bladder as Cd74_high dendritic cells. Thus, UniPath based analysis could highlight a few groups of cells which were not found in the original study relying only on using read-count directly. We also made an attempt to annotate a few un-annotated cells as described in the supplementary material (Supplementary Figure S14C, additional file 5).
Application in inferring context-specific regulation in cancer cells
We further explored how UniPath can help in for studying context-specific regulation in cancer cells which is often required for precision oncology. Recently Wang et al. (20) showed a difference in metabolic profile among two types of NSCLC cell lines, non-adherent tumorspheres (TS) grown in serum-free culture conditions and adherent (Adh) cells cultured in serum-containing medium. They have demonstrated a high level of the tumorigenic potential of non-adherent TS cells in comparison to adherent ones using mouse xenograft models. We performed single-cell expression profiling of 162 cells out of which approximately half were TS cells, and others were Adh cells (see Materials and Methods). After applying UniPath, the differential enrichment analysis using Wilcoxon Rank sum test revealed GPCR ligand binding gene-set (Figure 5B), IL23 pathway, cytochrome_P450_drug_metabolism and phenylanine metabolism as having higher enrichment in TS cells (based on median fold change and Wilcoxon Rank-sum P-value < 0.05, Figure 5B) (additional File 6). Distributions and gradient of some pathways in TS and Adh cells are shown in Supplementary Figure S15B. GPCR. IL23 signaling are known to be associated with plasticity and proliferation of NSCLC (48–50). Cytochrome P450 is also involved in promoting tumor development (51).
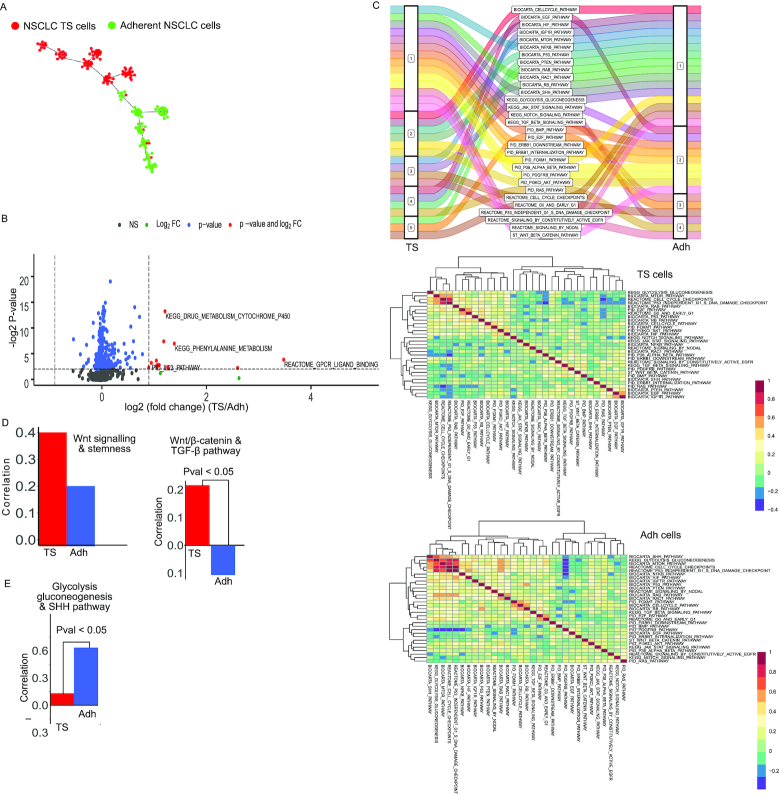
Differences in enrichment and co-occurrence of pathways in two types of cells of non-small cell lung cancer (NSCLC). FPKM values were used for estimating gene-set enrichment scores by UniPath. (A) Pseudo-temporal ordering of lung cancer cells using pathway scores. The tumor sphere (TS) cells and Adherent cells (Adh) are shown with different colors. (B) A global view of differential enrichment of pathways using volcano plot. (C) Change in co-enrichment of pathways, from TS to Adh cells is shown in alluvial plot. For more detail, heatmaps of correlation between pathways are shown with their hierarchical cluster in TS and Adh lung cancer cells. (D) Correlation values of WNT signaling pathway with gene-set of stemness in TS and Adh cells are shown as a bar plot. The other bar-plot shows co-occurrence of WNT/beta-catenin with TGF-beta signaling pathways in Adh and TS cell lines. WNT/beta-catenin and TGF-beta had significant differential co-occurrence among TS and Adh. (P-value < 0.05) (E) Spearman correlation of scores of Gycolysis_Gluconegenesis pathway with sonic hedgehog pathway (SHH) pathway in TS and Adh cells. The P-value of differential co-occurrence is also shown.
We further used an approach, rarely used for scRNA-seq. We performed co-occurrence and differential co-occurrence analysis for pathway and gene-set pairs. Wnt pathway had the highest correlation with stemness gene-set in TS cells. However, in Adh cells, Wnt was not among top correlated pathways with stemness gene-set. We found that Wnt/beta-catenin pathways had a significantly higher correlation with the TGF-beta pathway in TS in comparison to Adh cells (P-value < 0.05, Jaccard index = 0, see Supplementary Table S4). However, TGF-beta pathway itself did not have a significant difference in enrichment among TS and Adh cells (Supplementary Figure S15A). Both Wnt/beta-catenin and TGF-beta are known to promote the state of epithelial to mesenchymal transition (EMT) in cancer cells which is associated with high tumorigenicity (52). Moreover, it has been previously shown that simultaneous over-activation of Wnt/beta-catenin and TGF-beta signaling promotes tumorigenicity and chemo-resistance in NSCLC cells (53). Using hierarchical clustering of 31 chosen pathways, we found that TGF-beta, Wnt/beta-catenin and PDGFRB pathways co-clustered together in TS cells. In contrast, in Adh cells WNT/beta-catenin pathway grouped with ERBB1 and PI3K1 signaling. The difference in co-occurrence pattern of Wnt/beta-catenin pathway in TS and Adh cells (Figure 5C-D) and prior knowledge about the effect of their co-stimulation with TGF-beta in NSCLC hints about a possible cause of higher tumorogenicity in TS cells.
Wang et al. (20) also reported that glycolytic intermediates are more enriched in Adh cells. Our analysis revealed that among non-metabolic gene-sets, sonic hedgehog (SHH) pathway had the highest level of differential co-occurrence (P-value < 0.05, Jaccard index = 0) with glycolysis gene-set (Supplementary Figure S15C). SHH and glycolysis pathway had a correlation of 0.63 in Adh cell compared to -0.138 in TS cells (Figure 5E). SHH pathway is known to be promoting glycolysis in multiple types of cancer (54). In our hierarchical clustering result (Figure 5B), SHH pathway also seems to group with cell-cycle related gene-sets which hints about its involvement in the regulation of proliferation in Adh cells. Previously SHH pathway has been associated with proliferation and drug-resistance in NSCLC (55). However, our analysis reveals that its role is context-specific, and it could have a more dominating role in Adh like NSCLC cells compared to TS cells. Similarly, many more such differences could be revealed among Adh and TS cells. However, our analysis here is meant to show that UniPath can help in building relevant hypothesis and help researchers in designing follow-up study of context-specific regulation in cancer cells.
DISCUSSION
Exploiting single-cell heterogeneity using pathways and gene-set enrichment can give rise to multiple new applications. UniPath fills the gap between the demand for consistent gene-set enrichment scores for a multitude of applications and the availability of single-cell transcriptome and open-chromatin profiles. The novel approach of processing each cell independently, using a global null model provides consistency and scalability to UniPath for calculating gene-set enrichment. Such approach of UniPath also provided independence of normalization w.r.t other cells which is needed to handle cell-to-cell variability in noise, dropout rate and sequencing depth. UniPath is robust to systematic dropout as well as it can handle batch effect in scRNA-seq profiles. Compared to other similar methods (PAGODA, AUCell and GSVA), UniPath based pathway scores provided better visualization and clustering accuracy for both UMI and non-UMI based scRNA-seq profiles. Thus, UniPath's approach of approximating the distribution of UMI-count of scRNA-seq to log-normal can provide a satisfactory result.
For both scRNA-seq and scATAC-seq profiles, there is a similarity in the downstream procedures after the transformation to gene-set enrichment score. Thus, UniPath provides a uniform platform for analyzing both single-cell transcriptome and open-chromatin profiles with the new dimension of pathway enrichment scores. For better performance of UniPath on scATAC-seq profiles, it is advisable to perform imputation using other tools (56). Overall, UniPath also provides an alternative solution to transform more than one scATAC-seq read-count matrices to same feature space, despite differences in their peak list.
Due to the effect of cell-cycle or micro-environment, the expression of every gene is influenced slightly. Such subtle underlying covariate could influence down-stream analysis using raw-gene expression directly. However, when we take scores of the smaller set of genes (like pathways) we give more weightage to covariance due to grouping of genes (or functional similarity) which tend to overwhelm the underlying covariate effect due to cell-cycle or micro-environment. Therefore, UniPath based approach is successful in suppressing such covariates using temporal ordering and clustering. Clustering of MCA data-set using pathway scores revealed few clusters in which one of its member cell-type could be easily differentiated to the other. Such as cluster 40 having Afp+ placental endodermal cells and fetal liver hepatocyte (41) and cluster 52 with bonemarrow mesenchyme stromal, pre-osteoblast and chondrocytes cells (43). Such results hint that biologist could use UniPath to find convergence and feasibility of convertibility between different cell-types.
We have shown 3 results obtained through UniPath, which could not be achieved by using gene-expression directly. Those results are 1) Mixing of fresh and frozen sample scRNA-seq profiles in t-SNE based visualization 2) correct temporal ordering of differentiating hESC cells 3) co-clustering of cells from distant tissues which were not reported by original study relying on using gene-expression directly. The estimate of pathways and gene-sets enrichment scores by UniPath can provide a meaningful representation of underlying heterogeneity among cells. Such as while analysing Chu et al. data-set, we found a bimodal distribution of enrichment for few pathways at 36 h (Supplementary Figure S12A). In Chu et al. data-set, at 36 h, cells are in mesendodermal stage and start differentiating towards definitive endoderm. Such bimodal distribution of pathway scores could provide a meaningful representation of underlying regulatory states involved in bifurcation and decision about the fate of cells. The pathway scores calculation using UniPath also opens an avenue for new ways of analysis which is not allowed while using gene-expression directly. Such new ways of analysis are (i) estimating co-occurrence among pathways and finding clusters of co-regulated pathways and (ii) calculating differential co-occurrence among two pathways to compare two groups of cells. UniPath based analysis of differentiating hESC towards DE revealed patterns of cooccurrence of Nodal pathway with other pathways (SMAD2, Wnt/beta-catenin) which are corroborative with existing literature (see Supplementary Methods, Supplementary Figure S12).
Using the null model to estimate the significance of cooccurrence of two pathways allows the prediction of changes in their co-enrichment across multiple groups of cells. Such analysis could prove very useful to link deregulation of a given pathway to a disease-associated gene-set in a target cell-type. Using a similar approach for NSCLC, we could estimate cooccurrences and differential co-occurrences of few pathway pairs, which had literature support (such as TGF-beta and Wnt/beta-catenin; SHH and glycolysis). Last but not least, the generalized statistical framework of UniPath makes it future-proof such that it can be easily adapted for spatial transcriptome based on single-cell expression profiling (57) and other open chromatin profiles such as scDNASE-seq (58) or SNARE-seq (59).
ETHICS DECLARATIONS
We used a previously characterized LC32 cell lines derived from resected primary non-small-cell lung cancer (NSCLC) adenocarcinoma samples.
IMPLEMENTATION AND DATA AVAILABILITY
UniPath is implemented using R and is available at https://reggenlab.github.io/UniPathWeb/
As well as at https://github.com/reggenlab/UniPath
The FPKM data for single-cell RNA-seq for lung cancer cells is available with UniPath package.
The raw sequences of the lung cancer single-cell RNA-seq profile is available is GEO id: GSE156138.
ACKNOWLEDGEMENTS
Author contributions: V.K. and D.S. designed the study, W.L.T. helped in designing study related to cancer cells. V.K. and S.C. wrote the code and the manuscript. S.C. and V.K. also executed the code on data-sets for generating results and figures. S.S. and S.L.K. prepared the library for single-cell RNA-seq of lung-cancer cells. Z.Wang and W.L.T. cultured non-small cell lung cancer cell-line and provided information about cultured cells and their behavior. Z.Wu did validation of results on lung-cancer cell lines.
SUPPLEMENTARY DATA
Supplementary Data are available at NAR Online.
FUNDING
YIG Grant [BMRC/YIG/1510851023 to V.K.] by BMRC, A-STAR, Singapore. Funding for open access charge: Institutional Internal Grant.
Conflict of interest statement. None declared.
REFERENCES
1.
2.
3.
4.
5.
6.
7.
8.
9.
11.
12.
13.
14.
15.
16.
17.
18.
19.
20.
21.
22.
23.
24.
25.
26.
27.
28.
29.
30.
31.
32.
33.
34.
35.
36.
37.
38.
39.
40.
41.
42.
43.
44.
45.
46.
47.
48.
49.
50.
51.
52.
53.
54.
55.
56.
57.
58.
59.
60.