 The transcriptional repressors VAL1 and VAL2 recruit PRC2 for genome-wide Polycomb silencing in Arabidopsis
Nucleic Acids Research


- Altmetric
The Polycomb repressive complex 2 (PRC2) catalyzes histone H3 Lys27 trimethylation (H3K27me3) to repress gene transcription in multicellular eukaryotes. Despite its importance in gene silencing and cellular differentiation, how PRC2 is recruited to target loci is still not fully understood. Here, we report genome-wide evidence for the recruitment of PRC2 by the transcriptional repressors VIVIPAROUS1/ABI3-LIKE1 (VAL1) and VAL2 in Arabidopsis thaliana. We show that the val1 val2 double mutant possesses somatic embryonic phenotypes and a transcriptome strikingly similar to those of the swn clf double mutant, which lacks the PRC2 catalytic subunits SWINGER (SWN) and CURLY LEAF (CLF). We further show that VAL1 and VAL2 physically interact with SWN and CLF in vivo. Genome-wide binding profiling demonstrated that they colocalize with SWN and CLF at PRC2 target loci. Loss of VAL1/2 significantly reduces SWN and CLF enrichment at PRC2 target loci and leads to a genome-wide redistribution of H3K27me3 that strongly affects transcription. Finally, we provide evidence that the VAL1/VAL2–RY regulatory system is largely independent of previously identified modules for Polycomb silencing in plants. Together, our work demonstrates an extensive genome-wide interaction between VAL1/2 and PRC2 and provides mechanistic insights into the establishment of Polycomb silencing in plants.
INTRODUCTION
Polycomb group (PcG) proteins constitute a global and evolutionarily conserved transcriptional repression system that is essential for growth and development in multicellular organisms ranging from plants to humans (1,2). PcG proteins assemble into several types of multi-protein chromatin-modifying complexes to confer repressive histone modifications and compact chromatin at target loci (1,3–7). The two main types of Polycomb complexes are Polycomb repressive complex 1 (PRC1) and PRC2. PRC2 catalyzes trimethylation at H3 lysine 27 (H3K27me3), whereas PRC1 catalyzes H2A lysine 119 ubiquitination (1,5–8). The two complexes are intimately linked, and their combined activities are essential for Polycomb-mediated gene silencing (7–9). The failure of the establishment and/or maintenance of H3K27me3 at Polycomb target loci leads to derepression of the transcriptional activity of genes at developmental stages when they should be silenced (7,10).
Despite the importance and conservation of the Polycomb machinery, how it recognizes its target loci is still not fully understood. In Drosophila, PRC2 is recruited by transcription factors to cis-elements, so-called Polycomb Response Elements (PREs) (2,8). In mammals, PRC2 preferentially occupies hypomethylated CpG-rich regions, which have been implicated in PRC2 recruitment (1,5–8). Recently, several PRE-like elements have been identified in the model flowering plant Arabidopsis thaliana. A cis-element in KNOX homeobox genes that is bound by transcription factor ASYMMETRIC LEAVES directly recruits the PRC2 complex to maintain repression (11). The repressive LEC2 element (RLE), a cis-element at LEAFY COTYLEDON2 (LEC2), also facilitates H3K27me3 deposition (12). Two transcription factors, BASIC PENTACYSTEINE 1 (BPC1) and ARABIDOPSIS ZINC FINGER1 (AZF1), recruit the PRC2 subunit FERTILIZATION INDEPENDENT ENDOSPERM (FIE) to a subset of PcG target loci via recognition of a GA repeat and Telobox motif, respectively (13–16). Moreover, telomere-repeat-binding factors (TRBs) bind to Telobox motifs and recruit the PRC2 catalytic subunits SWINGER (SWN) and CURLY LEAF (CLF) to some Polycomb targets (17,18).
Recent studies have suggested that the transcription factor VIVIPAROUS1/ABI3-LIKE1 (VAL1) and its homolog VAL2 are involved in Polycomb silencing in Arabidopsis (19–23). VAL1 and VAL2 are DNA-binding B3 domain proteins that were initially identified as serving an essential role in the transition from embryonic to vegetative growth by repressing seed maturation genes (21,24–31). VAL1 interacts with AtBMI1A and AtBMI1B, the components of plant PRC1, to initiate H2A lysine 121 ubiquitination (H2A121ub) at several seed maturation genes (30). VAL1 binds to the RY element (CATGCA/TGCATG) via its B3 domain (20–23,32,33), and mutation of the RY element in the first intron of the floral repressor FLOWERING LOCUS C (FLC) leads to decreased H3K27me3 accumulation at FLC (22,23). Furthermore, val1 val2 mutant seedlings show a reduction in H3K27me3 deposition at FLC (22,23). VAL1 physically associates with SAP18, a member of the SIN3-histone deacetylase complex, and with LIKE HETEROCHROMATIN PROTEIN 1 (LHP1), a putative member of plant PRC complexes, to mediate Polycomb silencing at the FLC nucleation region during vernalization (22,23). However, due to the lack of genome-wide analysis concerning the role(s) of VAL1 and VAL2 in controlling H3K27me3 distribution, it has been unclear whether these two proteins broadly underpin Polycomb silencing at the whole-genome level. Furthermore, how they are connected with the deposition of H3K27me3 at target loci is not fully resolved. Finally, the relationship between the RY element and previously reported plant PREs in mediating H3K27me3 deposition remains undetermined.
In this study, we report an extensive genome-wide interaction between VAL1/2 and PRC2. We show that VAL1 and VAL2 physically interact with SWN and CLF, co-localize with SWN and CLF on chromatin, and recruit PRC2 complexes for H3K27me3 deposition at a subset of PcG target loci. Epigenomic profiling reveals that the genome-wide distribution of H3K27me3 deposition partly depends on VAL1 and VAL2, because the loss of VAL1 and VAL2 leads to a spatial redistribution of H3K27me3. Finally, genome-wide analysis suggests that the VAL1/VAL2-RY regulatory system functions largely independently of the TRB–Telobox and BPC1/AZF1–GA repeat/Telobox modules for PRC2 Polycomb silencing in plants. Together, our data provide important mechanistic insights into the establishment of Polycomb silencing in plants.
MATERIALS AND METHODS
Plant materials and growth conditions
Loss-of-function mutants of VAL1 (val1; SALK_088606) (24,34), VAL2 (val2; SALK_059568) (24,34,35), SWN (swn-4; SALK_109121) (34,36), and CLF (clf-29; SALK_021003) (34,36) were obtained from the Arabidopsis Biological Resources Center (ABRC). pSWN:SWN-GFP swn-4 and pCLF:CLF-GFP clf-29 was previously described (36). Fully matured seeds were sterilized and stratified at 4°C in darkness for three days, which were then sown on Murashige and Skoog (MS) plates containing 1% sucrose and 0.6% agar. Seedlings were grown in growth rooms with 16-h light/8-h dark cycles at 22°C. Homozygous transfer DNA (T-DNA) insertion mutants were identified by PCR-based genotyping. Primers are listed in Supplementary Table S1.
Plasmid constructs and plant transformation
To construct the pVAL1:VAL1-GFP and pVAL2:VAL2-GFP plasmid, a 6,969 bp VAL1 genomic fragment (including a 3,151 bp region upstream of the start codon and 3,818 bp genomic region without stop codon) and 8,209 bp VAL2 genomic fragment (including a 4,545 bp region upstream of the start codon and 3,664 bp genomic coding region) were amplified by PCR and subcloned into the pDONR221 vector (Invitrogen) using BP reaction. After confirmation by Sanger sequencing, the pVAL1:VAL1 and pVAL2:VAL2 sequence in pDONR221 were subcloned into the pMDC107 vector (37) by LR reaction to obtain pVAL1:VAL1-GFP and pVAL2:VAL2-GFP. The primers used for generating the constructs are listed in Supplementary Table S1. The pVAL1:VAL1-GFP and pVAL2:VAL2-GFP constructs were introduced into Agrobacterium tumefaciens GV3101, which were used to transform val1 and val2 plants by the floral dipping method, respectively (38). The seeds harvested from the transformed plants were screened on MS medium containing 30 μg/ml hygromycin and 100 μg/ml Carbenicillin. The transgenic plants were confirmed by PCR genotyping. Homozygous transgenic lines were selected from the T3 generation.
RNA isolation and RNA-seq library preparation
Total RNA was isolated from 100 mg of 14-day-old seedlings using the RNAprep pure Plant Kit (Tiangen) according to supplier's instruction. Total RNA was treated with RNase-free DNase I (Life Techologies). Three independent biological replicates for each sample were included.
DNA-free total RNA was used for the Illumina Tru-seq library preparation according to the manufacturer's instruction. RNAs from three biological replicates were sequenced separately at Novogene, using Illumina Hiseq X-Ten.
RNA-seq analysis
For RNA-seq, reads were mapped to the TAIR10 Arabidopsis genome using TopHat v2.0.4 with default settings. The number of sequencing reads in each of the samples is summarized in Supplementary Table S2. Differentially expressed genes were identified as described previously (39). In brief, mapped reads were assembled according to TAIR10 version of genome annotation using cufflinks (40) (version 2.1.1) with default settings. The assembled transcripts from three independent biological replicates in WT and other mutants were included and compared using Cuffdiff (40) (version 2.1.1) with default settings. Genes with at least a 2-fold change in expression (|Fold Change| ≥ 1, FDR < 0.05, P < 0.05) between mutant and WT were considered to be differentially expressed.
The raw RNA-seq data of 14-day-old Polycomb-group mutants (atbmi1a atbmi1b, atring1a atring1b, clf, swn, lhp1) were downloaded from Gene Expression Omnibus (GEO; see URLs) under accession number GSE67322 (41), and of 14-day-old swn clf were downloaded from GEO under accession number GSE108960 (36).
To explore the relationships in transcriptomic changes among different mutants, the fold change of mutant/WT was used for further hierarchical clustering analysis using Cluster 3.0 and Java TreeView programs (42) and for Principal Component Analysis (PCA) using ClustVis (see URLs) (43). To calculate the significance of the overlap of two groups of genes, the total number of genes in the Arabidopsis genome used was 34,218, according to EnsemblPlants (27,655 coding genes and 6,56 non-coding genes).
ChIP-seq and ChIP-seq library preparation
ChIP experiments were carried out as described previously (44–48) with minor modifications. Briefly, 14-day-old seedlings grown on MS plates were cross-linked with 1% formaldehyde for 10–20 min under vacuum and ground into fine powder in liquid nitrogen. The chromatin was isolated and sheared into ∼200–600 bp fragments using the Bioruptor® sonicator with a 30 s ON and a 30 s OFF cycle (total ON cycles: 27) at HIGH setting. The sonicated chromatin was incubated with 10 μl of anti-GFP (Abcam, cat. no. ab290), 2 μl of anti-H3K27me3 antibody (Millipore, cat. no. 07-449), or 2 μl of Histone H3 (Abcam, cat. no. ab1791) at 4°C overnight. The MinElute PCR Purification Kit (Qiagen, cat. no. 28004) was used to recover the precipitated DNA.
ChIP-qPCR was performed with three biological replicates, and the results were calculated as the percentage of input DNA according to the Champion ChIP-qPCR user manual (SABioscience). Quantitative PCR was performed with a Roche LightCycler 480 Real-time PCR Instrument using the SYBR Green Realtime PCR Master Mix (Toyobo) in a volume of 10 μl. The primers used for ChIP-qPCR are listed in Supplementary Table S1.
For ChIP-seq, two nanograms of ChIPed DNA were used to construct the ChIP-seq library, and two biological replicates for each sample were sequenced. The concentration of ChIPed DNA was estimated using a Qubit 3 fluorometer (ThermoFisher Scientific). End repair, adapter ligation and amplification were performed using NEBNext Ultra II for DNA Library Prep (E7645S), and NEBNext® Multiplex Oligos for Illumina® (E7335L). DNA was purified using VAHTS DNA Clean Beads (Vazyme, cat. no. N411-02). High-throughput sequencing was carried out by the Illumina Novaseq (Sequencing method: Hiseq-PE150).
ChIP-seq data analysis
ChIP-seq data were analyzed as previously described (44–48). Briefly, the raw reads were mapped to the Arabidopsis genome (TAIR10) (49) by Bowtie2 with default mismatch parameters. Duplicated reads were removed using Picard tools. Only perfectly and uniquely mapped reads were retained for further analysis. A summary of the number of reads for each sample is given in Supplementary Table S3. Pearson correlation analysis was computed using the deepTools (50) to determine the correlation between biological replicates (Supplementary Figure S1). MACS2 (51) was employed to identify enriched regions (peaks) using parameters ‘gsize = 1.35e8, bw = 300, q = 0.05, nomodel, extsize = 100’). The common peaks found in both replicates were retained for further analyses. The peaks were converted to bigwig files using bamCoverage program with ‘-bs 50,–normalizeUsing RPGC’ in deepTools (50), which were imported into the Integrative Genomics Viewer (IGV) (52) for visualization. The width of each peak was determined by MACS2. ChIPSeeker (53) was used to assign peaks to proximal genes. A peak summit that was positioned within 3 kb upstream or 3 kb downstream of a TSS was assigned to that gene. If multiple genes could be assigned to a peak, the closest TSS was selected. If no TSS was found in this window, the peak was left unassigned.
To identify DNA motifs, the sequences surrounding each peak summits (peaks got from MACS2) (200 bp upstream and downstream, respectively) were extracted using ‘getfasta’ function in bedtools program (54) and searched for enriched DNA motifs using the MEME-ChIP software suite (55), with default settings. P value was calculated by the Fisher's Exact Test from the DREME program in MEME-ChIP.
ComputeMatrix and plotProfile programs were used to compare the mean SWN, H3K27me3 or H3 level at defined loci between WT and val1 val2. The H3K27me3-positive regions in WT was defined as H3K27me3-marked regions. Based on overlapping with VAL1/2 or not (at least 1bp overlap), H3K27me3-marked regions were divided into VAL1/2 enriched-H3K27me3 regions and H3K27me3-only regions. The SWN peaks were also classified into VAL1/2 enriched-SWN regions and SWN-only regions. The MAnorm program was applied to characterize the quantitative changes in H3K27me3 or SWN enrichment levels in val1 val2 compared with WT (56).
The correlations between ChIP-seq datasets in Figure 2B were tested with the Genome Association Tester (GAT) (57) algorithm, which was implemented in WebCAT (see URLs). GAT is a permutation approach in which overlaps between the fragments in each dataset are tested against 100 permutations of the same datasets across the genomic coordinates. Enrichment scores were calculated with the formula: log2(observed overlap/expected overlap) × –log10(P value) and are displayed as a heat map.
To analyze the correlation of the loss of H3K27me3 with the RY element hit per kb, the number of the RY element was calculated using motifscan program applied to a 1,000-bp window centered at the H3K27me3 peak summit (17). To search for candidate motif in given DNA sequences, the program scanned them with a window of the same length as the motif, and defined raw motif score of the sequence S in window as the ratio of the probability to observe target sequence S given the motif's Position Weight Matrix (PWM) M and the probability to observe S given the genome background B. For each annotated motif, the motifscan program modeled the genome background distribution of motif score by randomly sampling the genome for 106 times, and defined the targets of this motif as those candidates whose motif score was higher than the cutoff. The multicov program in Bedtools was used to count alignments at the regions with altered H3K27me3 in val1 val2 (54).
Gene ontology (GO) analysis was performed by using the web-based gene ontology (see URLs) (58) with the default settings. The Venn diagrams were generated using webtool Venny 2.1 (see URLs). The Hypergeometric test was performed using webtool (see URLs). The total number of genes is 34,218 in Arabidopsis genome TAIR 10. The lists of SWN-, CLF-, TRB1-, AZF1-, BPC1-target genes in young seedlings were previously published (14,17,36).
Yeast two-hybrid assays
Yeast two-hybrid assays were performed according to the manufacturer's instructions for the Matchmaker GAL4-based two-hybrid system 3 (Clontech). The VAL1 and VAL2 cDNAs excluding termination codons were subcloned into the pGADT7 vector, whereas SWN and CLF-N cDNA were subcloned into the pGBKT7 vector. CLF-N overcomes the growth defects caused by full-length CLF (14). All paired constructs were co-transformed into yeast strain AH109 by the lithium acetate method, and yeast cells were grown on a minimal medium/-Leu-Trp. Transformed colonies were plated onto a minimal medium/-Leu/-Trp/-His/-Ade to test for possible interactions. Primers are listed in Supplementary Table S1.
Bimolecular fluorescence complementation
The full-length coding sequences of VAL1 and VAL2 were fused in frame with the coding sequence for a C-terminal EYFP fragment in the pEarleyGate201-cEYFP vector, respectively (59). SWN and CLF were fused with the coding sequence for an N-terminal nEYFP fragment in pEarleyGate202-nEYFP (35). The constructs were introduced into A. tumefaciens strain GV3101 individually, and the resulting bacteria were used to infiltrate the lower epidermis of tobacco (Nicotiana benthamiana) leaves (60). After 36–48 h, the fluorescence signals were visualized using a confocal microscope (LSM880 with Fast airy scan). FUSCA3 (FUS3)-nEYFP and FRIGIDA (FRI)-cEYFP were used as negative controls. Three biological replicates were performed for the BiFC experiments. In each replicate, the ratio of EYFP positive cells was calculated among 500 cells. Primers are listed in Supplementary Table S1.
Coimmunoprecipitation (Co-IP) assay
Full-length SWN (pSWN:SWN) genomic sequence without stop codon was amplified and introduced into the pZPY122-3FLAG vector to generate pSWN:SWN-3FLAG, which was introduced into pVAL1:VAL1-GFP val1 plant using the floral dipping method. Primers are listed in Supplementary Table S1. Co-IP assays were conducted as previously described (22). Total proteins were extracted from around 4 g of 14-day-old seedlings expressing SWN-3FLAG and VAL1-GFP, and subsequently precipitated with anti-FLAG magnetic beads (Biomake, cat. no. B26101). SWN-3FLAG and VAL1-GFP were detected by western blotting using anti-FLAG (Sigma-Aldrich, cat. no. A8592) and anti-GFP (Abcam, cat. no. ab290), respectively.
To generate p35S::VAL1-3FLAG, p35S::VAL2-3FLAG, p35S::SWN-3HA and p35S::CLF-3HA constructs, the full-length cDNAs of VAL1, VAL2, SWN and CLF were obtained by PCR amplification and subcloned into pHB-3FLAG and pHB-3HA vectors (61). Subsequently, the four constructs were introduced into Agrobacterium tumefaciens strain GV3101 and infiltrated into tobacco (Nicotiana benthamiana) as described previously (60). Co-IP assay was performed as described (35). Two days after infiltration, tobacco leaves were harvested and ground in liquid nitrogen. Proteins were extracted in an extraction buffer (50 mM Tris-HCl, pH 7.4, 150 mM NaCl, 2 mM MgCl2, 5 mM DTT, 20% glycerol and 0.1% Nonidet P-40) containing protease inhibitor cocktail (Roche). Cell debris was pelleted by centrifugation at 13,000 g for 12 min. The supernatant was incubated with 10 μl of anti-FLAG magnetic beads (Biomake, cat. no. B26101) at 4°C for 2 h. Then, the beads were centrifuged and washed four times with a washing buffer (50 mM Tris–HCl, pH 7.4, 150 mM NaCl, 2 mM MgCl2, 5 mM DTT, 10% glycerol and 0.1% Nonidet P-40). Proteins were eluted with 40 μl of 2× sample buffer and analyzed by immunoblotting using anti-FLAG (Sigma-Aldrich, cat. no. A8592), anti-HA (Sigma-Aldrich, cat. no. H6533) or anti-ACTIN (Sangon Biotech, cat. no. D191048) antibody.
Immunoblotting
Proteins were resolved on 4–12% protein gels (GenScript, SurePAGE, Cat. no. M00653) and detected by anti-GFP (Abcam, cat. no. ab290, Lot#GR3196305-1), anti-HA (Sigma-Aldrich, cat. no. H6533), anti-FLAG (Sigma-Aldrich, cat. no. A8592), anti-ACTIN (Sangon Biotech, cat. no. D191048) and anti-H3 (Proteintech, cat. no. 17168-1-AP). The intensities of blotting signals were quantified by using ImageJ software.
Statistical analysis
Statistical test methods, sample sizes and P values are indicated in the corresponding figure legends. P values for the Venn diagram overlap analysis are based on hypergeometric tests.
URLs
GEO Gene Expression Omnibus, https://www.ncbi.nlm.nih.gov/geo/;
WebCAT, https://www.biotools.fr/CAT/webCAT/;
MA-norm, http://bioinfo.sibs.ac.cn/zhanglab/MAnorm/MAnorm.htm;
THE GENE ONTOLOGY (GO), http://geneontology.org/;
Venn diagrams, http://bioinfogp.cnb.csic.es/tools/venny/;
Hypergeometric test, http://nemates.org/MA/progs/overlap_stats.html;
Ensemble, http://plants.ensembl.org/index.html;
TAIR, https://www.arabidopsis.org/;
Picard tools, http://broadinstitute.github.io/picard/;
Cluster 3.0 and Java TreeView, http://bonsai.hgc.jp/∼mdehoon/software/cluster/;
ClustVis, https://biit.cs.ut.ee/clustvis/;
Motifscan, https://github.com/shao-lab/MotifScan;
MEME-ChIP, http://meme-suite.org/tools/meme-chip.
RESULTS
The val1 val2 mutant has a similar phenotype and transcriptome to the swn clf mutant
Although val1 or val2 single mutant seedlings grown on MS medium appeared to be indistinguishable from the wild-type (WT) controls (Supplementary Figure S2), ∼43.4% of val1 val2 double mutant seedlings developed embryonic calli that formed somatic embryos after a long period of growth under our growth conditions (Figure 1A and Supplementary Figure S2) (24,27). This val1 val2 phenotype partly resembles that of the swn clf double mutant (62) (Figure 1A).

![The phenotype of val1 val2 is similar to that of swn clf. (A) val1 val2 and swn clf double mutants develop somatic embryonic calli. Seedlings were grown on MS medium for 50 days. (B) Heatmaps displaying hierarchical clustering of differentially expressed genes among 14-day-old val1 val2 and various PcG mutants. Red and blue represent up- and down-regulation in mutants, respectively. (C) Principal component analysis (PCA) showing that the transcriptome of the val1 val2 mutant is similar to that of the swn clf mutant (36). (D) Scatter plots showing a positive correlation of up- and down-regulated genes between val1 val2 and swn clf mutants. The line of best fit is shown in red, with adjusted R value indicated. (E) Venn diagrams showing the overlap of up- or downregulated genes between val1 val2 and swn clf mutants. The P values were calculated by hypergeometric tests. (F) Metagene plots of H3K27me3 levels in the wild type (WT) at genes commonly up- or down-regulated in val1 val2 and swn clf (36). All annotated genes were also included. RPGC, reads per genomic content (1 × normalization). Plotting regions were scaled to the same length as follows: 5′ ends (–2.0 kb to transcription start site [TSS]) and 3′ ends (transcription termination site [TTS] to downstream 2.0 kb) were not scaled, and the gene bodies were scaled to 5 kb.](/dataresources/secured/content-1765762427410-6f64cace-5c2d-4e8e-80fd-a276c653fb6d/assets/gkaa1129fig1.jpg)
The phenotype of val1 val2 is similar to that of swn clf. (A) val1 val2 and swn clf double mutants develop somatic embryonic calli. Seedlings were grown on MS medium for 50 days. (B) Heatmaps displaying hierarchical clustering of differentially expressed genes among 14-day-old val1 val2 and various PcG mutants. Red and blue represent up- and down-regulation in mutants, respectively. (C) Principal component analysis (PCA) showing that the transcriptome of the val1 val2 mutant is similar to that of the swn clf mutant (36). (D) Scatter plots showing a positive correlation of up- and down-regulated genes between val1 val2 and swn clf mutants. The line of best fit is shown in red, with adjusted R value indicated. (E) Venn diagrams showing the overlap of up- or downregulated genes between val1 val2 and swn clf mutants. The P values were calculated by hypergeometric tests. (F) Metagene plots of H3K27me3 levels in the wild type (WT) at genes commonly up- or down-regulated in val1 val2 and swn clf (36). All annotated genes were also included. RPGC, reads per genomic content (1 × normalization). Plotting regions were scaled to the same length as follows: 5′ ends (–2.0 kb to transcription start site [TSS]) and 3′ ends (transcription termination site [TTS] to downstream 2.0 kb) were not scaled, and the gene bodies were scaled to 5 kb.
Previous analyses have suggested that VAL proteins associate with AtBMI1 to mediate the transition from embryonic to post-germination growth (30), and that VAL1 interacts with LHP1 to repress FLC transcription (22,23). We compared the val1 val2 transcriptome (Supplementary Dataset S1) with those of PRC mutants (36,41). Hierarchical clustering and principal component analysis (PCA) revealed that atring1ab and atbmi1ab, both are loss of function mutants in PRC1 components, had similar transcriptome (Figure 1B and C). The transcriptomes of lhp1, clf, and swn clustered together and were close to val1 and val2 single mutants, while the transcriptome of val1 val2 double mutants was closest to that of swn clf double mutants (Figure 1B and C). The transcriptome changes of val1 val2 and swn clf mutant were positively correlated (correlation coefficient R2 = 0.75; Figure 1D). Among the 3,848 genes that were upregulated and the 3,110 genes downregulated in val1 val2 mutants, a substantial number, 1,540 (expected, 404; observed/expected, 3.8; P = 0) and 1,649 (expected, 305; observed/expected, 5.4, P = 0), respectively, exhibited the same direction of misregulation in swn clf mutants (Figure 1E). The 1,540 genes commonly upregulated between val1 val2 and swn clf mutants were marked by a high level of H3K27me3 in WT (observed: 673, expected: 308, P = 6.18e–86), whereas the 1,649 genes commonly downregulated had a low level of H3K27me3 (observed: 257, expected: 330, P = 1.23e–6) compared with the genome-wide H3K27me3 level (Figure 1F and Supplementary Figure S3). Gene Ontology (GO) terms related to plant hormone responses and development were overrepresented for the genes upregulated in val1 val2 seedlings, whereas the downregulated genes were related to metabolic pathways (Supplementary Dataset S2). As for swn clf, seed maturation genes, including AGL15, 2S1, OLE1 and DOG1, were derepressed in val1 val2 seedlings (63) (Supplementary Figure S4 and Supplementary Dataset S1).
VAL1 and VAL2 colocalize with SWN and CLF
Because the phenotype and transcriptome profile of val1 val2 seedlings were similar to those of swn clf seedlings, we hypothesized that VAL1 and VAL2 might colocalize with SWN and CLF genome-wide. To test this, we mapped the genome-wide occupancy of VAL1 and VAL2 using chromatin immunoprecipitation followed by sequencing (ChIP-seq). Both VAL1 and VAL2 are broadly expressed in Arabidopsis (Supplementary Figure S5). We introduced green fluorescent protein (GFP)-tagged VAL1 gene (VAL1-GFP) or VAL2-GFP driven by the respective native promoter into val1 or val2 single mutants, respectively. The accumulation of VAL1-GFP or VAL2-GFP fusion proteins was confirmed by laser confocal scanning microscopy and immunoblotting (Supplementary Figure S6A and B). Both transgenes rescued the somatic embryonic phenotypes of the val1 val2 double mutant (Supplementary Figure S6C).
Through ChIP-seq analyses, we identified 16,506 VAL1-enriched genes and 12,368 VAL2-enriched genes in young seedlings (Supplementary Dataset S3). Among the VAL1-enriched genes, 65.3% were also targeted by VAL2, whereas 87.1% of the VAL2-enriched genes were targeted by VAL1 (Supplementary Figure S7A). In addition, regions bound by VAL1 overlapped significantly with those bound by VAL2 (observed, 10,778; expected, 5,967; observed/expected, 1.8, P = 0; Supplementary Figure S7B), consistent with functional redundancy between these two proteins (19,24–26,64). VAL1 and VAL2 had a similar peak width in the genome (Supplementary Figure S7C), and both proteins were enriched within gene bodies from the transcription start site (TSS) to regions near the transcription termination site (TTS), with the highest occupancy at the region near the TSS (Supplementary Figure S7D). The mean binding strength of VAL1 at target loci was stronger than that of VAL2 under the same conditions (Supplementary Figure S7E), which might be due to the higher protein level of VAL1 compared with VAL2 (Supplementary Figure S6B). The GO-term analysis showed that VAL1- and VAL2-enriched genes were overrepresented by terms related to different development processes (Supplementary Dataset S4).
To assess whether the deregulated genes in val1 val2 connect to the loss of PRC2 function, we calculated the overlap of those deregulated genes in val1 val2 that are direct VAL1/VAL2 targets (VAL1/VAL2_deregulated genes) with those genes that lost H3K27me3 in swn clf seedlings (36). We found that VAL1/VAL2_regulated genes significantly overlap with genes that lost H3K27me3 in swn clf (observed, 1,025; expected, 724; observed/expected, 1.4; P = 1.50e–37) (Supplementary Figure S8A). Next, we compared the VAL1 and VAL2 occupancy profiles in 14-day-old seedlings with published genome-wide SWN and CLF occupancy data, which were also generated using 14-day-old seedlings (36). We found that VAL1 and VAL2 colocalized with SWN and CLF peak summits (Figure 2A). In total, 53.9% of SWN- and 51.8% of CLF-target genes were identified as VAL1 and VAL2 targets (Figure 2B and C and Supplementary Figure S8B and C). In addition, 45.7% of H3K27me3-marked genes were also occupied by VAL1 and VAL2 (Figure 2B and C and Supplementary Figure S8B and C). Thus, VAL1 and VAL2 colocalize with SWN and CLF over numerous H3K27me3-marked genes.
![VAL1 and VAL2 interact with PRC2 catalytic subunits SWN and CLF. (A) Heatmap and curve lines showing the VAL1, VAL2, SWN (36), CLF (36) and H3K27me3 enrichment signals at SWN-enriched sites. The SWN peaks are ranked from highest to lowest. (B) Mutual overlaps among VAL1/VAL2, SWN (36), CLF (36), and H3K27me3 peaks. VAL1/2 represents peaks commonly bound by VAL1 and VAL2. Significance was tested by permutation (n = 100) (57). Heatmap shows enrichment scores Z = log2[\documentclass[12pt]{minimal}
\usepackage{amsmath}
\usepackage{wasysym}
\usepackage{amsfonts}
\usepackage{amssymb}
\usepackage{amsbsy}
\usepackage{upgreek}
\usepackage{mathrsfs}
\setlength{\oddsidemargin}{-69pt}
\begin{document}
}{}$\frac{{{\rm{observed}}\ {\rm{overlap}}}}{{{\rm{expected}}\ {\rm{overlap}}}}$\end{document}](-log10[P value]). NA, not applicable. (C) Percentages of VAL1/2, SWN, CLF and H3K27me3 enriched genes (by row) overlapping with other enriched genes (by column). Red rectangles indicate the strength of the overlap. Asterisks indicate significant overlap, as determined by hypergeometric tests. The observed/expected scores and P values are listed in Supplementary Figure S8B and C. (D, E) Bimolecular Fluorescence Complementation assay (BiFC) showing the physical association between VAL1 and SWN/CLF in Nicotiana benthamiana leaf cells. The association of paired proteins is indicated by EYFP fluorescence (D) and quantified in (E). FUS3 and FRI were used as negative controls. Scale bars = 60 μm. Three BiFC experiments, each consisting of 500 cells, were performed. P < 0.0001, two-way ANOVA with Tukey's multiple comparisons test. (F) Coimmunoprecipitation of VAL1 with SWN and CLF. SWN-3HA or CLF-3HA was immunoprecipitated with anti-FLAG beads from Nicotiana benthamiana leaf expressing VAL1-3FLAG and SWN-3HA or CLF-3HA. ACTIN was used as a negative control. (G) VAL1 interacts with SWN and CLF-N in yeast cells. The coding sequences of VAL1, SWN and CLF-N were fused with the GAL4-AD or BD domain, as indicated. SD (–WLHA), selective medium without tryptophan, leucine, histidine and adenine; SD (–WL), medium without tryptophan and leucine, as a growth control.](/dataresources/secured/content-1765762427410-6f64cace-5c2d-4e8e-80fd-a276c653fb6d/assets/gkaa1129fig2.jpg)
VAL1 and VAL2 interact with PRC2 catalytic subunits SWN and CLF. (A) Heatmap and curve lines showing the VAL1, VAL2, SWN (36), CLF (36) and H3K27me3 enrichment signals at SWN-enriched sites. The SWN peaks are ranked from highest to lowest. (B) Mutual overlaps among VAL1/VAL2, SWN (36), CLF (36), and H3K27me3 peaks. VAL1/2 represents peaks commonly bound by VAL1 and VAL2. Significance was tested by permutation (n = 100) (57). Heatmap shows enrichment scores Z = log2[](-log10[P value]). NA, not applicable. (C) Percentages of VAL1/2, SWN, CLF and H3K27me3 enriched genes (by row) overlapping with other enriched genes (by column). Red rectangles indicate the strength of the overlap. Asterisks indicate significant overlap, as determined by hypergeometric tests. The observed/expected scores and P values are listed in Supplementary Figure S8B and C. (D, E) Bimolecular Fluorescence Complementation assay (BiFC) showing the physical association between VAL1 and SWN/CLF in Nicotiana benthamiana leaf cells. The association of paired proteins is indicated by EYFP fluorescence (D) and quantified in (E). FUS3 and FRI were used as negative controls. Scale bars = 60 μm. Three BiFC experiments, each consisting of 500 cells, were performed. P < 0.0001, two-way ANOVA with Tukey's multiple comparisons test. (F) Coimmunoprecipitation of VAL1 with SWN and CLF. SWN-3HA or CLF-3HA was immunoprecipitated with anti-FLAG beads from Nicotiana benthamiana leaf expressing VAL1-3FLAG and SWN-3HA or CLF-3HA. ACTIN was used as a negative control. (G) VAL1 interacts with SWN and CLF-N in yeast cells. The coding sequences of VAL1, SWN and CLF-N were fused with the GAL4-AD or BD domain, as indicated. SD (–WLHA), selective medium without tryptophan, leucine, histidine and adenine; SD (–WL), medium without tryptophan and leucine, as a growth control.
VAL1 and VAL2 physically interact with SWN and CLF
The genome-wide colocalization of VAL1 and VAL2 with the PRC2 subunits SWN and CLF on the Arabidopsis genome raised the question of whether VAL1 and VAL2 interact with SWN and CLF. Bimolecular fluorescent complementation (BiFC) experiments in which VAL1 or VAL2 was fused to non-fluorescent N-terminal EYFP (nEYFP) and SWN or CLF was fused to C-terminal EYFP (cEYFP) showed that VAL1 and VAL2 both associated with SWN or CLF in the nucleus (Figure 2D and E and Supplementary Figure S9A). Nuclear-localized proteins FRI or FUS3 did not interact with VAL1 and VAL2 or with SWN and CLF, respectively (Figure 2D and E and Supplementary Figure S9A). In tobacco leaves, VAL1 and VAL2 fused to FLAG tag coimmunoprecipitated with hemagglutinin (HA)-tagged SWN or CLF (Figure 2F and Supplementary Figure S9B). Additional coimmunoprecipitation (Co-IP) assays using Arabidopsis seedlings expressing a functional VAL1 tagged with GFP (VAL1-GFP) and a FLAG-tagged SWN (SWN-FLAG) confirmed the interaction between SWN and VAL1 in vivo (Supplementary Figure S9C). Finally, yeast two-hybrid assays showed that both VAL1 and VAL2 interacted with SWN and CLF in yeast cells (Figure 2G and Supplementary Figure S9D). Taken together, these results suggest that VAL1 and VAL2 form complexes with SWN and CLF.
Loss of VAL1 and VAL2 leads to impaired PRC2 recruitment
Previous studies reported that VAL1 is required for H3K27me3 deposition at FLC during vernalization (22,23), but direct evidence showing that VAL1 and VAL2 regulate the enrichment of SWN/CLF at target loci was lacking. The physical interaction and genome-wide colocalization between VAL1/2 and SWN/CLF prompted us to investigate whether PRC2 occupancy at target genes requires VAL1 and VAL2. We constructed homozygous pSWN:SWN-GFP swn val1 val2 plants by crossing the pSWN:SWN-GFP swn (36) and val1 val2 mutants. The AGL15, 2S1, OLE1, and DOG1 genes contained RY elements, and were marked by H3K27me3 and enriched by SWN/CLF in WT seedlings. The level of H3K27me3 at these genes was significantly reduced (Supplementary Figure S10), and their transcription was derepressed in val1 val2 (Supplementary Figure S4). The decrease of H3K27me3 in val1 val2 seems not to be the indirect consequence of gene activation because the decrease was also observed at genes that did not become activated in val1 val2 (Supplementary Figure S10). We selected the four loci to quantify SWN enrichment in val1 val2 using ChIP followed by quantitative PCR (ChIP-qPCR). The ChIP-qPCR results showed that the functional loss of both VAL1 and VAL2 significantly decreased SWN enrichment at these loci (Figure 3A). The SWN protein level was not affected by the loss of VAL1 and VAL2 (Supplementary Figure S11A). Similarly, the enrichment of CLF at these loci, but not the CLF protein level, was also significantly reduced in val1 compared with WT (Figure 3B and Supplementary Figure S11B). To address whether SWN recruitment in the genome requires VAL1/VAL2, we conducted ChIP-seq analysis using pSWN:SWN-GFP swn val1 val2 and pSWN:SWN-GFP swn plants. The mean SWN enrichment signal at SWN-only peaks was similar between val1 val2 and wild type; however, at VAL1/2-enriched SWN peaks, it substantially reduced in val1 val2 (Figure 3C and D). We also analyzed SWN enrichment signal at the RY sites occupied by VAL1/2 and SWN, and the results showed that the mean SWN enrichment signal at the RY sites was also substantially decreased in val1 val2 (Figure 3E and F). Thus, VAL1 and VAL2 regulate SWN/CLF enrichment at a subset of PRC2-target genes which are enriched by VAL1/VAL2 transcription factors.
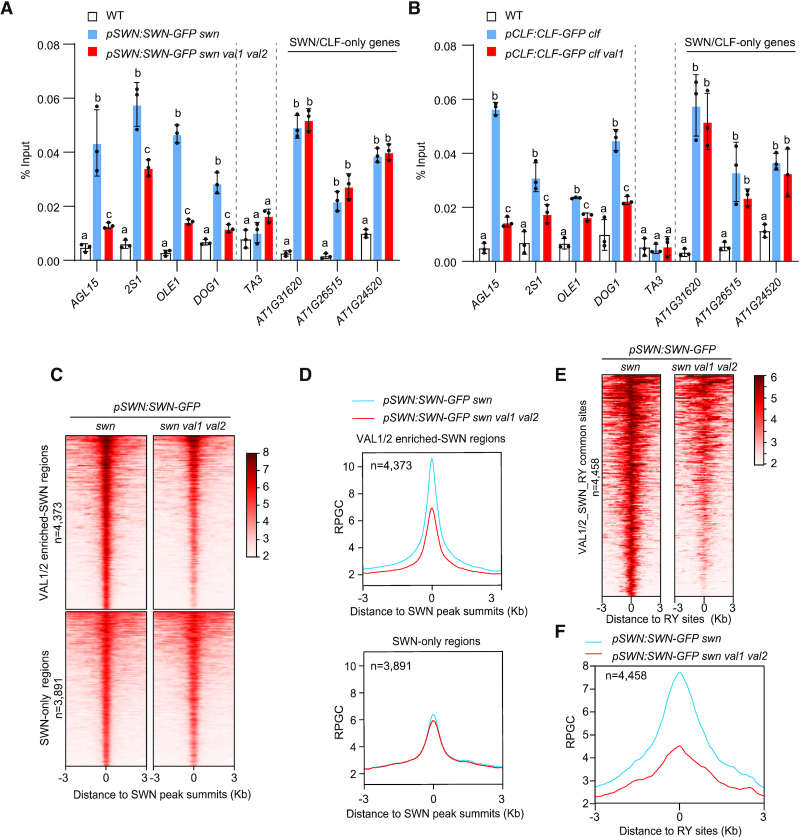
Loss of VAL1 and VAL2 leads to impaired recruitment of PRC2. (A) SWN enrichment at AGL15, 2S1, OLE1, and DOG1 decreased in val1 val2 double mutants, as determined by ChIP-qPCR. Data are shown as the percentage of input. WT plants were used as the negative control sample.TA3 was used as a negative control locus. SWN enrichment at three SWN/CLF-only genes (genes enriched by SWN and CLF but not by VAL1/VAL2) were not changed in val1 val2. Error bars are means ± s.d. from three independent experiments (black dots). Lower-case letters indicate significant differences, as determined by two-way ANOVA with Tukey's multiple comparisons test. (B) ChIP-qPCR showing that CLF enrichment at AGL15, 2S1, OLE1, and DOG1 decreased in val1 mutants. (C) and (D) Heatmaps and metagene plots of ChIP-seq showing that the mean SWN enrichment signal at VAL1/2 enriched-SWN regions (regions enriched by both SWN and VAL1/VAL2), but not at SWN-only regions (regions enriched by SWN but not by VAL1/VAL2), substantially decreased in val1 val2. (E and F) Heatmap and metagene plots showing that the mean SWN enrichment signal at RY sites occupied by VAL1/2 and SWN (VAL1/2-SWN-RY common sites) substantially decreased in val1 val2.
We also examined the enrichment of VAL1 at AGL15, 2S1, OLE1 and DOG1 loci in swn clf double mutant background. The VAL1 protein level was not affected by SWN/CLF (Supplementary Figure S12A). Interestingly, the VAL1 binding was increased at AGL15, and decreased at 2S1, OLE1 and DOG1 in swn clf (Supplementary Figure S12B).
val1 val2 mutant shows genome-wide changes in the distribution of H3K27me3
Next, we queried whether the val1 val2 mutant showed a genome-wide reduction in H3K27me3 level at H3K27me3-marked regions in WT. The mean H3K27me3 level at H3K27me3-marked regions was lower in val1 val2 mutants than in WT (Figure 4A). To assess whether the reduction in H3K27me3 at H3K27me3-marked regions was associated with the binding of VAL1 and VAL2, we divided H3K27me3-marked regions into those regions either occupied by VAL1/VAL2 and marked with H3K27me3 (VAL1/VAL2-H3K27me3; 3,122 regions) or exclusively marked with H3K27me3 (H3K27me3-only; 5,706 regions). We found that the decrease in H3K27me3 level in val1 val2 seedlings was due to a substantial reduction at VAL1/VAL2-H3K27me3 regions, but not at H3K27me3-only regions (Figure 4A).
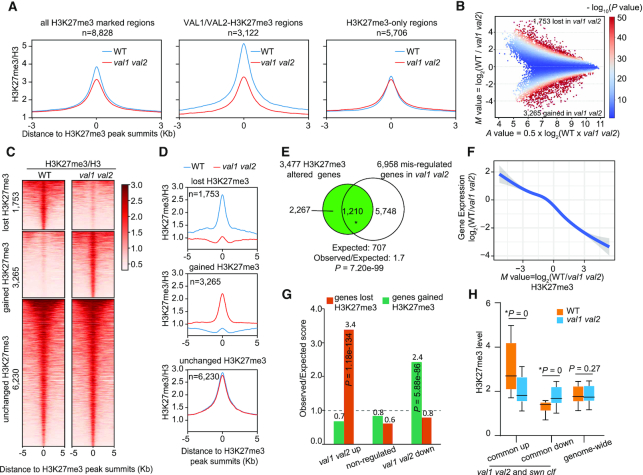
val1 val2 mutants show genome-wide changes in H3K27me3 compared to wild type. (A) Metagene plots showing H3K27me3 enrichment level (normalized to H3) at all H3K27me3 marked regions (the H3K27me3-occupied regions in WT), VAL1/VAL2-H3K27me3 regions (regions marked by both H3K27me3 and VAL1/VAL2), and H3K27me3-only regions (regions marked by H3K27me3 but not by VAL1/VAL 2) in the wild type (WT) and val1 val2 mutants. (B) A MA plot showing the changes in H3K27me3 intensity in val1 val2 compared with WT seedlings after analysis with MAnorm (56). Colored dots represent all H3K27me3-positive peaks from WT and val1 val2 seedlings. The x axis represents the enrichment intensity of each peak (A value). The y axis represents M value, which resprents log2(difference in H3K27me3 intensity between WT and val1 val2). Positive and negative M values indicate lower and higher H3K27me3 levels, respectively, in val1 val2 than in WT seedlings. The color range at the right represents –log10(P values, two-tailed test) of each peak. (C) Heatmaps of H3K27me3 ChIP-seq reads density (normalized to H3) at regions that either lost H3K27me3, gained H3K27me3, or showed no change in H3K27me3 level in val1 val2 compared with WT. Peaks aligned at the peak summit of H3K27me3 are plotted with 5 kb up- and downstream regions. (D) Metagene plots showing H3K27me3 coverage (normalized to H3) at regions lost H3K27me3, gained H3K27me3, or showed no change in H3K27me3 level in val1 val2 mutants compared with WT. RPGC, reads per genomic content (1 × normalization). (E) A Venn diagram showing the significant overlap between the genes with altered H3K27me3 in val1 val2 seedlings and the genes misregulated in the val1 val2 mutant. The P value was calculated with hypergeometric tests. (F) Negative correlation between changes of H3K27me3 and changes in gene expression in the val1 val2 mutant. The M value in x axis represents log2(difference in H3K27me3 intensity between WT and val1 val2). The y axis represents the log2(fold changes in gene expression). (G) Enrichment analysis of genes that were up-regulated, down-regulated, or non-regulated in the val1 val2 mutant among genes that gained or lost H3K27me3 in the mutant. Each category was compared with the expected random overlap (dotted line); the y axis represents the observed/expected score. The P values were calculated by hypergeometric tests. (H) Boxplots showing H3K27me3 ChIP-seq read intensity in WT and val1 val2 at genes commonly up- or down-regulated in val1 val2 and swn clf (36) mutants. The H3K27me3 ChIP-seq read intensity at all annotated Arabidopsis genes in the val1 val2 mutant does not differ from that in WT. The asterisk indicates a significant difference between WT and val1 val2, as determined by the Mann–Whitney U test.
We further investigated the quantitative H3K27me3 changes in val1 val2 using the MAnorm program (56). Around half of the H3K27me3-enriched regions had similar H3K27me3 levels between WT and val1 val2 (unchanged H3K27me3 regions), but 1,753 and 3,265 regions had respectively lower and higher H3K27me3 coverage in val1 val2 than in WT seedlings, corresponding to 44.6% of all H3K27me3-enriched regions in WT and val1 val2 (Figure 4B–D). These regions were assigned to 1,172 and 2,305 genes that showed significant loss (genes lost H3K27me3) or gain of H3K27me3 (genes gained H3K27me3), respectively, in val1 val2 seedlings (Supplementary Dataset S5). Thus, VAL1 and VAL2 are required to specify H3K27me3 distribution to genes in general.
Among the 3,477 genes with altered H3K27me3 levels, 1,210 were significantly differentially expressed in val1 val2 (expected, 707; observed/expected, 1.7; P = 7.20e–99) (Figure 4E). Changes in gene expression in the val1 val2 mutants were negatively correlated with changes in H3K27me3 levels in the same mutants (Figure 4F). Moreover, we observed a significant enrichment in genes that lost H3K27me3 among the 3,848 transcriptionally upregulated genes in the val1 val2 mutant (observed, 450; expected, 132; observed/expected, 3.4; P = 1.18e–134; Figure 4G), whereas genes that gained H3K27me3 were significantly enriched among the 3,110 downregulated genes (observed, 511; expected, 209; observed/expected, 2.4; P = 5.88e–86; Figure 4G). The mean H3K27me3 level at the genes commonly upregulated in both val1 val2 and swn clf double mutants was significantly lower in the val1 val2 than in WT seedlings (P = 0), whereas that of genes commonly downregulated in val1 val2 and swn clf was significantly higher in val1 val2 (P = 0) than in WT seedlings (Figure 4H). Gene Ontology term analysis of the genes that lost H3K27me3 revealed enrichment in plant hormone responses and development, whereas the genes that gained H3K27me3 showed no significant GO-term enrichment (Supplementary Dataset S6). Oleosin1 (AT4G25140), AT3G63010 and AT4G10350 are typical examples of genes that lost H3K27me3, gained H3K27me3, and had no change in H3K27me3, respectively (Supplementary Figure S13). Together, these results suggest that the val1 val2 mutations cause a substantial redistribution of H3K27me3.
VAL1- and VAL2-binding and RY elements are associated with regions that lost H3K27me3
We further determined whether the altered H3K27me3 distribution in val1 val2 seedlings is directly dependent on VAL1 and VAL2 binding. VAL1 and VAL2 significantly enriched at the regions that lost H3K27me3 in the val1 val2 mutant, whereas the enrichment of VAL1 or VAL2 at regions that gained H3K27me3 was less significant (Figure 5A and Supplementary Figure S14). Furthermore, the binding strength of VAL1 or VAL2 positively correlated with the degree of the loss of H3K27me3 in the val1 val2 mutant (Figure 5B). Overall, the greater the loss of H3K27me3 in val1 val2 compared with WT (M value >1), the stronger the enrichment of VAL1 and/or VAL2 (Figure 5B). Together, these analyses suggest that the loss of H3K27me3 in the val1 val2 mutant is a direct consequence of the loss of VAL1 and VAL2 binding, whereas the gain of H3K37me3 might be a secondary effect of the loss of VAL1 and VAL2.
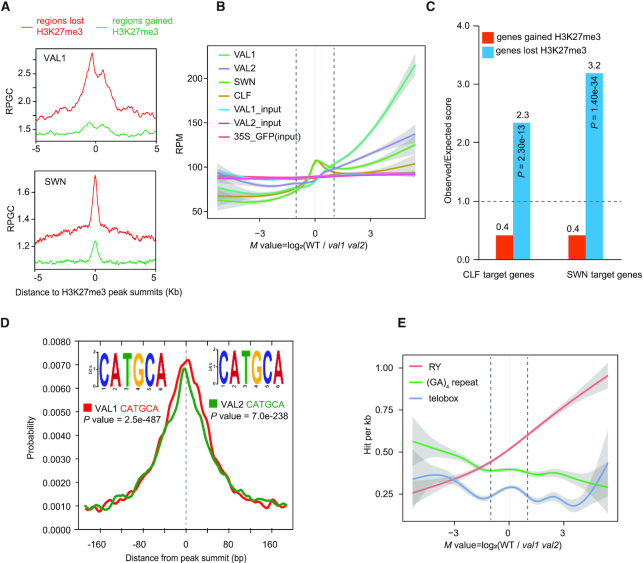
VAL1 and VAL2 bind to, and RY element are associated with, regions that lost H3K27me3 in val1 val2 mutant. (A) Curve diagrams showing VAL1 and SWN (36) ChIP-seq signals at regions 5 kb up- and downstream of the H3K27me3 peak summits for loci that lost or gained H3K27me3 in the val1 val2 mutant. RPGC represents reads per genomic content (1 × normalization). (B) Reads per million (RPM) of VAL1, VAL2, SWN (36) and CLF (36) at the center (±1 kb) of H3K27me3 peaks, plotted per M value. Lines represent mean values; clouds represent ± SE. VAL1_input and VAL2_input were used as negative controls for VAL1 and VAL2, respectively. 35S_GFP (input) was the negative control for SWN (36) and CLF (36). Dotted lines represent the M values of –1 and +1. (C) Enrichment analysis of CLF (36) and SWN target genes (36) in WT among genes that gained or lost H3K27me3 in the val1 val2 mutant. Each category was compared with the expected random overlap (dotted line); the y axis represents the observed score divided by the expected score. The P values were calculated by hypergeometric tests. (D) Distribution of the RY element across VAL1 and VAL2 peaks. The P value was calculated by the Fisher's Exact Test. (E) Frequency of the RY element at the summits of H3K27me3 peaks, plotted per M value. Lines represent mean values; clouds represent ± SE.
We also compared the binding profiles of the PRC2 catalytic cores SWN and CLF across the regions that lost or gained H3K27me3, using the published SWN or CLF occupancy data that were also generated from 14-day-old seedlings (36). SWN and CLF followed a trend similar to those for VAL1 and VAL2 (Figure 5B), and in WT plants both SWN and CLF were significantly enriched at regions that lost H3K27me3 but not at regions that gained H3K27me3 (Figure 5A and C and Supplementary Figure S14).
VAL1 binds the RY element (CATGCA) in FLC, AGL15, DOG1 and FT loci in vitro (19,21–23,32,33), and mutation of the RY element in the first intron of FLC, and in AGL15, DOG1, and FT resulted in the derepression of these genes (21–23,32,33) (19). Consistent with these observations, our ChIP-seq data showed that the RY element was overrepresented at VAL1- and VAL2-enriched sites in vivo (Figure 5D). Next, we assessed the relationship between the RY element and the alteration in H3K27me3 in the val1 val2 mutant. The RY element was overrepresented in regions that lost H3K27me3, but not in regions that gained H3K27me3 in val1 val2 (Supplementary Figure S15A). In the Arabidopsis genome, 22,702 genes contain one or more RY elements. RY-containing genes were significantly enriched among the genes that lost H3K27me3 (observed, 1,060; expected, 777; observed/expected, 1.4; P = 7.22e–86), but not among the genes that gained H3K27me3 (observed, 1,544; expected, 1,529; observed/expected, 1.0; P = 0.26), in the val1 val2 mutant (Supplementary Figure S15B). Moreover, we calculated the frequency of the RY element in regions with altered H3K27me3 levels. The presence of the RY element was positively correlated with the loss of H3K27me3 in the val1 val2 mutant (Figure 5E). By contrast, the GA repeat and Telobox motif, the two previously reported plant PREs (14,17), showed no clear correlation (Figure 5E). Together, the above data suggest that the RY element directly associates with genes that lost H3K27me3 in the val1 val2 mutant, whereas those that gained H3K27me3 in the mutant are probably less related to the RY element.
It is known that H3K27me3 often spreads from the original nucleation site of PRC2 recruitment to flanking regions in plants (65–67). Therefore, to further examine whether the RY element is enriched at SWN-enriched regions, we divided SWN-enriched regions into those occupied by VAL1/VAL2 (the VAL1/2-enriched SWN peaks) and those without VAL1/VAL2 occupancy (SWN-only), and performed a motif analysis using the sequences surrounding each of the SWN peak summits, the VAL1/2-enriched SWN peak summits, and the SWN-only peak summits. The results of the analysis showed that the RY element was overrepresented in the SWN-enriched regions and the VAL1/2-enriched SWN-bound regions, but not in SWN-only regions (Supplementary Figure S16).
The VAL1/VAL2–RY system is largely independent of TRB1 and the AZF1/BPC1 module in mediating Polycomb silencing
TRB1, BPC1 and AZF1, which bind to the Telobox motif, GA repeat, and Telobox motif, respectively, mediate PRC2 recruitment to silence gene expression in Arabidopsis (14,17). We found that genes that lost H3K27me3 (observed, 71; expected, 130; observed/expected, 0.5; P = 7.72e–11) or gained H3K27me3 (observed, 180; expected, 330; observed/expected, 0.5; P = 9.66e–31) in the val1 val2 mutant did not significantly overlap with those in the trb1 trb2 trb3 triple mutant (17) (Figure 6A and B). Moreover, TRB1 target genes did not significantly overlap with genes that lost H3K27me3 in val1 val2 (observed, 309; expected, 316; observed/expected; 1.0; P = 0.32; Figure 6C and Supplementary Figure S17A). Likewise, BPC1 and/or AZF1 target genes (14) showed no significant overlap with the genes that lost H3K27me3 in the val1 val2 mutant (observed, 138; expected, 137; observed/expected, 1.0; P = 0.43; Figure 6C and Supplementary Figure S17B). The BPC1–GA repeat, AZF1–Telobox and TRB1–Telobox were responsible for fewer than half of the H3K27me3 marked genes in Arabidopsis (Figure 6D and Supplementary Figure S18) (14,17). In addition, although the presence of the RY element quantitatively correlated with the loss of H3K27me3 in the val1 val2 mutant, those of the GA repeat and Telobox motif did not (Figure 5E). These data suggest that the VAL1/VAL2–RY module controls a subset of H3K27me3-marked genes that are mostly separate from those controlled by the BPC1–GA/AZF1–Telobox and/or TRB–Telobox systems (Figure 6E).
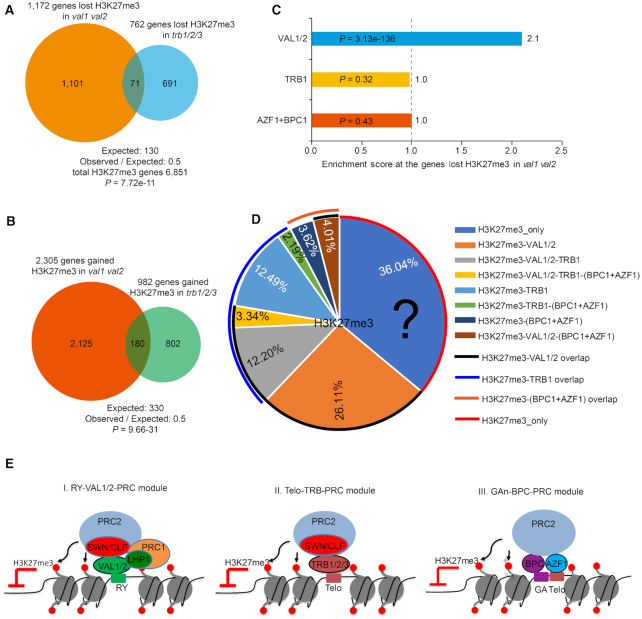
VAL1–RY and VAL2–RY interactions are largely independent of the TRB1 and AZF1/BPC1 modules in mediating Polycomb silencing. (A, B) Venn diagram showing the absence of significant overlap between the genes that lost (A) or gained (B) H3K27me3 in the val1 val2 and those in trb1 trb2 trb3 mutants (17). The P values were calculated using hypergeometric tests. (C) Overlapping analysis of genes occupied by VAL1/VAL2, TRB1 (17) or AZF1/BPC1 (14) among the genes that lost H3K27me3 in the val1 val2 mutant. Each category was compared with the expected random overlap (dotted line); the x axis represents the observed/expected score. The hypergeometric test was used to determine significance. (D) The percentages of H3K27me3-marked genes in WT that overlapped with VAL1/VAL2-, TRB1- or AZF1/BPC1-enriched genes. The black question mark represents the H3K27me3-marked genes that ware not occupied by VAL1 and/or VAL2, TRB1 or AZF1/BPC1. (E) Simplified models for Polycomb recruitment at different loci in Arabidopsis. At least three PRC recruitment modules function largely independently from each other. (I) In the RY–VAL1/VAL2–PRC module, the sequence-specific transcriptional repressors VAL1 and VAL2 bind to the RY element in target genes and interact with PRC2. Recruitment of PRC2 by VALs thus establishes H3K27me3 silencing (this study). VAL1/VAL2 can also interact with PRC1 to facilitate the establishment of H3K27me3 (22). (II) In the Telobox–TRB–PRC module, TRB1, TRB2 and TRB3 recognize the Telobox motifs of target genes to recruit PRC2 complexes (17). (III) In the GA–BPC–PRC module, BPCs bind GA repeats in cooperation with AZF1–Telobox, to recruit PRC2 complexes (14).
DISCUSSION
In this study, we have investigated the mechanistic basis of VAL function in mediating Polycomb silencing at a genome-wide scale. The depletion of both VAL1 and VAL2 leads to a global shift in H3K27me3 over thousands of genomic sites (Figure 4A–D), suggesting that the VAL proteins are essential for programming the genome-wide distribution of H3K27me3. Furthermore, val1 val2 mutants possess a similar phenotype and transcriptome to swn clf mutants (Figure 1), and VAL1 and VAL2 colocalize with SWN and/or CLF at regions that show loss of H3K27me3 in val1 val2 mutants (Figure 5A and Supplementary Figure S14). Finally, VAL1 and VAL2 physically interact with SWN and CLF (19) (Figure 2D–G, Supplementary Figure S9), and VAL1 and VAL2 loss of function significantly reduces the enrichment of the SWN/CLF–PRC2 machinery at target loci (Figure 3). Together, these findings demonstrate an extensive genome-wide interaction between VAL1/VAL2 and PRC2 that has strong effects on transcription. Notably, a large proportion of VAL1- and VAL2-occupied sites do not appear to be associated with SWN and CLF or with H3K27me3 (Figure 2C), suggesting that both proteins might also have a role independent from PRC2/H3K27me3 regulation, or might indirectly affect the regulation of PRC2/H3K27me3. Further research is required to define the role of VAL1/2 at those loci.
Previous studies had shown that VAL1 is required for H3K27me3 deposition at FLC during vernalization (22,23), but how VAL1 and VAL2 are connected with the deposition of H3K27me3 at target loci was still not fully elucidated. Here, we show that loss of both VAL1 and VAL2 results in a decreased accumulation of the PRC2 catalytic subunits SWN and CLF, indicating that VAL1 and VAL2 are necessary for the enrichment of the PRC2 complex at target loci (Figure 3). Furthermore, VAL1 and VAL2 interact with the PRC2 catalytic subunits SWN and CLF (Figure 2D–G and Supplementary Figure S9). Together, these data demonstrate that VAL1 can form complexes with PRC2 and recruit PRC2 to target loci for H3K27me3 deposition (Figure 6E). Notably, affinity purification has demonstrated that VAL1 interacts with components of the apoptosis- and splicing-associated protein (ASAP) complex and with the SIN3-histone deacetylase complex. These interactions are thought to be involved in VAL1-mediated H3K27me3 deposition (23). In addition, VAL1 and VAL2 physically interact with LHP1 and AtBMI1A/B (22,30). VAL1 recruits LHP1 to FLC chromatin and associates with AtBMI1A to repress FLC expression (22,23). LHP1 interacts with MSI1, a core PRC2 component, to recruit PRC2 to chromatin that carries H3K27me3 (41,68). Thus, in addition to SWN/CLF-PRC2 complexes, VAL1 and VAL2 can also associate with PRC1 and/or histone deacetylase complexes to facilitate PRC2 repression. These different mechanisms employed by VALs are not necessarily mutually exclusive and might function in a positive-feedback manner to ensure the establishment and/or maintenance of H3K27me3 deposition.
Previous studies revealed that VAL1 binds to the RY element via its B3 domain at a handful of loci in vitro (19–21,23,32,33). Mutation of the RY elements in FLC, AGL15, and DOG1 leads to a reduced H3K27me3 level and transcriptional de-repression (19,21,23), suggesting that the RY element is required for H3K27me3 establishment and transcriptional repression. However, the extent of the genome-wide contribution of the RY element in facilitating Polycomb silencing was unknown. A robust quantitative correlation between the frequency of the RY element and the degree of H3K27me3 loss in the val1 val2 mutant was observed (Figure 5E). Moreover, the RY element is overrepresented in genomic regions that lost H3K27me3 in val1 val2 or in VAL1-enriched SWN-bound regions, but not in regions that gained H3K27me3 or in VAL1-excluded SWN-bound (SWN-only) regions (Supplementary Figures S15A and S16). Therefore, the RY element is associated with H3K27me3 deposition at PRC2 target loci that are directly bound by VAL1 and VAL2, but might not be required for H3K27me3 deposition at PRC2 targets that are independent of VAL1 and VAL2.
Two recent studies showed that GA repeats and Telobox motifs are two types of PREs that are recognized by BPC1 and by AZF1 or TRB1, respectively, for Polycomb silencing in Arabidopsis (14,17). Our data suggest that the VAL1/VAL2–RY module might be mostly unassociated with the BPC1–GA/AZF1–Telobox and/or TRB–Telobox systems for PRC2 Polycomb silencing in plants (Figure 6). Nevertheless, our data do not exclude the possibility that the different Polycomb recruitment systems may work synergistically at some target loci that simultaneously contain RY and GA or Telobox elements. Notably, a subset of H3K27me3-marked genes is bound neither by BPC1/AZF1, by TRB1, nor by VAL1 and VAL2 (Figure 6D and Supplementary Figure S18), suggesting that there may be additional trans/cis-regulatory modules that determine PRC2 recruitment. Future elucidation of these unknown modules will further help to decipher the mechanisms of Polycomb recruitment in plants.
In conclusion, our work demonstrates the presence of an extensive genome-wide interaction between VAL1/2 and PRC2. VAL1 and VAL2 can interact with PRC2 complexes and recruit them to target loci for H3K27me3 deposition, and both proteins are required to determine the genome-wide H3K27me3 distribution. Finally, our genome-wide analysis suggests that the VAL1/VAL2–RY regulatory system functions largely independently of the TRB–Telobox and BPC1/AZF1–GA repeat–Telobox modules for PRC2 Polycomb silencing in plants.
DATA AVAILABILITY
The ChIP-seq and RNA-seq datasets supporting the conclusions of this article have been deposited in the Gene Expression Omnibus (GEO) under accession GSE119715, GSE145387 and GSE159499.
ACKNOWLEDGEMENTS
We thank the Arabidopsis Biological Resource Center (ABRC) for seeds of T-DNA insertion lines, Professors Justin Goodrich (University of Edinburgh) and Xiaofeng Cao (Chinese Academy of Sciences) for providing swn-4 clf-28 double mutant seeds, Dr Yuhai Cui (Agriculture and Agri-Food Canada) for pSWN:SWN-GFP swn-4 and pCLF:CLF-GFP clf-29 seeds, Dr Xingliang Hou (Chinese Academy of Sciences) for pZPY122-FLAG vector and Dr Zhen Shao (Chinese Academy of Sciences) for discussion about the motif scan analysis.
SUPPLEMENTARY DATA
Supplementary Data are available at NAR Online.
FUNDING
National Natural Science Foundation of China [32070212 and 31870289 to C.L., 32000380 to L.Y., 31871716 to J.L.]; Guangdong Basic and Applied Basic Research Foundation [2019A1515110670 to L.Y.]; Fundamental Research Funds for the Central Universities [18lgzd12 to C.L., 20lgpy121 to L.Y.]. Funding for open access charge: National Natural Science Foundation of China.
Conflict of interest statement. None declared.
REFERENCES
1.
2.
3.
4.
5.
6.
7.
8.
9.
10.
11.
12.
13.
14.
15.
16.
17.
18.
19.
20.
21.
22.
23.
24.
25.
26.
27.
28.
29.
30.
31.
32.
33.
34.
35.
36.
37.
38.
39.
40.
41.
42.
43.
44.
45.
46.
47.
48.
49.
50.
51.
52.
53.
54.
55.
56.
57.
58.
59.
60.
61.
62.
63.
64.
65.
66.
67.