 PheLiGe: an interactive database of billions of human genotype–phenotype associations
Nucleic Acids Research


- Altmetric
Genome-wide association studies have provided a vast array of publicly available SNP × phenotype association results. However, they are often in disparate repositories and formats, making downstream analyses difficult and time consuming. PheLiGe (https://phelige.com) is a database that provides easy access to such results via a web interface. The underlying database currently stores >75 billion genotype–phenotype associations from 7347 genome-wide and 1.2 million region-wide (e.g. cis-eQTL) association scans. The web interface allows for investigation of regional genotype-phenotype associations across many phenotypes, giving insights into the biological function affected by the variant in question. Furthermore, PheLiGe can compare regional patterns of association between different traits. This analysis can ascertain whether a co-association is due to pleiotropy or linkage. Moreover, comparison of association patterns for a complex trait of interest and gene expression and protein levels can implicate causal genes.
INTRODUCTION
Genome-wide association studies (GWASs) have discovered thousands of associations between genetic variants and a multitude of human complex traits, yielding novel insights into human biology. Efficient cross-referencing of a genetic variant with a wide range of phenotypes—phenome scans—allows for identification of the phenotypic action spectrum of a specific genetic locus. Knowledge of such spectra could provide insights into biological function affected by variation in a genetic region, guide functional studies (1), allow formulation of aetiologic hypothesis, facilitate identification of therapeutic intervention targets and inform about potential efficacy and safety of targeting specific molecules and pathways (2). Currently, there are several publicly available tools that allow characterisation of effects of genetic variants across phenotypes studied in the context of human genetic association studies (3–6).
When generating a functional hypothesis about the mechanism of action of a specific variant associated with a trait, we are interested in learning the spectrum of the variant’s pleiotropic effects. An observation of a (significant) association between a SNP and more than one phenotype could mean that all these phenotypes are affected by the same underlying causal variant (pleiotropy). In contrast, such an association could also occur due to several causative variants in linkage disequilibrium, that each affect their own subset of traits (7).
Here, we present a large database with a web interface that allows not only for scanning the phenome for effects of a genetic variant, but also to assess whether co-association of a variant with multiple traits may occur due to pleiotropy or as a consequence of linkage. We name our interactive database PheLiGe to reflect our hope that it will facilitate Phenome Linking to the Genome.
MATERIALS AND METHODS
Data aggregation and processing
Prior to making data available via the PheLiGe web interface, we performed several pre-processing steps (see Figure 1). Publicly available GWAS summary statistics files were obtained from the internet. For each file, we created an annotation that contains information about study design and its key characteristics (sample size, details of association analysis mode, study population, license and use terms, etc.). For complex traits and diseases we matched trait names with terms from the Experimental Factor Ontology (https://www.ebi.ac.uk/ols/ontologies/efo) as well as with the International Classification of Disease (ICD, revision 10) notation and code. For matching with EFO ontology terms we used mapping service ZOOMA (https://www.ebi.ac.uk/spot/zooma/) and manual curation. For eQTL studies the transcript names were mapped to HUGO Gene Nomenclature Committee gene names, that were added as a part of the trait name. For studies of levels of N-glycans we used the standard Oxford notation as a part of a trait’s name.

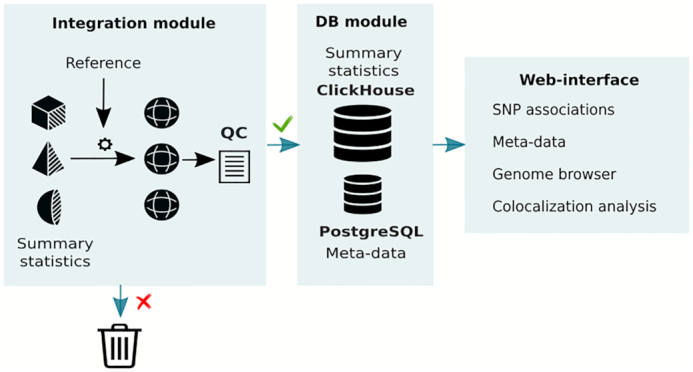
Schema illustrating data processing. Integration module assists with conversion of summary statistics into universal format and with quality control (QC). Reference is used for SNP checking and filtration. If summary statistics pass QC test, they, together with metadata, are uploaded to the databases (the DB module). Finally, data become available to an external user via a web interface.
Since the data were generated by different groups using different protocols, the resulting summary statistics files have different formats. To solve this problem, we developed an integration module that transforms data into a universal format (see Supplementary information). To ensure consistency of data within the database, our import procedure compares information about the SNP identification number, its position in the genome, and alleles to the reference. If any of the characteristics do not match, the SNP is not imported. The present implementation uses the reference that consists of 503 genomes of Europeans from the ‘1000 genomes’ project (1000G phase 3 version 5 (8)). Next, we harmonized the data, so that the same effect and reference alleles are used in all GWASs. If a summary statistics file did not directly contain all columns that are required for conversion to the universal format, in certain cases, a GWAS could still be imported into the database. For example, missing allele frequency could be replaced with that from the reference; missing standard error could be computed based on the effect size and a P-value.
Next, we perform quality control (QC) for each study. In particular, QC includes a comparison of the frequencies of alleles from the study with those from the reference sample, a comparison of the reported P-values and P-values computed from the reported effect size and its standard error, and an analysis of the distribution of estimates of the allele effects. We also estimate and report the trait’s variance and genomic control factor. SNPs are marked as outliers if the reported allele frequency deviates from the reference panel allele frequency by >0.2, or in case the reported and computed association log10(P-value) differ by more than 2% for P-values <10–10 and by more than the absolute value of 0.5 for P-values >10−10. Only summary statistics for SNPs passing the QC are uploaded to the databases.
The PheLiGe database consists of two parts: ClickHouse (https://clickhouse.tech) is used to manage summary-level genetic association data, and PostgreSQL (http://www.postgresql.org) is used to manage study meta-data.
Colocalization analysis
For analysis of colocalization of signals of association from different traits, we implemented a slightly modified version of the θ metric defined by Momozawa et al. (9) (see Supplementary information for full description). In short, this method compares ‘profiles’ of association of two traits in some region. Often, two traits are associated with the same locus, however, the patterns of association are different, suggesting that functional elements affecting the two traits are distinct, although are located nearby. When the patterns of association are similar, one can not rule out a hypothesis that the same functional element may affect both traits (pleiotropy).
Thus, based on colocalization analysis user can determine whether two different traits may be under the control of the same functional variant(s) in the locus (in the manuscript by Momozawa et al., the threshold |θ| > 0.7 was suggested) or rather by different functional variants in linkage disequilibrium (|θ| ≤ 0.7).
RESULTS
Database content
At the time of writing, the database of associations contains results from 7347 genome-wide and 1.3 million region-wide association scans. In total, the database contains about 75 billions of genotype-phenotype associations. More specifically, 37.6% of the associations relate genetic variation to a wide range of complex traits and diseases, 48.3% are related to proteomics, 10.5% to transcriptomics, 1.9% to metabolomics and 1.6% to glycomics (see Supplementary Table S1). The current version of this summary information, together with information on the studies that are included in the database is available from the PheLiGe website.
The comparison of the size and content of our database is presented in Supplementary Table S2. Our database is one of the biggest with 75 billions of associations in total. It is second next only to the PheWas (10) database; however, the 126 billions of associations in PheWas also include private data, that can not be accessed by the wide community. In contracts, all 75 billions of associations in our database are available for exploration by general public. Several collections distinguish our database from the rest. We are not aware of any other collection including CEDAR eQTL data on CD14+ monocytes, CD4+ T-lymphocytes, CD8+ T-lymphocytes, CD19+ B-lymphocytes, CD15+ granulocytes, platelets, rectum biopsies, transverse colon biopsies and ileum biopsies cell lines (9). Next, our database contains a large number of well-annotated N-glycomics GWAS.
Web-interface
For the convenience of a new user, we designed an interactive tour that demonstrates basic usage of PheLiGe. The tour is available via the ‘Start tour’ button in the upper right corner (see Figure 2). Below we shortly summarize the content and capabilities of the web interface.
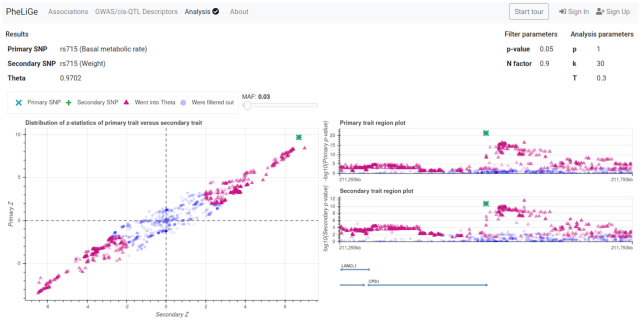
Screenshot of ‘Analysis’ tab. The analysis results for regions around rs715 from basal metabolic rate and weight traits.
A user can access the database via a web interface with four tabs: ‘Associations’, ‘GWAS/cis-QTL Descriptors’, ‘Analysis’, ‘About’. In the ‘Associations’ tab a user can search for phenotypic associations observed for a SNP of interest, directly or via a proxy variant in LD. The search results will be presented as a table with several pages and sorted by association P-value. A user can click on the ‘Open’ button in the ‘SNP plot’ column from this table to access the regional plot. In the pop-up window a user will see a regional association plot, a recombination map, and a gene track. In the regional association plot each dot represents a SNP. A user can filter SNPs by minor allele frequency (MAF) using the slider on the right. If a user navigates the cursor on the dot, she could see a tooltip with SNP information (chromosome, position, alleles, P-value and others). Clicking on the rsID in the tooltip, a user will be redirected to NCBI SNP database, while clicking on the magnifier glass near rsID, the user will be redirected to the ‘Association’ tab and the database will be queried for this rsID. Next, using the button to the left to a trait name, a user can select a ‘primary’ and ‘secondary’ traits, after which a colocalization analysis will be passed to the ‘Analysis’ tab. In this tab, regional patterns of association are compared using the colocalization analysis. The web interface provides interactive graphics for visual comparison of a region. For example, if |θ| > 0.7 one should see a clear linear relation between the z-statistics of the primary and secondary trait (see Figure 2). In the ‘GWAS/cis-QTL Descriptors’ tab, the user can access association study meta-data and search for specific association studies. The search results are presented as a table. The gear icon located at the top right corner allows a user to select the fields she would like to see. From the ‘GWAS/cis-QTL Descriptors’ tab, a user can investigate a Manhattan plot for a trait of interest by clicking on the ‘Open’ button in the ‘Plot’ column. Then a pop-up window with the plot will appear. A user could select a chromosome and then she could navigate through the genome using the instruments presented on the left. The SNPs can be filtered by MAF using a slider on the right. At the highest level of resolution, each SNP will be represented by a dot. This view is identical to the regional plot view described above. The ‘About’ tab contains current summary information about the content of the database and documentation, where more detailed information about output tables and web interface usage can be found.
Case study of the use of the database
To illustrate the use of PheLiGe, we have explored the variant rs7814941, which is strongly associated with back pain (11). We found that rs7814941 is associated with 26 other traits (at P-value < 5 × 10−07), including height, weight, disc problem, forced vital capacity and four eQTLs regulating expression of the GSDMC gene in different tissues (see Supplementary Table S3). However, study of colocalization shows that only for two traits—heel bone mineral density and disk problems—the regional association patterns were sufficiently similar (|θ| > 0.7) to the back pain association pattern (see Supplementary information: Supplementary Figure S1). The similarity of regional genetic associations patterns of back pain and anthropometric traits was in general moderate (|θ| ≤ 0.7). These observations confirm the conclusion that the risk variants at the 8q41.21 locus lead to back pain through intervertebral disc degeneration, but not via the expression of the nearby GSDMC gene in the investigated tissues (12). This example clearly demonstrates that multiple associations do not necessarily imply pleiotropy and highlight the utility of our approach.
DISCUSSION
We developed PheLiGe — a database with a web interface, that allows lookups of phenotypic effects of a genetic variant across genome-wide and regional association scans, and exploration of the regional associations. The database already includes GWASs from many domains, such as complex quantitative traits and diseases, transcriptomics, metabolomics, proteomics, lipidomics, and glycomics. The database is regularly updated. The regional association patterns of different traits can be quantitatively compared, which may help distinguishing pleiotropy from linkage. PheLiGe can provide a user with insights into the biological function of genetic variants, help formulate hypotheses regarding aetiology and inform functional studies.
In the future we plan to continue expanding the database. Up until now, the database has grown rapidly; for example, in June 2019 the number of genotype-phenotype associations was 36 billion, now, the database contains about 75 billions of associations. We expect that by the beginning of 2021 the size will grow to over 100 billions of associations, hopefully making it one of the largest publicly available databases of genotype-phenotype associations. Next, we plan to extend flexibility and usability of search queries. In particular, we will implement an opportunity of obtaining a list of top associations for specific traits and groups of traits; we also plan to add an ontology tree to make search queries more intuitive and flexible. Finally, we plan to implement personal accounts for users so that they could upload their own study results for private or public use.
DATA AVAILABILITY
PheLiGe database is available via web interface at https://phelige.com.
ACKNOWLEDGEMENTS
We thank Michel Georges and Julia Dmitrieva for discussion of the θ metric. We thank Lucija Klaric for help with the development of the QC protocol and for supervising the summary level data unification process. We thank Anna Torgasheva, Viktoria Voroshilova and Alexander Severinov for help with summary data collection and processing. We also thank Erin Macdonald-Dunlop for help with the manuscript preparation. We thank Arina Nostaeva for help with trait name ontology.
SUPPLEMENTARY DATA
Supplementary Data are available at NAR Online.
FUNDING
PolyKnomics BV; Russian Ministry of Education and Science under 5-100 Excellence Programme. Funding for open access charge: Novosibirsk State University, Novosibirsk, Russia.
Conflict of interest statement. L.C.K. and Y.S.A. are co-founders and co-owners of PolyKnomics, a private organization active in the fields of quantitative, computational and statistical (gen)omics. All other authors declare no competing interest.
REFERENCES
1.
2.
3.
4.
5.
6.
7.
8.
9.
10.
11.
12.