 DIANA-miRGen v4: indexing promoters and regulators for more than 1500 microRNAs
Nucleic Acids Research


The authors wish it to be known that, in their opinion, the first two authors should be regarded as Joint First Authors.

- Altmetric
Deregulation of microRNA (miRNA) expression plays a critical role in the transition from a physiological to a pathological state. The accurate miRNA promoter identification in multiple cell types is a fundamental endeavor towards understanding and characterizing the underlying mechanisms of both physiological as well as pathological conditions. DIANA-miRGen v4 (www.microrna.gr/mirgenv4) provides cell type specific miRNA transcription start sites (TSSs) for over 1500 miRNAs retrieved from the analysis of >1000 cap analysis of gene expression (CAGE) samples corresponding to 133 tissues, cell lines and primary cells available in FANTOM repository. MiRNA TSS locations were associated with transcription factor binding site (TFBSs) annotation, for >280 TFs, derived from analyzing the majority of ENCODE ChIP-Seq datasets. For the first time, clusters of cell types having common miRNA TSSs are characterized and provided through a user friendly interface with multiple layers of customization. DIANA-miRGen v4 significantly improves our understanding of miRNA biogenesis regulation at the transcriptional level by providing a unique integration of high-quality annotations for hundreds of cell specific miRNA promoters with experimentally derived TFBSs.
INTRODUCTION
Since the discovery of microRNA (miRNA) abundant transcription in mammalian lineages in 2001 (1), this small RNA family has become a subject of intense research, reshaping our understanding of gene regulatory networks and their implications in physiological and pathological conditions. Thousands of studies have unveiled the critical role of miRNAs in fine-tuning gene expression, the mechanisms of miRNA-mediated recognition and targeting of RNAs (2,3), components of the miRNA biogenesis pathway and members of the RNA-induced silencing complex (RISC) which carries out the process of miRNA-guided RNA degradation and/or mRNA translation suppression (4,5). However, the pace for characterizing miRNA gene promoters and their transcription regulators is severely lagging behind, inserting noise in the process of fully integrating miRNAs in gene regulatory networks.
This state of uncertainty primarily arises due to properties of the miRNA biogenesis pathway. Most mammalian miRNAs are transcribed by Polymerase II (Pol2) machinery (6) resulting in the formation of primary transcripts (pri-miRNAs) of variable length that are 5′ capped and polyadenylated. Hairpin-like structures (pre-miRNAs), embedded in pri-miRNAs, are recognized and cleaved in the nucleus by the microprocessing complex which consists of Drosha and Dgcr8 (7). Pre-miRNAs are transported to the cytoplasm where they undergo the maturation process (8) prior to their incorporation in RISC.
The rapid cleavage of pri-miRNAs by Drosha in the nucleus is a key element that hinders the identification of miRNA genes with conventional sequencing techniques. With the advent of several breakthroughs in Next Generation Sequencing (NGS) technology, the sequencing cost limitation has been removed allowing the scientific community to generate deeply sequenced samples that are able to capture the lowly abundant pri-miRNA transcripts (9,10). Cap Analysis of Gene Expression (CAGE) specifically, is an experimental method that was introduced in 2003 (11) for capturing and quantifying the 5′ ends of capped RNAs. During the last decade, CAGE has been continuously refined and improved, emerging as a well-established protocol for the identification of transcription start sites (TSS) and promoter regions of transcribed loci. The FANTOM Consortium (12) has extensively applied CAGE on hundreds of tissues and cell lines to produce a high-quality annotation of the human and mouse promoterome and characterize regulatory mechanisms of gene expression.
The recent availability of such datasets as well as the continuous updating of landmark repositories such as the ENCODE (13), allowed the development of computational methods that attempt to identify miRNA gene transcription start sites (TSSs) by combining this wealth of experimental data with Machine Learning (14–16). Such in silico approaches are invaluable for the process of creating repositories that index miRNA gene promoters and transcription factors (TFs) that regulate their transcription. DIANA-miRGen v4 aims to explicitly tackle this problem with a holistic approach that includes the combination of multi-omics data with state-of-the-art Machine Learning algorithms and web application technologies, to provide high quality miRNA promoters and TFs that regulate their transcription.
Existing resources for miRNA genes transcription regulation
Publicly available databases addressing the miRNA gene transcription regulation problem such as ChIPBase (17), CircuitsDB (18), TFmiR (19), TMREC (20), TransmiR (21,22) and TSmiR (23) have been extensively reviewed in DIANA-miRGen v3 study (24). They employ various methods for collecting miRNA gene TSSs, with the most frequent strategy involving the grouping of pre-miRNAs into transcriptional units based on their in-between distance (ChIPBase, CircuitsDB), and considering the 5′ end of these units as the group's TSS. However, pri-miRNAs typically exhibit a highly variable size that can span several hundred up to thousands of nucleotides which are difficult to locate with such strategies. Additionally, existing databases index TF:miRNA interactions based on TF motif search in promoters(ChIPBase, CircuitsDB, TFmiR, TMREC, TransmiR, TSmiR), literature text-mining (TMREC, TransmiR) and less frequently on chromatin immunoprecipitation followed by sequencing (ChIP-Seq), an experimental method that provides better accuracy for transcription factor binding site (TFBS) annotation (ChIPBase, CircuitsDB, TSmiR).
DIANA-miRGen v3 (24) pushed the envelope further by incorporating miRNA gene TSSs derived from microTSS algorithm (15) for 428 pre-miRNAs and thousands of TF:miRNA connections based on TF footprints in DNase enriched regions and motif scanning. MicroTSS is a computational method providing accurate intergenic miRNA TSS identification by integrating deeply sequenced RNA-Seq, H3K4me3 and Polymerase II ChIP-Seq as well as open chromatin data as identified by DNase-Seq. However, due to microTSS’s input data requirements, DIANA-miRGen v3 was limited in a handful of tissues and cell lines, leaving plenty of space for future improvements.
What is new in DIANA-miRGen v4?
Aim of DIANA-miRGen v4 (Figure 1) is to build on top of the available high-quality repository of microTSS (15) predictions and significantly expand the collection of miRNA gene TSSs by utilizing the availability of hundreds of cap analysis of gene expression (CAGE) data produced by the FANTOM consortium (10). To this end, ADAPT-CAGE algorithm (16) has been applied on 1027 CAGE samples corresponding to 133 tissues, cell lines and primary cells, resulting in the identification of cell type specific miRNA gene TSSs for 1534 pre-miRNAs (Figure 1A-C). ADAPT-CAGE is a state-of-the-art Machine Learning framework that is trained to distinguish between CAGE signal derived from TSSs and transcriptional noise. It provides annotation-agnostic, highly accurate and single-nucleotide resolution experimentally derived TSSs on a genome-wide scale by only utilizing aligned CAGE tags and the underlying genomic sequence. To further expand the TF:miRNA repertoire (Figure 1D–F), 368 ChIP-Seq samples for 94 TFs and 61 DNase-Seq datasets were downloaded from the ENCODE (9) repository. DNase-Seq samples were specifically subjected to the TF footprinting identification process prior to motif scanning of footprint loci using position weight matrices (PWMs) from JASPAR (25). Entries from DIANA-miRGen v3 related to TF:miRNA interactions have been imported to the new database and links to the previous release facilitate the interconnection between the two versions.

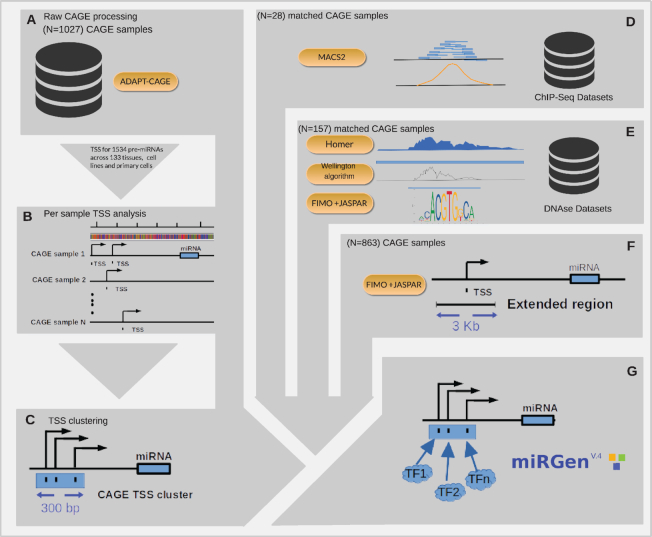
Overview of DIANA-miRGen v4 pipeline based on a bipartite strategy that involves raw CAGE signal filtering and the annotation of TFBSs. In the first part of the pipeline, (A) all CAGE samples (N = 1027) available in the FANTOM repository were processed with ADAPT-CAGE for filtering out signals corresponding to transcriptional noise from 133 human tissues, cell lines and primary cells. (B) Putative miRNA gene TSSs were subsequently selected from the remaining CAGE peaks that localized within a region that spans up to 150 kb upstream of 1534 pre-miRNAs annotated in miRBase v22.1 (C) CAGE-derived TSS events with in-between distances <300 bp were merged into TSS clusters, regardless of the originating cell type. In the second part of the pipeline, (D) TF ChIP-Seq datasets from ENCODE that match to 28 CAGE samples were processed with macs2 to identify experimentally validated TFBSs in miRNA gene promoters. Additionally, (E) DNase-Seq datasets matching 157 CAGE samples were subjected to footprinting extraction with Homer and Wellington to characterize TFBS with experimental support from open chromatin data. Lastly, (F) for the remaining 863 CAGE samples, the identification of miRNA gene promoter associated TFBSs was achieved with TF motif scanning within a 3kb window surrounding CAGE-derived TSSs. (G) The results from these diverse types of analyses are seamlessly integrated in the DIANA-miRGen v4 database and can be accessed through the redesigned web interface, facilitating ease-of-use, advanced queries and connections to external resources.
The database schema was expanded to enable the significant increase of hosted data and support the necessary scalability as well as speed-up for complex queries (Figure 1G). The database access was built on top of the intuitive web-interface of DIANA-miRGen v3, aiming to keep changes to the users’ experience as minimal as possible (Figures 2 and 3). At the same time, more metadata were added such as extensive descriptions for all utilized FANTOM samples, TF expression levels based on CAGE, three levels of supported TF binding sites (ChIP-Seq, DNase-Seq footprints and pure motif search) and miRNA or tissue/cell centric queries. Information regarding the function of miRNAs and TFs in physiological and pathological conditions as well as the connection between DIANA-miRGen, UCSC genome browser (26) and other DIANA resources (3,27–30) is still accessible.
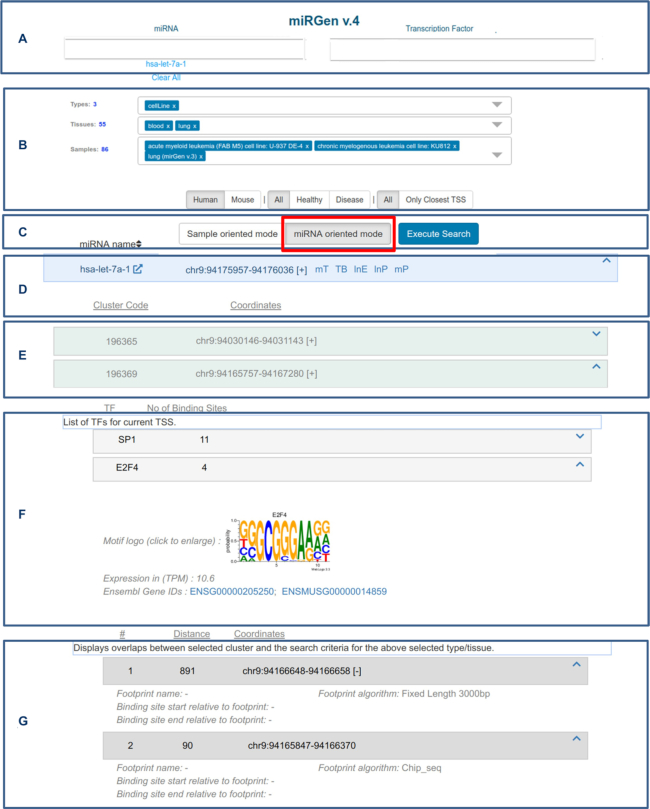
Web interface visualization of the miRNA oriented query mode results. (A) Search fields to query for single or multiple miRNAs and/or TFs. The underlying miRNA nomenclature is based on the hairpin miRBase naming standards. TF names were derived JASPAR 2018. (B) Options for filtering results based on supported species, sample type (tissue, cell line and primary cell), healthy/disease status and retrieval of all TSSs or only the ones closest to the corresponding pre-miRNAs. (C) Options for selecting between the two query modes. Results can be retrieved after pressing the ‘Execute Search’ button. (D) Results’ main panel (one per hairpin) with pre-miRNA related information and interconnection with other DIANA resources. (E) Sub panels with TSS cluster related information. (F) Panel with metadata related to TFs that were found to bind in the region surrounding the corresponding TSS cluster. The number next to the TF’s name indicates the number of identified binding sites. Motif logo of TF binding preference, expression level and links to Ensembl can be viewed directly below the sub panel. (G) Detailed information related to each TFBS such as absolute and relative coordinates to the cluster and level of support (ChIP-Seq, DNase-Seq footprinting and motif scanning).
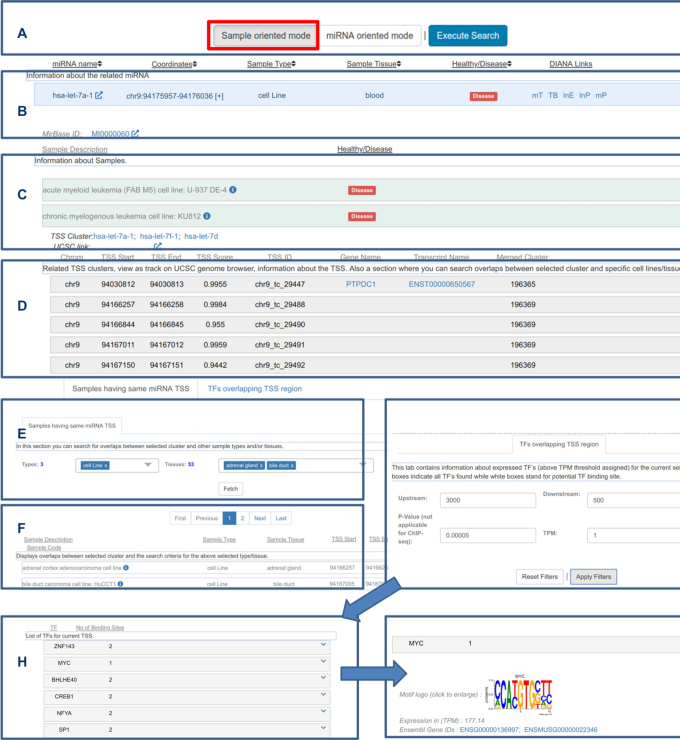
Web interface visualization of the sample oriented query mode results. (A) Results can be viewed after selecting the ‘sample oriented mode’ filter and pressing the ‘Execute Search’ button. See Figure 2 for information related to selecting miRNAs, TFs, cell types and healthy/disease status. (B) Results’ main panel (one per hairpin) with information related to the pre-miRNA, type and source tissue as well as healthy/disease status of samples with at least one TSS identified in the 150kb search space upstream of the hairpin, and interconnection with other DIANA resources. (C) Expandable sub panels with information about each sample, pre-miRNAs sharing the same TSS and link to view the results on UCSC genome browser. (D) Upon expanding the sample's sub panel, the inner tier of TSS panels can be accessed, hosting the genomic coordinates, expression level and hosting protein coding gene in case of intragenic pre-miRNAs. The expansion of each TSS panel leads to two tabs. (E, F) One assists users in retrieving other samples that also support a transcription initiation event closeby to the expanded TSS. (G–I) The other, similar to Figure 2F, G, provides access to TFBSs in a user-defined region around the expanded TSS based on TF expression level and FIMO P-value filtering options.
METHODS AND RESULTS
Annotation of miRNA TSSs
1027 CAGE samples aligned on hg38, corresponding to 306 cell line, 178 tissue and 543 primary cell samples, were downloaded from FANTOM (10) public repository. In the case of time-course samples, only the 0 h files were downloaded. Each file was enriched with several types of meta-data such as the FANTOM sample id, category (tissue, primary cells or cell line), condition (physiological or pathological) and origin (i.e. blood, bladder etc). The latter was also utilized as the piece of information connecting CAGE and ChIP-Seq samples (see transcription factor expression analysis section).
There is increasing evidence in the literature that besides transcription initiation events, CAGE also identifies capping sites along various locations of transcribed loci such as different splicing products, isoforms and capped molecules that can be summed up as transcriptional noise (31–33). Only a portion of regions enriched in CAGE signal typically overlap with the surrounding region of annotated TSSs. Therefore, for the purposes of this study, an intermediate step for pre-processing CAGE datasets is required prior to miRNA gene TSS identification. To this end, ADAPT-CAGE (16) algorithm was applied on every CAGE dataset that was downloaded from FANTOM’s repository. ADAPT-CAGE is able to accurately distinguish between CAGE tag-clusters that represent transcription initiation events and tag-clusters that belong to the transcriptional noise category. The algorithm utilizes Machine Learning to take advantage of the observed differences in the profile of structural DNA features (34–37) and Polymerase II related TF motifs between promoter and non-promoter genomic regions. After applying ADAPT-CAGE, a score cutoff of 0.5 was used to produce the final results that can be summed up to 29 806 351 TSSs for all 1027 FANTOM samples. Tag-clusters with a distance less than 300 bp from one-another were merged into a single transcription initiation event (TSS cluster). The information regarding each member of TSS clusters is retained and it is accessible through the web interface.
For the characterization of miRNA gene TSSs, all human pre-miRNAs from miRBase v22.1 (38) were downloaded. It has been previously shown that pri-miRNA transcripts can sometimes exhibit sizes of more than 100 kb (15). In DIANA-miRGen v4, all putative CAGE-derived miRNA gene TSSs are selected within a region starting at the location of each pre-miRNA and spanning up to 150 kb upstream. All CAGE tag-clusters passing ADAPT-CAGE’s score cutoff and located in this search space are flagged as putative miRNA gene TSSs in the database. The CAGE tag-cluster that is closest to each pre-miRNA is highlighted as the corresponding miRNA gene TSS in the web interface, by default. However, our strategy of reporting all CAGE tag-clusters within the 150 kb search space facilitates studies related to alternative transcription initiation and/or tissue-specific promoter usage for miRNA genes. Pre-miRNAs located in protein coding gene introns may share a promoter with the host gene or have their promoter located in the same intron. The aforementioned search space strategy of 150kb is capturing both cases.
Analysis of ChIP- and DNase-Seq datasets
The generation of the TF:miRNA atlas hosted in DIANA-miRGen v4 was based on a three-step strategy. Initially, ChIP-Seq datasets for 94 TFs (Supplementary Table S1) were downloaded from the ENCODE public repository (9). For cases where peak files have not been generated by the ENCODE Consortium, we utilized Macs2 (39) with default parameters to identify loci enriched in ChIP-Seq signal. The transformation of genomic coordinates from earlier versions of the human genome to GRCh38 was achieved with UCSC liftover software (26).
Even though the number of TF ChIP-Seq samples in ENCODE is high, the tissue diversity of samples for each TF is low. Typically, a handful of TFs are studied exhaustively, while the majority of the remaining TFs in ENCODE are studied in a single tissue, cell line or primary cell type. To avoid this limitation and further expand our TF:miRNA collection, we also analysed chromatin accessibility data. We downloaded 61 DNase-seq samples from ENCODE (9) covering 25 tissues, 14 cell lines and 22 primary cell types (Supplementary Table S2). Homer (40) (size = 1000 minDist = 2500 o = auto tbp = 0) was utilized to characterize genomic loci enriched in DNase-Seq signal with a false discovery rate (FDR) threshold of 1%. Subsequently, Wellington algorithm (41) was applied on the identified accessible regions and the raw DNase-Seq signal to identify TF footprints using a P-value threshold of 10−8. The connection between footprints and the occupying TF was achieved by scanning the sequence corresponding to footprints with the non-redundant TF motifs in JASPAR (25) using FIMO algorithm from MEME suite (42) with a P-value threshold of 10−5.
FANTOM (10) repository hosts 1027 CAGE samples. Consequently, a big portion (N = 863) of these samples will not match to any ChIP- or DNase-Seq dataset in ENCODE (9). To generate TF:miRNA connections for such cases as well as for samples with ChIP- and/or DNase-Seq support (for completeness of the computational pipeline), we utilized FIMO and the previously aforementioned JASPAR TF motifs to scan a predefined area of 3 kb centered on TSS clusters as identified by ADAPT-CAGE algorithm (see analysis of CAGE samples and miRNA gene TSS identification section). The results of the three-step strategy described in this section are fully accessible by the user through the web interface as well as appropriate metadata that highlight the level of support (ChIP-Seq, footprinting and motif scanning) for each reported TFBS.
Transcription factor expression analysis
GRCh38 reference annotation was downloaded from Ensembl (43). For every sample in FANTOM, the normalized (tags per million - TPM) number of CAGE reads overlapping the regions centered around (±500 bp (44)) the annotated TF gene TSSs was utilized to quantify TF expression levels (12). This information is a crucial component of DIANA-miRGen v4 functionality since the appropriate tissue, cell line or primary cell type specific TF:miRNA connections depend on it. Additionally, users are able to filter queried results based on the desired TF expression level.
Database and web interface development
The existing relational schema implemented for DIANA-miRGen v3 was extended to facilitate the new data. New indices were created to ensure fast query execution. PostgreSQL RDBMS v10 is used to host the database. A new backend was developed using Java Spring framework and .NET Core 2.2. The interface was implemented using Angular v8 with bootstrap 3 CSS. A special effort was made to keep the main look and feel as close as possible to DIANA-miRGen v3 to allow the unhindered transition between the two releases for existing users. Explanatory tooltips and legends were added in various places of the tool so that users can have a quick reference on the part of data they are working on. The hairpin and TF search fields were re-designed to extend the existing functionality. The proposed ids do not include those already selected, thus speeding up the search process by providing less and less options. Furthermore, users can add multiple ids to those search fields by pasting a list of ids separated with commas. We added paging and sorting capabilities to all levels of information. Finally, we moved secondary sample and TF fields to the inner levels to provide a finer search experience, by allowing different search options for each TSS/Cluster.
Tissue-specific analysis of TFs regulating miRNA gene expression
Aim of miRGen is to aggregate as much information as possible regarding miRNA gene promoters and their regulators, and organize this plethora of data intuitively, thus enabling the research community to study gene regulatory networks with increased resolution. As an example of a miRGen use-case, we proceeded with a meta-analysis of intergenic and intragenic miRNA gene regulators in 11 cell types where we found a match between CAGE and TF ChIP-Seq datasets (Supplementary Figure S1, Supplementary Table S3).
Out of the 1027 CAGE samples, 28 exhibit matching TF ChIP-Seq data from ENCODE and were arranged in eleven (11) cell-line/tissue groups (Table 1). The miRNA gene promoters were defined as a −3 kb/+1 kb window around the most proximal CAGE peak that was identified as valid TSS by ADAPT-CAGE. Subsequently, the promoters were divided into intergenic and intragenic categories based on the miRNA genomic localization. TFBSs were enumerated by calculating the overlap between TF ChIP-Seq peaks with the CAGE derived promoters. Since group 4 only has 1 TF ChIP-Seq dataset, we did not include it in the figures.

| Group | FANTOM id | #TFs | Cell type | Description |
|---|---|---|---|---|
| Group 1 | CNhs12331 CNhs12332 CNhs12333 | 50 | GM12878 | B lymphoblastoid cell line |
| Group 2 | CNhs11943 | 29 | MCF7 | Breast carcinoma cell line |
| Group 3 | CNhs11250 CNhs12334 CNhs12335 CNhs12336 | 60 | K562 | Chronic myelogenous leukemia cell line |
| Group 4 | CNhs11047 CNhs11046 | 1 | NA | Embryonic kidney cell line |
| Group 5 | CNhs10872 CNhs11967 CNhs12010 | 5 | NA | Endothelial Cells - Umbilical |
| Group 6 | CNhs12325 CNhs12327 CNhs12326 | 24 | HelaS3 | Epitheloid carcinoma cell line |
| Group 7 | CNhs14067 CNhs14068 CNhs13964 | 23 | H1 | H1 embryonic stem cells differentiation to CD34+ HSC |
| Group 8 | CNhs12328 CNhs12329 CNhs12330 | 32 | HepG2 | Hepatocellular carcinoma cell line |
| Group 9 | CNhs12458 CNhs12684 CNhs12786 | 60 | K562 | K562 erythroblastic leukemia response to hemin |
| Group 10 | CNhs10624 CNhs11798 | 10 | NA | Liver adult |
| Group 11 | CNhs11275 | 15 | A549 | Lung adenocarcinoma cell line |
Based on this analysis,observe similarities in the mixture of top-10 TFs between groups that belong in the same lineage such as the hematopoietic cluster (groups 1, 3, 5 and 9) (Supplementary Figure S1). Especially group 3 (granulocytes from chronic myelogenous leukemia) and group 9 (erythroblasts from chronic myelogenous leukemia), they exhibit an almost identical top-10 TF binding profile (Supplementary Figures S1B and F). Additionally, CREB, MAX and MYC were found to be the top regulators of both intergenic and intragenic miRNA gene promoters in MCF7 cells, as expected by surveying the literature (45,46). Interestingly, CTCF was found in the top-10 TFs of all groups except 2 and 6. CTCF is a TF known for its multiple roles and especially for its function as an anchor for the creation of topologically associating domains and chromatin conformation (47).
INTERFACE
Formulating queries to the database
The significant increase in data, compared to the previous version, is hosted in the database schema of DIANA-miRGen v3 (24) that has been slightly modified to facilitate new data and metadata as well as more complex queries. The plethora of information that is hosted in the database includes miRNA metadata regarding implications in physiological and pathological conditions from the literature, miRNA localization, CAGE-derived miRNA gene TSSs filtered by ADAPT-CAGE algorithm, computationally and experimentally derived TFBS in miRNA promoter regions as well as TF expression levels.
Two different approaches were implemented for querying the information hosted in the database (Figures 2 and 3). The first approach is miRNA and/or TF oriented (Figure 2). Users can type their favorite miRNA and/or TF (Figure 2A) and apply several filters prior to search execution such as selecting for human or mouse results, disease or healthy samples and the retrieval of all or just the closest TSS within the 150 kb region upstream of each miRNA (Figure 2B). The results can be further processed in real-time based on three additional filters related to sample type (cell line, primary cells and tissue), tissue specificity and biological or technical replicate number (Figure 2B). The idea behind this query approach is that TSSs are clustered across samples based on their in-between distance to highlight putative alternative miRNA gene promoter usage. The information regarding samples that participated in creating the across-samples TSS clusters is retained in the interface and can be further manipulated to include or exclude samples from this process.
The second query approach is sample oriented (Figure 3). The same input terms and filtering options, as described above, need to be used prior to search execution. However, in this query mode, the information regarding every sample specific TSS is returned and can be accessed independently from the web interface (Figure 3A–C). Within each sample specific TSS panel, users are still able to access the information that is generated by the first query strategy, that is groups of samples with TSSs localized in small distances. Essentially, users are able to access all the hosted information regardless of the chosen query mode. However, each mode provides a unique search path that answers different biological questions, or in other terms, investigating the same data from different perspectives.
Query results and available options
In the previous section, the two operating modes were introduced, highlighting two different query mechanisms. Regardless of the selected mode, the information is grouped and visualized in similar ways in the web interface. Pre-miRNAs sit at the top of the results’ hierarchy, each one in its own unique panel (main results panel) with information related to hairpin name, genomic coordinates and interconnection to other DIANA Lab web servers and databases (Figure 2D). In the case of sample oriented query mode, the main panel also hosts information related to sample type, tissue name and healthy or disease status (Figure 3B).
In the miRNA oriented query mode, users can expand the main panel for each miRNA to further explore the results. For every TSS cluster there is a different sub panel hosting the cluster's name and genomic coordinates (Figure 2E). These sub panels can also be expanded and users can access information related to the samples contributing to the formation of a given cluster as well as TFs that are localized in a user-defined region around each identified TSS (Figure 2F, G). TF binding events can be specifically filtered based on their distance from TSSs, level of gene expression and statistical significance of the footprinting process and/or motif scanning.
In the sample oriented query mode, users can expand the main panel described above to explore each cell-specific TSS individually (Figure 3D). Sub panels hosting sample related information can be expanded to access the final layer of panels, one for every identified TSS, showing their genomic coordinates, host gene name and ensembl id (for intragenic pre-miRNAs), other samples with TSSs in the local vicinity and nearby TFBSs as previously described (Figure 3E–I).
CONCLUSION
DIANA-miRGen v4 has evolved into the most comprehensive repository for miRNA gene regulation, hosting thousands of experimental data that connect miRNA genes and TFs regulating their transcription. The latest version of miRGen database is based on a state-of-the-art Machine Learning algorithm (16) to remove transcriptional noise from >1027 CAGE samples available in FANTOM (10), and characterize cell type specific TSSs for 1534 pre-miRNAs. In addition, the majority of TF ChIP- (N = 368) and DNase-Seq (N = 61) ENCODE (9) samples were reanalyzed and incorporated in the database facilitating a tier-based experimental evidence for TF:miRNA interactions. The database schema from the previous release was modified accordingly to support the increase in hosted data and more complex queries and the web interface was completely redesigned aiming to offer ease-of-use, advanced filtering, scalability and most importantly two mechanisms that enable the exploration of available data from different perspectives related to different biological questions. DIANA-miRGen v4 has surpassed previous releases as well as other miRNA gene regulation databases by offering high quality experimentally derived miRNA gene TSSs and TFBSs from multiple sources in thousands of samples, bringing the community one step closer to the complete integration of miRNAs in gene regulatory networks.
SUPPLEMENTARY DATA
Supplementary Data are available at NAR Online.
FUNDING
‘ELIXIR-GR: The Greek Research Infrastructure for Data Management and Analysis in Life Sciences’ [MIS 5002780], which is implemented under the Action ‘Reinforcement of the Research and Innovation Infrastructure’, and ‘Metalasso: A platform for computational meta-analysis of Genome Wide Association Studies-GWAS’ [MIS 5032832], which is implemented under the Action ‘Research-Create-Innovate’, both funded by the Operational Programme ‘Competitiveness, Entrepreneurship and Innovation’ [NSRF 2014–2020] and co-financed by Greece and the European Union (European Regional Development Fund); Postdoc@MUNI [CZ.02.2.69/0.0/0.0/16_027/0008360 to G.K.G.]; I.K.s postdoctoral research was carried out under the call ‘call for interest for postdoctoral researchers, scholarship for postdoctoral research’ of University of Thessaly, that is implemented by University of Thessaly and funded by the ‘Stavros Niarchos Foundation’. Funding for open access charge: project ‘Metalasso’.
Conflict of interest statement. None declared.
REFERENCES
2.
3.
4.
5.
6.
7.
8.
9.
10.
11.
12.
13.
14.
15.
16.
17.
18.
19.
20.
21.
22.
23.
24.
25.
26.
27.
28.
29.
30.
32.
33.
34.
35.
36.
37.
38.
39.
40.
41.
42.
43.
44.
46.