 RJunBase: a database of RNA splice junctions in human normal and cancerous tissues
Nucleic Acids Research


The authors wish it to be known that, in their opinion, the first two authors should be regarded as Joint First Authors.

- Altmetric
Splicing is an essential step of RNA processing for multi-exon genes, in which introns are removed from a precursor RNA, thereby producing mature RNAs containing splice junctions. Here, we develope the RJunBase (www.RJunBase.org), a web-accessible database of three types of RNA splice junctions (linear, back-splice, and fusion junctions) that are derived from RNA-seq data of non-cancerous and cancerous tissues. The RJunBase aims to integrate and characterize all RNA splice junctions of both healthy or pathological human cells and tissues. This new database facilitates the visualization of the gene-level splicing pattern and the junction-level expression profile, as well as the demonstration of unannotated and tumor-specific junctions. The first release of RJunBase contains 682 017 linear junctions, 225 949 back-splice junctions and 34 733 fusion junctions across 18 084 non-cancerous and 11 540 cancerous samples. RJunBase can aid researchers in discovering new splicing-associated targets and provide insights into the identification and assessment of potential neoepitopes for cancer treatment.
INTRODUCTION
The majority of human pre-mRNAs contain more than one exon and the process of pre-mRNA splicing, which removes introns and joins exons, is crucial for the maturation of functional mRNAs (1,2). Alternative splicing (AS) is a key factor of enlarging the transcriptome and proteome, allowing mammalian cells to generate distinct protein isoforms from a single gene. The splicing process is accomplished by a megadalton complex of RNAs and proteins that comprises five small nuclear ribonucleoprotein particles (snRNPs; U1, U2, U4, U5 and U6) and >200 splicing regulators (2). High-throughput sequencing-based methods and their applications in the study of transcriptomes have revolutionized our understanding of RNA splicing in a large number of diseases, especially in human cancers (3). Recent studies on transcriptomic profiling indicated that dysregulated splicing events are widespread in human cancers (4,5), and tumor-specific AS events can contribute to the initiation and progression of cancer, representing potential targets for cancer treatment (6,7). For example, Li et al. demonstrated that a splicing switch from ketohexokinase-C to ketohexokinase-A could drive hepatocellular carcinoma formation, which is dependent on c-Myc and heterogeneous nuclear ribonucleoproteins (8). Furthermore, based on the analysis of RNA splice junctions of tumor cells and tissues, tumor-specific transcripts (TSTs) have been shown to be overexpressed in several malignant tumors (9,10). These newly identified TSTs, such as LIN28B-TST and TST1, play key roles in carcinogenesis, and their high expression is correlated with worse overall survival of cancer patients (10,11). Moreover, the tumor-specific neoepitopes derived from splice junctions can represent promising targets for immunotherapy (12). Therefore, knowledge advances in these research fields have emphasized the need for a coordinated, community-based effort to construct public data resources that can systematically annotate and integrate important information regarding splicing patterns and functions. A compendium of these splice junctions will aid researchers in deciphering tumor heterogeneity at the junction level and support the discovery of new splicing-related targets.
To date, several RNA splicing databases have been developed with different purposes. For example, an exon-exon junction database (JuncDB, http://juncdb.carmelab.huji.ac.il/) was established for the comparison of architectures between orthologous transcripts across 88 eukaryotic species (13). Nellore et al. aligned 21,504 Illumina-sequenced human RNA samples and found 56 861 unannotated novel junctions, which were made available on the intropolis database (http://intropolis.rail.bio) (14). In the scope of human cancers, Xia et al. created the CSCD database (http://gb.whu.edu.cn/CSCD) to provide a visual interface for exploring the function and regulation of cancer-specific circRNAs based on cancer cell lines (15). Additionally, the FusionGDB database (https://ccsm.uth.edu/FusionGDB) also offers an integrative resource of gene fusions, including cancer-associated transcript fusions across all cancers (16). Ryan et al. developed the TCGASpliceSeq database (http://bioinformatics.mdanderson.org/TCGASpliceSeq) for exploring the AS patterns of The Cancer Genome Atlas (TCGA) tumors (17). Although these databases offer insightful information on RNA splicing, there is still a lack of a convenient database for analyzing various forms of splice junctions (linear, back-splice, and fusion junctions), potentially tumor-specific junctions, and unannotated junctions in human tissues.
In this study, we developed a web-accessible database, named RJunBase, to provide information on three types of RNA splice junctions that are derived from RNA-seq data of various non-cancerous and cancerous samples. This tool aims to help users search for their desired targets and obtain information about their splice patterns and expression profile. The whole dataset was designed to be easily browsed, queried, and downloaded through its webpage. In addition, RJunBase is expected to allow researchers submit new splice junctions and their expression profiles of human samples.
MATERIALS AND METHODS
Identification of linear junctions
We collected RNA-seq data of 10 283 samples containing primary, metastatic, and normal tissues across 33 cancer types from TCGA and obtained linear junction data from datasets stored at the Genotype-Tissue Expression (GTEx) portal (18). Metastatic and primary samples were considered to be in the same class as cancer samples. TCGA BAM files were aligned to the GRCh38 reference genome using a two-pass method with STAR algorithm. StringTie (version 1.2.3) was used to assemble the BAM files for all samples (19). Linear junctions were identified, quantified, and normalized based on the StringTie output file using the Assembling Splice Junctions Analysis (ASJA) software package, which identifies and characterizes all splice junctions from high-throughput RNA-seq data (9). Raw count data obtained from GTEx were normalized according to: raw_counts/sum_counts × 10 000 000 (sum_counts represent the sum of the counts of all samples), with the scale factor being the same as that adopted by ASJA. We removed all junctions that were present in fewer than two samples of GTEx and TCGA. Gene annotations were downloaded in the GFF/GTF format from GENCODE database (release 29, https://www.gencodegenes.org). Linear junctions were matched onto gene coordinates using the genomic intersection functionality of BEDTools (https://bedtools.readthedocs.io/) and were further classified as intragenic or intergenic junctions. All junctions were annotated with gene information, and junctions in the intergenic region were annotated with information of the downstream gene. In addition, oncogene and tumor suppressor gene annotations were derived from ONGene (20) and TSGene (21), and were pooled together and named tumor-associated genes. Junctions from tumor-associated genes were labeled as ‘yes’ in ‘Tumor associated genes’ column in the RJunBase. Five types of alternative splice junctions (intron retention, exon skipping, mutually exclusive exons, alternative 3′, and alternative 5′ splice) were extracted from a paper published by André Kahles et al. (4). The genomic coordinates of alternative splice junctions were converted from hg37 to hg38 using the University of California Santa Cruz (UCSC) LiftOver tool.
The unannotated junctions were defined as the junctions that are not annotated in GENCODE. To obtain high-confidence unannotated junctions, we removed those unannotated junctions that were expressed in <10 samples. The majority of the unannotated junctions (89.45%) contained the canonical splice site (GT-AG).
The junctions were identified as tumor-specific junctions when the following criteria were met: NT_max = 0 & nTE_max = 0 & Freq_tumor > 5%; or Tumor_median > 10 * NT_max & Tumor_median > 10 * nTE_max & Freq_tumor > 5%. Tumor_median is the median expression value of tumor samples, NT_max is the maximal expression value of TCGA normal samples, nTE_max is the maximal expression value of GTEx normal tissues, and Freq_tumor is the frequency of junctions expressed in the cancer.
Collection of back-splice and fusion junctions
The location and expression information of back-splice junctions from over 2000 samples across 27 cancer types were obtained from MiOncoCirc database (https://mioncocirc.github.io/) (22). The total number of back-splice reads for every sample was calculated. The majority of these samples contained 1200–730 000 back-splice reads. Only 37 samples contained <1000 back-splice reads, which were considered to be low-quality data. Therefore, they were filtered to prevent any impact on the subsequent analyses. MiOncoCirc included 25 normal samples, which were removed and not included in the RJunBase for the extreme imbalance between cancer and normal sample sets. Samples with ambiguous classification were also removed. The novel read-through circRNA junctions involving two different genes were not included in the RJunBase because of the lack of detailed expression data.
Fusion junctions were downloaded from a previous report published by Dehghannasiri et al. (23). They developed the DataEnriched Efficient PrEcise STatistical (DEEPEST) fusion detection algorithm (https://github.com/salzmanlab/DEEPEST-Fusion) to detect gene fusions emerging at annotated exon boundaries. This algorithm used RNA-seq fastq files from 9946 TCGA samples as input data and identified over 30 000 fusions. Gene information for the two types of junctions in the RJunBase was then annotated based on the GENCODE database (release 29). The expression of fusion junctions were standardized as linear junctions according to: raw_counts/sum_cov × 10 000 000 (sum_cov: sum coverage of samples). The expression frequency (and corresponding sample number) and median value in cancer cohorts were calculated for each back-splice and fusion junction.
Visualization of the splicing pattern and expression profile
We used a custom python-based script to plot all relevant forward- and back-splice junctions for each gene. Hosting genes of fusion junctions were efficiently and flexibly visualized in a circular layout using the R software package ‘circlize’ (24), and the gene length was scaled to 100 bp to facilitate graphical representation. The expression profile was depicted using the ‘ggplot2’ R package. We stratified samples in the same cancer cohort into two groups (high and low expression groups) under the median (or mean) of junction expression values. The Kaplan–Meier survival curves were plotted using ‘ggplot2’.
Names of the three junctions types
A unique name was provided for all junctions. Linear, fusion, and back-splice junction types were named as LS, FS, BS, respectively. Unannotated junctions were named as UN. UP means junction locate in the upstream region of neighbor genes. Annotated linear junctions in the intragenic region were named as Genename_LS+ID, where Genename is the hosting gene of the junction and ID is the rank number of the annotated junctions according to genomic location for that hosting gene. Unannotated linear junctions in intragenic regions were named as UN_Genename_LS+ID, where ID is the counterpart of the unannotated junctions for that hosting gene. Linear junctions in intergenic regions were named as UN_Genename_LS_UP+ID, where Genename is the downstream gene of the junction, and ID is the rank number of unannotated junctions according to genomic location. Intergenic junctions were annotated with information of downstream genes as a large part of these junctions was generated by alternative promoters, which are located in the upstream region of neighbor genes. A similar phenomenon has been reported by Demircioğlu et al. (5). Back-splice junctions were named as Genename_BS+ID. Fusion junctions were named as Genename1-Genename2_FS+ID, where Genename1 and Genename2 are the two hosting genes of the junction.
Database implementation
The RJunBase was built using MySQL (database server) and Akka 2.6.3 (web server). All data were handled and organized into a MySQL Database Management System (version 5.7). The interface of the website was designed and achieved using the Twirl template engine. The query system for the database was based on Scala script. The website was tested in several distinct popular web browsers such as Google Chrome, Firefox, and Internet Explorer.
RESULTS
Data summary
RJunBase collects and integrates three types of splice junctions from different non-cancerous and cancerous human tissues (Figure 1). The current version of RJunBase comprises 682 017 linear junctions, 225 949 back-splice junctions and 34 733 fusion junctions, covering a total of 29 624 samples from the TCGA (10 283 samples), GTEx (17 382 samples) and MiOncoCirc (1959 samples) databases. RJunBase also includes 324 651 unannotated junctions and 32 837 tumor-specific junctions. The results of the detected linear and fusion junctions from TCGA samples and the linear junctions from GTEx are summarized in Tables 1 and 2, respectively. The numbers of back-splice junctions are summarized in Table 3. The Supplementary Table S1 provides the abbreviations and full names for all 47 cancer types included in the RJunBase database.

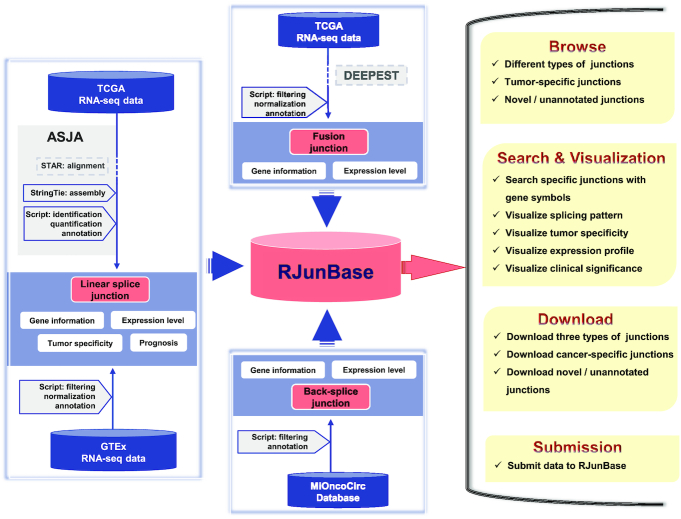
Data generation flow of RJunBase. RJunBase collects and extracts linear, back-splice, and fusion junctions from available data resources. The linear junctions in cancer tissues were extracted from the Cancer Genome Atlas (TCGA) BAM files using the Assembling Splice Junctions Analysis (ASJA) software package. The linear junctions in normal tissues were directly collected from the Genotype-Tissue Expression (GTEx) database. Fusion junctions were derived from Dehghannasiri et al. study, which was based on TCGA RNA-seq data and the DataEnriched Efficient PrEcise STatistical fusion detection (DEEPEST) algorithm. Back-spliced junctions were obtained from the MiOncoCirc database. All splice junctions in RJunBase were quantified and annotated. Contents of the RJunBase database include Browse, Search and Visualization, Downloads, and Submission.

| Cancer type | Sample numbera | Cancer numberb | NT numberc | LJ numberd | FJ numbere | AJ numberf | UN numberg |
|---|---|---|---|---|---|---|---|
| ACC | 79 | 79 | 0 | 167 995 | 334 | 133 087 | 34 907 |
| BLCA | 433 | 414 | 19 | 414 850 | 1 588 | 215 258 | 199 591 |
| BRCA | 552 | 458 | 94 | 465 831 | 6 935 | 222 871 | 242 959 |
| CESC | 306 | 306 | 0 | 346 688 | 573 | 197 634 | 149 053 |
| CHOL | 45 | 36 | 9 | 156 137 | 80 | 129 851 | 26 285 |
| COAD | 518 | 480 | 38 | 381 256 | 355 | 189 084 | 192 171 |
| DLBC | 48 | 48 | 0 | 147 193 | 55 | 117 191 | 30 001 |
| ESCA | 172 | 162 | 10 | 444 738 | 1 609 | 156 997 | 287 740 |
| GBM | 172 | 167 | 5 | 299 625 | 651 | 180 052 | 119 572 |
| HNSC | 546 | 502 | 44 | 412 916 | 986 | 210 633 | 202 282 |
| KICH | 89 | 65 | 24 | 203 201 | 42 | 151 461 | 51 739 |
| KIRC | 607 | 535 | 72 | 442 970 | 421 | 216 856 | 226 113 |
| KIRP | 321 | 289 | 32 | 317 241 | 270 | 190 222 | 127 018 |
| LAML | 151 | 151 | 0 | 266 377 | 166 | 140 441 | 125 935 |
| LGG | 479 | 479 | 0 | 352 478 | 997 | 193 561 | 158 916 |
| LIHC | 423 | 373 | 50 | 360 938 | 944 | 187 007 | 173 930 |
| LUAD | 585 | 526 | 59 | 463 878 | 1 962 | 223 334 | 240 543 |
| LUSC | 527 | 478 | 49 | 473 335 | 1 895 | 225 184 | 248 150 |
| MESO | 86 | 86 | 0 | 192 064 | 170 | 146 617 | 45 446 |
| OV | 346 | 346 | 0 | 517 418 | 3 368 | 116 259 | 401 158 |
| PAAD | 182 | 178 | 4 | 289 682 | 223 | 179 089 | 110 592 |
| PCPG | 186 | 183 | 3 | 227 760 | 167 | 157 069 | 70 690 |
| PRAD | 552 | 500 | 52 | 368 670 | 2 045 | 197 897 | 170 772 |
| READ | 177 | 167 | 10 | 214 140 | 175 | 151 440 | 62 699 |
| SARC | 265 | 263 | 2 | 335 523 | 2 885 | 198 122 | 137 400 |
| SKCM | 472 | 471 | 1 | 395 984 | 1 724 | 208 472 | 187 511 |
| STAD | 405 | 373 | 32 | 544 749 | 2 846 | 117 382 | 427 366 |
| TGCT | 156 | 156 | 0 | 278 687 | 106 | 183 344 | 95 342 |
| THCA | 561 | 503 | 58 | 365 678 | 275 | 194 155 | 171 522 |
| THYM | 119 | 119 | 0 | 235 115 | 64 | 161 858 | 73 256 |
| UCEC | 587 | 552 | 35 | 421 263 | 1 002 | 209 023 | 212 239 |
| UCS | 56 | 56 | 0 | 193 121 | 443 | 149 924 | 43 196 |
| UVM | 80 | 80 | 0 | 148 517 | 37 | 121 894 | 26 622 |
ACC, adrenocortical carcinoma; BLCA, bladder urothelial carcinoma; BRCA, breast invasive carcinoma; CESC, cervical squamous cell carcinoma and endocervical adenocarcinoma; CHOL, cholangiocarcinoma; COAD, colon adenocarcinoma; DLBC, lymphoid neoplasm diffuse large B-cell Lymphoma; ESCA, esophageal carcinoma; GBM, glioblastoma multiforme; HNSC, head and neck squamous cell carcinoma; KICH, kidney chromophobe; KIRC, kidney renal clear cell carcinoma; KIRP, kidney renal papillary cell carcinoma; LAML, acute myeloid leukemia; LGG, brain lower grade glioma; LIHC, liver hepatocellular carcinoma; LUAD, Lung adenocarcinoma; LUSC, lung squamous cell carcinoma; MESO, mesothelioma; OV, ovarian serous cystadenocarcinoma; PAAD, pancreatic adenocarcinoma; PCPG, pheochromocytoma and paraganglioma; PRAD, prostate adenocarcinoma; READ, rectum adenocarcinoma; SARC, sarcoma; SKCM, skin cutaneous melanoma; STAD, stomach adenocarcinoma; TGCT, testicular germ cell tumors; THCA, thyroid carcinoma; THYM, thymoma; UCEC, uterine corpus endometrial carcinoma; UCS, uterine carcinosarcoma; UVM, uveal melanoma.
aSample number: total number of samples studied for each cancer type.
bCancer number: number of cancer samples.
cNT number: number of paracancer samples.
dLJ number: number of linear junctions extracted from each cancer type.
eFJ number: number of fusion junctions extracted from each cancer type.
fAJ number: number of annotated junctions in linear junctions.
gUN number: number of unannotated junctions in linear junctions.
| Tissue | Sample number | Linear junction number |
|---|---|---|
| Blood | 929 | 314 347 |
| Stomach | 359 | 313 525 |
| Colon | 779 | 321 214 |
| Pancreas | 328 | 307 163 |
| Skin | 1809 | 326 671 |
| Vagina | 156 | 305 627 |
| Uterus | 142 | 301 319 |
| Adipose tissue | 1204 | 323 487 |
| Fallopian Tube | 9 | 256 858 |
| Cervix uteri | 19 | 270 935 |
| Adrenal gland | 258 | 308 438 |
| Esophagus | 1445 | 324 617 |
| Thyroid | 653 | 320 631 |
| Prostate | 245 | 315 279 |
| Brain | 2 642 | 328 652 |
| Salivary gland | 162 | 307 159 |
| Pituitary | 283 | 316 455 |
| Muscle | 803 | 315 604 |
| Spleen | 241 | 305 618 |
| Breast | 459 | 319 900 |
| Kidney | 89 | 298 646 |
| Blood vessel | 1335 | 322 300 |
| Nerve | 619 | 318 429 |
| Liver | 226 | 299 223 |
| Bladder | 21 | 271 004 |
| Heart | 861 | 317 675 |
| Lung | 578 | 319 823 |
| Testis | 361 | 329 431 |
| Ovary | 180 | 304 751 |
| Small intestine | 187 | 310 582 |
| Cancer type | Sample number | BSa junction number |
|---|---|---|
| ACC | 24 | 29 254 |
| ALL | 21 | 50 900 |
| AML | 10 | 31 068 |
| BLCA | 49 | 44 714 |
| BRCA | 236 | 98 906 |
| CHOL | 62 | 50 133 |
| COLO | 29 | 27 875 |
| ESCA | 19 | 34 621 |
| GBM | 26 | 34 245 |
| HCC | 17 | 37 275 |
| HNSC | 49 | 40 095 |
| KDNY | 23 | 31 254 |
| LEUK | 33 | 44 005 |
| LUNG | 40 | 35 738 |
| MISC | 124 | 74 556 |
| MM | 212 | 82 083 |
| MPN | 151 | 70 543 |
| NHL | 124 | 84 016 |
| NRBL | 13 | 27 659 |
| OV | 20 | 24 319 |
| PAAD | 58 | 44 155 |
| PRAD | 340 | 97 559 |
| RHABDO | 10 | 20 901 |
| SARC | 167 | 78 733 |
| SECR | 44 | 48 545 |
| SKCM | 31 | 28 810 |
| STAD | 27 | 30 775 |
ACC, adrenocortical carcinoma; ALL, acute lymphoblastic leukemia; AML, acute myeloid leukemia; BLCA, bladder urothelial carcinoma; BRCA, breast invasive carcinoma; CHOL, cholangiocarcinoma; COLO, colon cancer; ESCA, esophageal carcinoma; GBM, glioblastoma multiforme; HNSC, head and neck squamous cell carcinoma; KDNY, renal cell carcinoma; LEUK, leukemia; LUNG, lung adenocarcinoma; MISC, rare cancer; MM, multiple myeloma; MPN, myeloproliferative neoplasm; NHL, non-Hodgkin's lymphoma; NRBL, neuroblastoma; OV, ovarian serous cystadenocarcinoma; PAAD, pancreatic adenocarcinoma; PRAD, prostate adenocarcinoma; RHABDO, rhabdomyosarcoma; SARC, sarcoma; SECR, gandular cancer; SKCM, skin cutaneous melanoma; STAD, stomach adenocarcinoma.
aBS: back-splicing.
Browse the database
Users can browse the information on junctions by clicking the ‘Browse’ tab on the left-side navigation menu, and the browse page will present the entry point to tables containing all the information on the three types of junctions (Figure 2A). Users can browse the RJunBase database with various options. For example, the ‘Junction type’ allows users to browse junctions of interest, such as fusion junctions. The ‘Gene type’ could be specified to select a particular type of hosting gene for each junction, such as ‘protein coding’. If not selected, junctions of all types will be displayed. For fusion junctions, the hosting genes, such as protein coding genes, are connected by ‘-’. Moreover, RJunBase provides two additional options to screen potentially functional junctions: (i) ‘Annotation’ indicates whether selected junctions can be extracted from GENCODE database; (ii) ‘Tumor-specific types’ denotes whether the junctions currently being browsed are tumor-specific. The RJunBase includes tumor-specific junctions that are related to 33 TCGA cancer types.
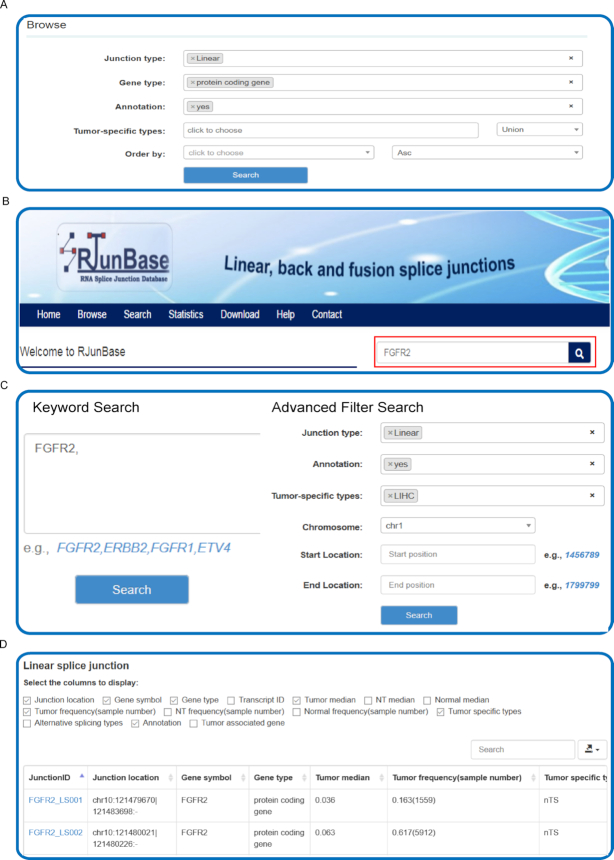
Interactive searching and browsing activity in RJunBase. (A) Browse database for splice junctions. (B) Quick search feature on the homepage. (C) The ‘Search’ page of RJunBase allows to search the database by the gene name or other options. (D) Results table for Browse or Search. ‘Tumor median’ and ‘NT median’ indicate the median expression value of cancer and adjacent normal tissues from the Cancer Genome Atlas (TCGA), respectively. ‘Normal median’ indicates median expression value of normal tissues from the Genotype-Tissue Expression (GTEx) database. ‘Tumor frequency(sample number)’ and ‘NT frequency(sample number)’ display the expression frequency of tumors and adjacent normal tissues from TCGA, respectively. ‘Normal frequency(sample number)’ displays the expression frequency of normal tissues from GTEx. ‘Tumor specific types’ indicates cancer types in which the junction are identified as tumor specific. ‘Alternative splicing types’ indicates types of alternative splicing of splice junctions.
To obtain the analysis results only a click on the ‘Run’ button is necessary and a dynamic tabular with optional boxes will be displayed, in which each row and column show a junction and region-specific information respectively, including Junction ID, Junction location, Junction type, Gene symbol, Gene type, Tumor median, Tumor frequency (sample number), NT frequency (sample number), Tumor specific types, Annotation. Users can also obtain Transcript ID, NT median, Normal median, Normal frequency (sample number), and Alternative splicing types by clicking the corresponding menu options (Figure 2D). By default, each page displays 10 records and the user can view the remaining records through using the pagination features on the bottom right of the table. The number of records displayed in each page can be switched between 10, 25, 50 and 100 using the ‘records per page’ dropdown menu. Details about each junction can be viewed by clicking the junction ID, and clicking the Gene_symbol can direct users to the search results.
Search the database
RJunBase provides a simple search interface and genes of interest can be easily queried (Figure 2B). Users can enter one (e.g., ERBB2) or more gene symbols that are separated by commas (e.g. ETV4, FGFR2) in the ‘Keyword Search’ field. Advanced filters, including Junction type, Annotation, Tumor-specific types, and Genomic location, allow users to further filter the results (Figure 2C). To obtain the basic information on all junctions related to the input gene, only a click on the ‘Search’ button is required. The ‘Search Results’ include a ‘Splicing pattern chart’ and responsive tables. The ‘Splicing pattern chart’ displays visualizations of the junctions that are contained in the input gene. By clicking in the ‘Linear&Back’ button, users will obtain a comprehensive plot in a publication-quality format of all linear and back-splice junctions, and the corresponding exon information from the reference gtf file will also be attached (25). A ‘Fusion’ button will be displayed if fusion junctions exist in the host gene, which will provide a Circos plot of fusion junctions between the two hosting genes. As for the responsive tables, which provide the annotation and expression information on the three types of junctions, clicking on the JunctionID hyperlinks will lead users to a page containing detailed information about the corresponding junctions.
Detail page and result
Users can obtain basic junction annotations in the summary page. By clicking the ‘Expression profile’ button, the expression profile of the input junction across all cancer and normal tissues will be shown in boxplots. ‘Boxplot’ dynamically plots expression profiles of a given junction according to user-defined cancer selections and methods. The RJunBase also performs survival analysis based on junction expression profiles, allowing users to select their custom cancer types for overall or disease-free survival analysis. For example, to examine the survival curves of liver cancer patients based on the expression of the input junction in their cancer samples, users can select liver hepatocellular carcinoma (LIHC). RJunBase uses the Kaplan–Meier method for hypothesis evaluation, and the thresholds for high/low expression cohorts are adjustable.
Applications of RJunBase: case 1
The user can investigate splice junctions for desired genes in pan-cancer and normal tissues. For example, ETS variant transcription factor 4 (ETV4) holds a potential role in endometrial tumor-specific estrogen receptor binding (26). As a demonstration, we entered ‘ETV4’ in the search box on the home page or ‘Search’ page. The search results were classified into three parts: the splicing pattern chart, the table of three junctions, and the junction detail. The splicing pattern chart showed that ETV4 contained linear junctions and back-splice junctions (Figure 3A). Furthermore, the circular layout showed genes fused to ETV4 (Figure 3B). The search results also listed a table that contains linear, back-splice, and fusion junctions.
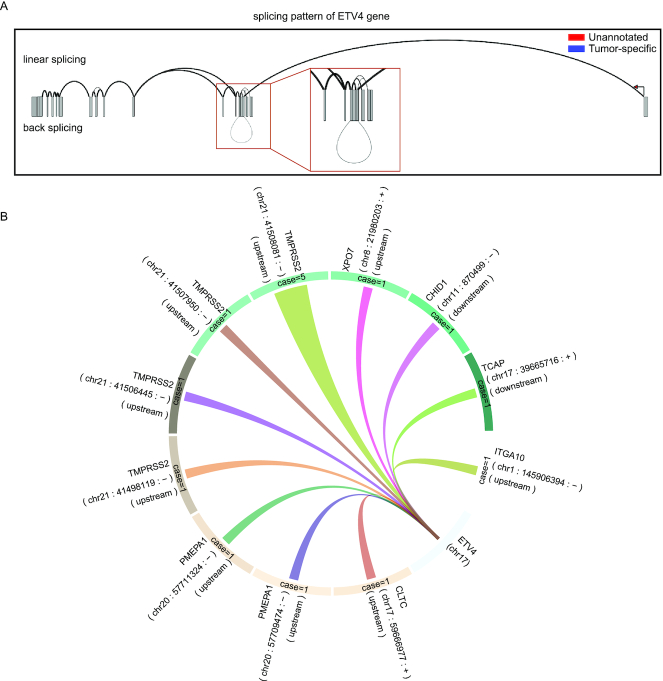
Examples of RJunBase outputs. (A) Users can check linear and back-splice junctions for ETV4 in the ‘Linear&Back’ tab. (B) Circular layout of fusion junctions for ETV4 in the ‘Fusion’ tab. A random color was assigned to links to distinguish between fusions. Case number of fusions was indicated in the circular ring, and the width was set to change with case number. Spatial information was displayed outside of the circular ring in reverse-clockwise manner.
Considering the median expression value and frequency of tumor, ETV4_LS002 was used as a test research subject by clicking ‘ETV4_LS002’ and switching to the junction detail page. The summary page showed that this specific junction existed in multiple transcripts, and its expression in cancer was much higher than in pan-cancer and normal tissues. Figure 4A and B shows the expression of this junction in pan-cancer and the GTEx database. Expression of this junction in colon adenocarcinoma, rectum adenocarcinoma, and thyroid carcinoma were presented individually in the ‘Expression DIY’ tab (Figure 4C). Survival curves were plotted for several cancers. High ‘ETV4_LS002’ expression was found to be correlated with decreased overall survival for adrenocortical carcinoma (Figure 4D) and liver hepatocellular carcinoma (LIHC) (Figure 4E).
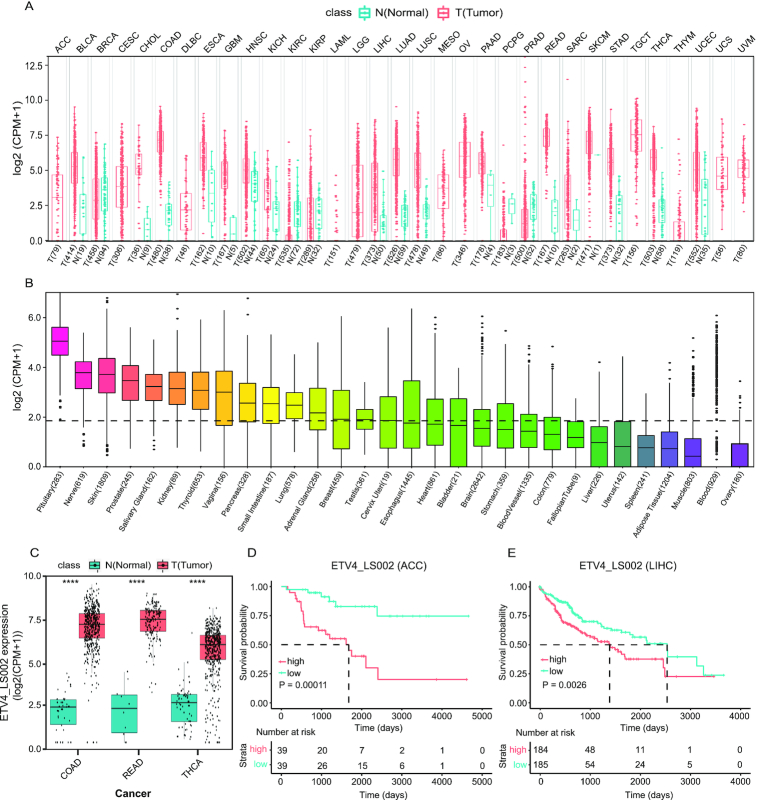
Expression profile and prognostic significance of ETV4_LS002 junction. (A, B) Expression of ETV4_LS002 in the Cancer Genome Atlas (TCGA) (A) and the Genotype-Tissue Expression (GTEx) database (B) samples in the ‘Summary’ tab on the ‘Linear Splice Junction Detail’ page. (C) Expression of ETV4_LS002 in COAD, READ, and THCA samples in the ‘Expression DIY’ tab. (D, E) Overall survival analysis of ETV4_LS002 junction in ACC (D) and LIHC (E) in the ‘Survival’ tab. Abbreviations: ACC, adrenocortical carcinoma; COAD, colon adenocarcinoma; LIHC, liver hepatocellular carcinoma; N, normal; READ, rectum adenocarcinoma; T, tumor; THCA, thyroid carcinoma.
Applications of RJunBase: case 2
The potential functional implication of the RJunBase is to extract tumor-specific junctions. In this second situation, UN_SLC22A10_LS0017 was used as an example (Figure 5A), which is a tumor-specific junction in SLC22A10. As shown in Figure 5B, UN_SLC22A10_LS0017 was found to be highly expressed in LIHC and breast cancer. Survival analysis revealed that high expression of UN_SLC22A10_LS0017 was significantly associated with poorer prognosis in LIHC (Figure 5C). Therefore, UN_SLC22A10_LS0017 may function as an independent prognostic biomarker in patients with LIHC.
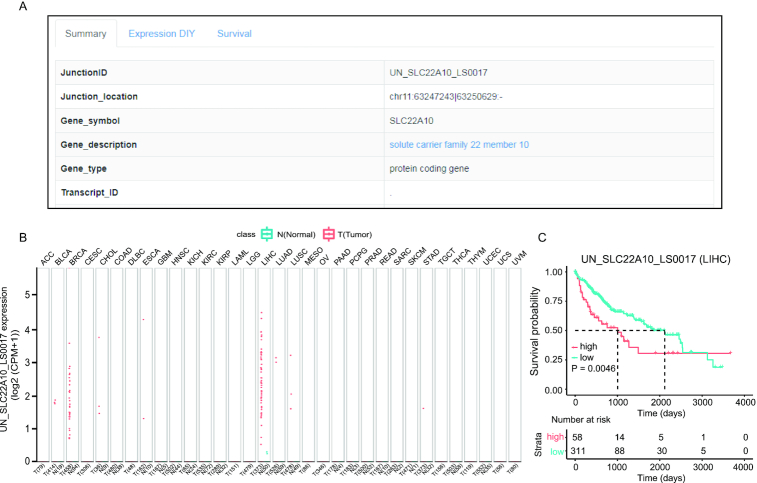
Example of tumor-specific junctions. (A) Summary of UN_SLC22A10_LS0017 junction. (B) Boxplot of normalized UN_SLC22A10_LS0017 expression profiles in pan-cancer. (C) Kaplan–Meier plot for overall survival of UN_SLC22A10_LS0017 junction in liver hepatocellular carcinoma (LIHC).
DISCUSSION AND FUTURE DIRECTIONS
To the best of our knowledge, RJunBase is the first database of RNA splice junctions, which include linear, fusion and back-splice junctions from 11 540 cancerous and 18 084 non-cancerous human tissues. Compared with the TCGASpliceSeq database (17), RJunBase offers information on RNA splice junctions of cancer transcriptome that is not limited to AS patterns of protein-coding genes, and enables users to explore and visualize the gene-level splice pattern and the junction-level expression profile. This new database also supports users to assess desired splice junctions with custom query options, such as unannotated junctions and tumor-specific junctions. Additionally, researchers can download full datasets for integrative analysis, which will be beneficial in the search for new splicing-associated targets for cancer treatment.
In accordance with the existence of TSTs across human cancers, our database highlights the abundance of tumor-specific junctions. Tumor-specific junctions may be generated from multiple factors, such as epigenetic changes (chromatin remodeling or the activation of long terminal repeats) and mutations in cis-regulatory sequences or trans-acting splicing regulatory factors (27,28). For example, we previously depicted a TST of lin-28 homolog B, named LIN28B-TST (10). This TST was transcribed from an upstream long terminal repeat that possesses strong promoter activity with high-level H3K27Ac and H3K4me3 histone modifications, and an abundance of RNA polymerase II. The LIN28B-TST-specific junction could be browsed in the RJunBase database (LIN28B_LS001). Importantly, neojunctions possess the ability to form a class of potential neoantigens (4). These tumor-specific junctions may act as diagnostic markers and potentially as therapeutic targets for cancer patients.
We also discovered plenty of unannotated novel junctions in pan-cancer tissues and non-cancerous tissues, which could be divided into intergenic and intragenic junctions. The intergenic junctions may be generated by epigenetic alterations such as transcriptional activation, whereas the intragenic junctions may be produced by aberrant splicing in a single gene. It should be noted that some unannotated junctions may be by-products of the bioinformatics RNA splicing analysis. Recent advances in long-read sequencing identified full-length transcripts in different species (29–31). By using information on full-length transcripts and junctions from the RJunBase, users can further understand the splicing characteristics of specific targets to overcome identification of false-positive splice junctions.
The RJunBase will be regularly updated to continuously include more splice junctions of healthy and pathological human tissues, especially cancer tissues, including rare cancers. We believe that RJunBase will serve as an important resource and a powerful tool for studying splice junctions in human cancer transcriptomes and further understanding specific transcript production. Furthermore, the use of this database could potentially lead to the discovery of diagnostic and therapeutic targets for cancer.
ACKNOWLEDGEMENTS
We thank InfinityBio and yunbios platform for the support on website development. We also thank Novel Bioinformatics Ltd., Co. for the support of bioinformatics analysis with their NovelBio Cloud Analysis Platform.
SUPPLEMENTARY DATA
Supplementary Data are available at NAR Online.
FUNDING
Shanghai Science and Technology Innovation Action Plan [20JC1419000]; National Natural Science Foundation of China [81672779, 81872294, 82002500, 82072694]. Funding for open access charge: National Natural Science Foundation Shanghai Science and Technology Innovation Action Plan.
Conflict of interest statement. None declared.
REFERENCES
1.
3.
4.
5.
6.
7.
8.
9.
10.
11.
12.
13.
14.
15.
16.
17.
18.
19.
20.
21.
22.
23.
24.
25.
26.
27.
28.
29.
30.