 RBP2GO: a comprehensive pan-species database on RNA-binding proteins, their interactions and functions
Nucleic Acids Research


- Altmetric
RNA–protein complexes have emerged as central players in numerous key cellular processes with significant relevance in health and disease. To further deepen our knowledge of RNA-binding proteins (RBPs), multiple proteome-wide strategies have been developed to identify RBPs in different species leading to a large number of studies contributing experimentally identified as well as predicted RBP candidate catalogs. However, the rapid evolution of the field led to an accumulation of isolated datasets, hampering the access and comparison of their valuable content. Moreover, tools to link RBPs to cellular pathways and functions were lacking. Here, to facilitate the efficient screening of the RBP resources, we provide RBP2GO (https://RBP2GO.DKFZ.de), a comprehensive database of all currently available proteome-wide datasets for RBPs across 13 species from 53 studies including 105 datasets identifying altogether 22 552 RBP candidates. These are combined with the information on RBP interaction partners and on the related biological processes, molecular functions and cellular compartments. RBP2GO offers a user-friendly web interface with an RBP scoring system and powerful advanced search tools allowing forward and reverse searches connecting functions and RBPs to stimulate new research directions.

INTRODUCTION
RNA is a multifaceted molecule which is not only the indispensable template for the production of proteins but also a crucial regulatory interaction partner of a wide range of proteins involved in key biological processes ranging from the regulation of gene expression to the assembly of functional cellular compartments (1). RNA-protein complexes have emerged as central component in our understanding of many cellular pathways and their related diseases. With the increased recognition of their importance, proteins interacting directly with RNA, RNA-binding proteins (RBPs), have therefore faced a growing interest.
The specific identification and annotation of the cellular pool of RBPs is an essential step for the characterization of their functions. This challenging task led to the establishment of several strategies for the proteome-wide discovery of RBPs. After RBP catalogs have been compiled manually via literature curation or by the computational analysis of the canonical RNA-binding domains (RBDs) (2–6), the elaboration of new experimental approaches based on the affinity purification of polyadenylated (polyA) RNA species (5,7–10) has demonstrated that RBPs often contain intrinsically disordered regions, which can also bind to RNA (7). Therefore, both, experimental and computational, methodologies are complementary approaches in the process of identifying RBPs. Since polyA-RNA pulldown-based studies would not identify RBPs interacting with non-polyA RNA species, alternative studies based on the incorporation of modified nucleotides were initiated (11,12) as well as alternative technologies taking advantages of protease digestion to precisely map the RNA-binding regions (13–15). More recent methods using phenol-chloroform extraction (16–18) or RNase digestion to detect RNA-dependent proteins like R-DeeP or DIF-FRAC (19–21) were developed. These different strategies were applied to many species, including Homo sapiens (7,8,22–24), Mus musculus (9,11,15,20,25), Drosophila melanogaster (10,26), Caenorhabditis elegans (27,28), Saccharomyces cerevisiae (22,27,29), Escherichia coli (17,29) and others. They represent valuable and complementary datasets to our understanding of RBPs, their functions and relation to diseases. However, the rapid increase in the number of studies during the recent years makes it currently difficult to efficiently screen for RBP candidates and further investigate their functional relevance in absence of a unifying platform.
Presently, several RBP databases and resources are available including collections of RBPs based on literature search of validated RBPs (4), computational analysis of canonical RBDs (4,6,30) and experimental data (6,30), but they are necessarily incomplete regarding the many experimental studies which only became available recently, they focus on the most common eukaryotic species (human, mouse, zebrafish, yeast, fly and worm) and they do not dissect the multiple datasets derived from the same study. Taking into consideration that the number of times a protein is experimentally identified as an RBP increases the likelihood for this RBP candidate to be a true RBP, it is particularly important to carefully keep track of this parameter and to consider all available datasets.
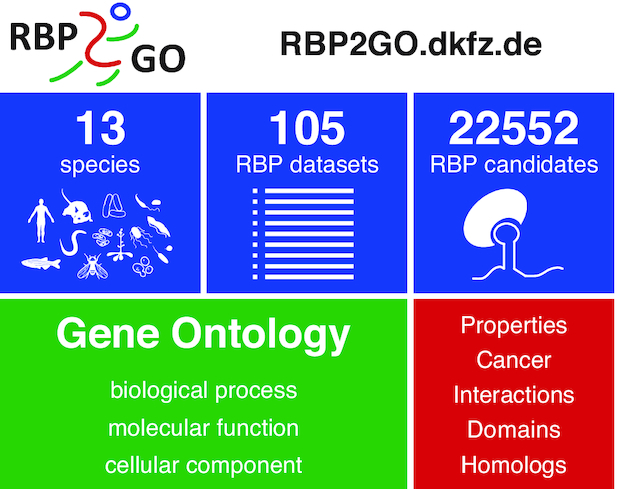
Here, we present the RBP2GO database, freely available at https://RBP2GO.DKFZ.de, to meet this need and to fill this primary gap with a pan-species comprehensive database of all currently available proteome-wide datasets for RBPs. RBP2GO provides a user-friendly, intuitive and interactive web interface comprehensively compiling information across 13 species ranging from human to bacteria, including 53 studies with 105 underlying datasets and identifying altogether 22552 RBP candidates (Figure 1). In particular, for each RBP candidate, RBP2GO reports the number of studies listing this candidate and also classifies its interaction partners as RBP candidates or non-RBPs. Accordingly, an RBP2GO score is computed, which reflects the probability for the protein to be an RBP. While these features already allow the comparison of multiple datasets as well as an estimation of the likelihood for each protein of being a truly RNA-binding protein, RBP2GO offers additional features for scientific discovery. We also integrated independent advanced information on RBP interaction partners via the STRING database (31) and on molecular functions, biological processes and cellular compartments from the Gene Ontology Resource (32,33) in addition to basic information from UniProt (34) as well as cross-species homolog information from UniRef (35).
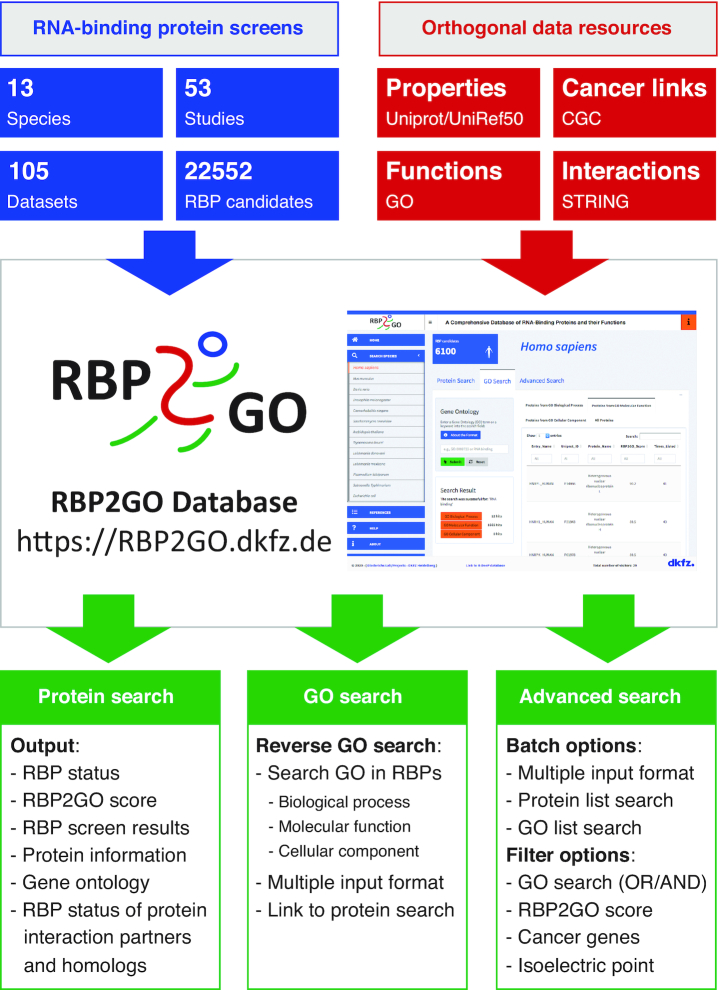
Overview of RBP2GO, a comprehensive database of all currently available proteome-wide datasets for RBPs across 13 species. Data from 53 studies including 105 datasets identifying altogether 22 552 RBP candidates have been compiled and made available to the scientific community. RBP2GO also integrates data from orthogonal resources including UniProt, UniRef50, CGC, Gene Ontology Resource and STRING and offers three user-friendly, intuitive and interactive search engines. A combination of search parameters allows a user-defined query of the database, adaptable to the individual research interests.
RBP2GO offers not only search options based on single proteins/genes, but includes a convenient, flexible and time-saving batch (protein list) search option. Importantly, RBP2GO distinguishes itself through the unique reverse GO term search option. Thereby, gene ontology information is not only an accompanying static information, but RBP2GO enables the active search for RBP candidates associated with specific GO terms and allows the user to navigate through the interactive results. Finally, the database provides an advanced search module, allowing the combination of different parameters for specific search purposes including batches of proteins, batches of GO terms, combinations thereof and filters for cancer genes, ranges of isoelectric points (pI) or ranges of RBP2GO scores. In this module, RBP2GO retrieves results from the listed RBP candidates but also from non-listed proteins to allow the users to perform proteome-wide comparative analyses.
We are beginning to understand the extent and the impact of RNA–protein interactions in the complex cellular circuitry. The developing field of RBP biology faces new challenges and is rapidly expanding. With scientists from different backgrounds and with different research questions gaining interest in RBPs, we anticipate that RBP2GO will represent an important tool to discover RBP roles in unexpected biological processes by enabling searches starting from a biological process or molecular function.
MATERIALS AND METHODS
Compilation of the RBP datasets across species
Following a thorough screening of the literature related to RNA-binding proteins and proteome-wide studies, the protein lists were obtained from the supplementary information of the respective publications and the basic information including entry name, UniProt ID, protein name, mass, length, gene name, alias names, disease and InterPro information was retrieved using the Retrieve/ID mapping tool from UniProt and the UniProt Release 2020_03 (34). Due to the update of the UniProt database and the removal of duplicated and obsolete entries, the number of RBPs in RBP2GO may differ from the number in the original publication. Where needed, the IDs were manually mapped to UniProt (e.g. 93 IDs from T. brucei). In addition, a dataset corresponding to the GO term ‘RNA binding [GO:0003723]’ from the Gene Ontology Resource (33,36) was added for each species except for L. donovani and L. mexicana. A reference table recapitulating the origin of each dataset (first author, year, DOI), the name of the method (e.g. R-DeeP, eRIC or OOPS), the organism, the cell type system and a short description of the approach is available as Supplementary Table S1 or can be also directly downloaded from the ‘REFERENCE’ item in the sidebar menu of the RBP2GO database. The URL of the studies are listed in the Supplementary Table S2 or the link to the studies can be directly accessed from the ‘REFERENCE’ menu in RBP2GO. Only species associated with at least one experimental study were integrated into the resource. A summary of the species statistics can be found in the Supplementary Table S3. For an effective tracking of the cell type system, the name of the cell is included in the column name for each dataset of the database (e.g. Baltz_HEK293_2012 or Bao_mESC_2018). Following the identification of the RBP candidates, basic information was also compiled for the non-RBP proteins (other proteins) in each species, based on the respective UniProt proteomes (https://www.uniprot.org/proteomes/). Many protein isoforms or proteins with only TrEMBL IDs (unreviewed), which were not comprised in these proteomes, were thus not included into RBP2GO. Altogether, this led to an annotated dataset of 176 940 proteins which can be independently queried via the distinct search tools. All species datasets can be individually downloaded from the ‘DOWNLOAD’ menu of the RBP2GO database.
STRING interaction information
For the species available in the STRING database, the STRING IDs of the proteins were retrieved from the Retrieve/ID mapping tool in UniProt (https://www.uniprot.org/uploadlists/) and matched to both the protein-protein interaction (PPI) including the STRING Score and the individual protein information downloaded respectively from the STRING database version 11.0 (https://string-db.org). For the species L. donovani, L. mexicana, P. falciparum and S. Typhimurium, we could not obtain PPI data from the STRING database.
CORUM complexes information
The CORUM complexes for human and mouse were retrieved from the CORUM dataset (http://mips.helmholtz-muenchen.de/corum/) (37) and added as information to the proteins listed in CORUM complexes. For each complex, a direct link to the complex description in CORUM is available.
UniRef50 clusters
The UniRef (UniProt Reference Clusters) provide clustered sets of sequences from the UniProt Knowledgebase (UniProtKB IDs) which share a minimum sequence identity of e.g. 50% in UniRef50 and a minimum of 80% overlap with the longest sequence (seed sequence) of the cluster to prevent proteins sharing only partial sequences from being clustered together (35,38).
Cluster members of the species listed in RBP2GO were directly listed and linked within the RBP2GO database. The UniRef50 dataset was integrated with the information available in RBP2GO, so that each cluster member was classified as RBP or non-RBP. To provide more details about each cluster, a link to the specific UniRef50 cluster page is available in RBP2GO. Based on the UniRef50 sequence identity, homologs were found in the same species and/or in other species.
Computation of the RBP2GO Score
First, we reasoned that RBP candidates that are independently listed in multiple datasets should possess a higher probability of being a true RBP. In addition, based on the finding of the SONAR study (39) and our previous analysis of the protein–protein interactions within the CORUM database (19), proteins interacting with multiple RBPs are frequently RBPs themselves. In addition, RBPs are known to be involved in complex co-regulatory networks with other RBPs (40). Accordingly, we computed and provided for each protein two separate indicators of its RBP propensity: the count of the protein itself being listed as RBP (column ‘Listing_Count’ in the tables) and the average listing count of the up to ten interaction partners with the highest STRING scores (column ‘AVG10_Int_Listing_Count’). These were combined with an equal weight in the RBP2GO score, which was normalized to the number of datasets in the respective species (column ‘Nb_Datasets’) and can therefore range from 0 to 100. For example, the RBP2GO score of a human protein listed itself 30 times and its top ten interaction partners on average 15 times in 43 datasets is calculated as (30/43*50 + 15/43*50) = 52.3. A non-listed protein interacting with non-listed partners has consequently a score of 0. RBP2GO scores were only computed for species with PPI reported in STRING. Accordingly, proteins of L. donovani, L. mexicana, P. falciparum and S. Typhimurium are not associated with RBP2GO scores.
Whole-tree gene ontology information
We obtained the essential gene ontology information associated to each protein from the UniProt database. However, this gene ontology data did not contain the entire ancestor tree for each GO term. Since this information was necessary to enable searches for all RBPs associated with a specific GO term (a reverse search option as compared to the usual GO search tools), we completed the ancestor tree of each single GO term that was associated to a protein. To do so, we used the R package ‘GO.db’ (the reference can be found in the Supplementary Table S4). The GO terms for the three aspects ‘biological process’, ‘molecular function’ and ‘cellular component’ are reported.
Integration of the isoelectric point (pI) values
According to previous studies, RBP candidates have a significantly higher pI than non-RBPs (7,16,19,39). Therefore, this parameter was included into the RBP2GO database, to allow users to select and sort for specific pI ranges if needed or desired. The pI information was retrieved from Proteome-pI—Proteome Isoelectric Point Database (http://isoelectricpointdb.org) (41), a database of pre-computed isoelectric points for proteomes from 5029 model organisms. We used the average value computed from 18 different algorithms.
Cancer Gene Census (CGC) information
For the human RBP candidates and non-listed proteins, the CGC information was retrieved from the release v91 of the COSMIC database (https://cancer.sanger.ac.uk/cosmic) (42) and includes the CGC tier (1 for well-established cancer genes and 2 for less well-established ones), the dominant/recessive status (Dom or Rec) and the role in cancer, i.e. whether it is an oncogene, a tumor suppressor gene and/or shows gene fusion alteration (for all three, Yes or No).
Database and website implementation
RBP2GO was developed as a Shiny app using the ‘shiny’ R package from RStudio (https://rstudio.com). All R packages in use are listed in Supplementary Table S4. By integrating HTML, CSS and JavaScript elements, the app provides a user-friendly environment to search the database in an interactive way. The search results can be downloaded in CSV or TXT format depending on the type of data to enable an easy upload in table-based software for further analyses by the users. The database is freely accessible from desktop and laptop computers as well as tablets and smartphones via an https protocol and without registration.
USER INTERFACE AND EXPLOITATION OF THE DATABASE
Dataset analysis
In summary, RBP2GO provides access to RBP information for 13 species derived from 53 studies comprising 105 datasets and including 22552 RBP candidates. H. sapiens is the most frequently investigated species with 27 studies and 43 datasets followed by M. musculus and S. cerevisiae. Leishmania donovani is the species with the smallest number of entries with one dataset listing 79 RBP candidates (Figure 2A). The fraction of RBP candidates relative to all proteins identified in the proteome of a species can vary greatly (Figure 2A).
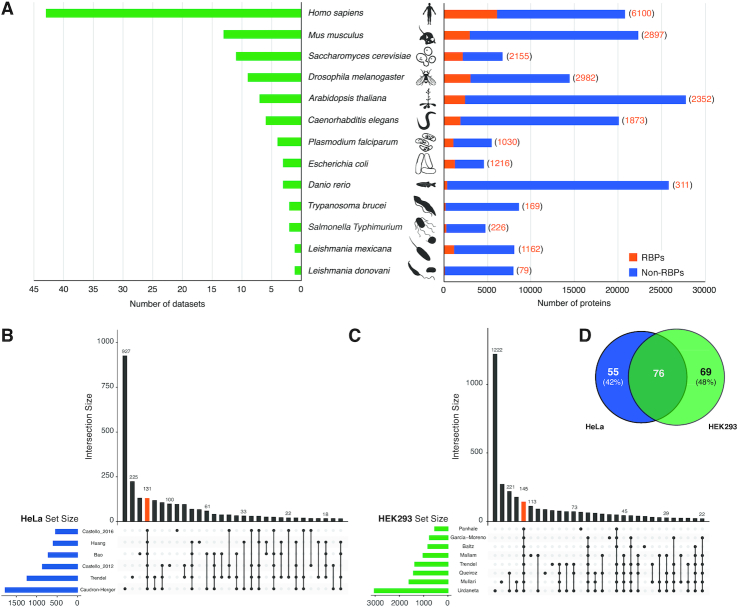
Statistics and analysis of the RBP2GO dataset. (A) On the left part, the bar graph shows the number of datasets per species. On the right part, the graph depicts the number of RBP candidates from the respective proteome-wide studies (RBPs in orange and corresponding numbers in brackets) and the number of non-listed proteins in the respective species (Non-RBPs in blue). (B) Upset plot showing the first 30 intersections of six HeLa proteome-wide experimental studies (7,11–13,16,19). The orange bar corresponds to the intersections of all studies with 131 core RBPs. (C) Upset plot showing the first 30 intersections of eight HEK293 proteome-wide experimental studies (8,14,16–18,20,52,53). The orange bar corresponds to the intersections of all studies with 145 core RBPs. (D) Venn diagram showing the intersection of the respective sets of core RBPs in HeLa and HEK293 cells.
For human, six studies with >500 entries have been performed in HeLa cells and eight studies have been performed in HEK293 cells, allowing an informative comparative analysis of the respective dataset intersections (Figure 2B and C). Interestingly, when comparing the core RBP sets (RBPs found in all studies of one cell type), the intersection between the two cell lines only represents 58% (HeLa) and 52% (HEK293) of the core RBPs (Figure 2D), pointing to relevant cell-to-cell variations subject to future research.
The analysis of the UniRef50 clusters within the 13 species listed in RBP2GO revealed that cross-species data was available but mostly limited to homologs within small subsets of species clusters (Supplementary Figure S1A). However, the importance of integrating sequence homology information was supported by the finding that within the 13 studied species, RBPs showed an increased probability of having homologs in different species (Figure 3) or homologs in the same species (Supplementary Figure S1B) that were RBPs themselves. For example, the E. coli and M. musculus RBPs showed a 9.8-fold and 3.7-fold increased proportion of RBP homologs in other species compared to E. coli and M. musculus non-RBPs (P values 3.6*10−33 and 7.9*10−221) (Figure 3). Similarly, within the same species, H. sapiens and A. thaliana RBPs showed a 6.3-fold and 8.4-fold increased proportion of RBP homologs, respectively, compared to H. sapiens and A. thaliana non-RBPs (P values 1.9 × 10−71 and 2.1 × 10−165) (Supplementary Figure S1B).
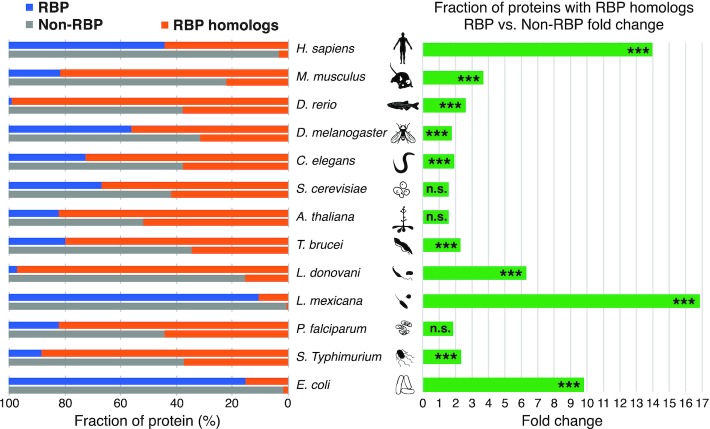
Analysis of the UniRef50 sequence-based homologs in different species in the context of the RBP studies. On the left part, the bar graph shows the fraction of proteins with RBP homologs in different species (orange) within all RBPs (blue) and all non-RBPs (grey) from the respective species. On the right part, the graph represents the fold change of the fraction of RBPs with RBP homologs in different species vs. fraction of non-RBPs with RBP homologs in different species. Note that non-RBPs may contain RBPs which have not yet been identified or characterized. *** P value < 0.001, n.s. not significant.
Exploration tools
From the RBP2GO homepage, a sidebar menu gives access to the species-specific search engines. For each species, the three search options ‘Protein Search’, ‘GO Search’ and ‘Advanced Search’ are available, each containing query fields to enter search items and additional options depending on the type of data available for the species. Even if the design is intuitive, we recommend consulting the information available under ‘About the Format’ before starting a search process for an optimal exploitation of the database. The results can be downloaded as CSV or TXT files and further analyzed by the user.
Protein search
For more flexibility, the query field accepts multiple case-insensitive formats including gene name, entry name, UniProt ID or also a partial name which should be specifically marked with a ‘*’ such as ‘ribosomal*’ to query for protein name like e.g. ‘60S ribosomal protein L37’. If the query retrieves multiple results, the protein of interest can be selected per click from a list already showing the RBP2GO score and discriminating between RBP candidates (RBP2GO Proteins) and proteins never listed as RBP candidates (Other Proteins). For the selected individual protein, the specific details are organized in sub-categories including ‘Protein Information’, ‘RBP Studies’, ‘InterPro Classification’, ‘Gene Ontology’ and ‘Protein Interactions’. The sub-categories offer download options of the information and are linked to related databases (directly to the relevant content, if possible) such as UniProt, InterPro, QuickGO, the Gene Ontology Resource and STRING. The ‘RBP Studies’ tab presents a summary of the data available concerning the studies listing the protein of interest and can display the related part of the reference table with details about the experimental settings and publications. The ‘InterPro Classification’ tab provides the identified domains found in the protein. The ‘Gene Ontology’ tab comprises all GO terms linked to the protein in three tabs for ‘Biological Process’, ‘Molecular Function’ and ‘Cellular Component’ as well as ‘Useful Links’. The ‘Protein Interactions’ tab lists the protein-protein interaction partners retrieved from STRING classified into two categories to differentiate between interactions with other RBP candidates and interactions with non-listed proteins. The resulting proteins are ordered according to the decreasing STRING score and individual proteins can be selected to obtain further details. If a protein was found in an UniRef50 cluster, the ‘Protein Homologs’ tab depicts specific information about the UniRef50 cluster and the cluster members for the species listed in RBP2GO. Via this tool, intra- and cross-species information can be obtained, that is integrated with the data provided by the RBP studies. Each cluster member can be activated to obtain more detailed information. A more extensive description of the ‘Protein Search’ tool is provided in the RBP2GO User Guide available as Supplementary Text S1 or visualized in the corresponding tutorial video available as Supplementary Video S1. In addition, both the User Guide and the tutorial video can be downloaded from the ‘HELP’ menu of RBP2GO.
GO search
This unique search tool provides the reverse search engine as compared to the ‘Protein Search’ tool to screen for the RBP candidates which are associated to a specific GO term. Results for the three categories ‘biological process’, ‘molecular function’ and ‘cellular component’ are automatically reported with the corresponding number of hits and can be individually selected. Three tables display the RBP candidates corresponding to each of these categories, for which specific information can be retrieved via the button ‘Selected Protein Info’ below the table. For more flexibility, the query field accepts multiple case-insensitive formats, as well. The input can be a GO term such as ‘GO:0003723’ or just ‘0003723’, but the search engine would also accept a keyword search such as ‘RNA binding’. Please note that the keyword search is less precise than the direct GO term search and may recover more entries corresponding to multiple different matching GO terms. In summary, this versatile search module hence allows the user to specifically search for RBPs linked to any function or process of interest. A more extensive description of the ‘GO Search’ tool is provided in the RBP2GO User Guide (Supplementary Text S1) or visualized in the corresponding tutorial video (Supplementary Video S1).
Advanced search
This more elaborate search tool manages and combines different options at once and provides the user with an easy-to-use and time-saving batch search for the screening of both, proteins and GO terms. The input formats are flexible and a selected list of interest can simply be copied and pasted into the respective fields. In addition, the ‘GO List’ field includes an ‘AND/OR’ selection switch, which allows to run the GO list search in two different modes: linking the search terms with the Boolean operators ‘AND’ or ‘OR’. For users interested in cancer-related proteins, the query can be limited to the known cancer genes (CGC) and two input sliders allow selecting a specific range for the pI and RBP2GO score values. The advanced search tool returns two lists of proteins, one corresponding to the RBP candidates (RBP2GO Proteins) and one corresponding to the non-listed proteins (Other Proteins) to perform comparative analyses. From there, the user can select a protein of interest to obtain specific information in the ‘Protein Search’ section. The results can be downloaded as TXT files for further analyses by the user. The headers of the files recapitulate the respective search parameters, so that iterative uses and downloads from the database remain traceable. A more extensive description of the ‘Advanced Search’ is provided in the RBP2GO User Guide (Supplementary Text S1) or visualized in the corresponding tutorial video (Supplementary Video S1).
Description and analysis of the RBP2GO score
For each protein of interest, the RBP2GO score is compiled based on the count of how often the protein is listed as RBP in all datasets of this species (column ‘Listing_Count’) and the average listing count of the up to ten interaction partners with the highest STRING scores for interaction (column ‘AVG10_Int_Listing_Count’). The distribution of the listing count of the human proteins shows a positive correlation between the number of times a protein is listed as RBP and the number of times its top interaction partners are listed (Figure 4A). This result is in line with our previous findings (19) and observations of the SONAR study, which reported that proteins interacting with multiple RBPs were frequently RBPs themselves (39). Nonetheless, the distributions also show a range of listing counts for the interactors (Figure 4A) indicating that the two parameters combined in the RBP2GO score are non-redundant. Further attention should be paid to the interpretation of this spread, which could have a biological meaning. For example, proteins with a relatively low listing count that have a high average interactor listing count could be proteins that are RBPs but of low abundance and hence rarely detected in RBP screening studies. Alternatively, they could be part of a large ribonucleoprotein complex without directly contacting the RNA themselves. Such proteins may not be RBPs but could belong to the class of RNA-dependent proteins as defined in our previous study (19). RNA-dependent proteins are proteins whose interactions depend on RNA. They comprise RBPs as well as proteins indirectly bound to RNA in RNA-dependent complexes. Conversely, proteins with high listing count and low average interactor listing count could be proteins involved in a small ribonucleoprotein with a specific RNA and very few or no other proteins. To facilitate the analysis of the RBP2GO score, the number of datasets, the listing count of the protein as well as the average listing count of the top interactors are available separately, so that users can decide how to evaluate the RBP2GO score, to sort and select proteins of interest. Overall, the RBP2GO score and its components should be interpreted considerately, but could provide valuable additional information.
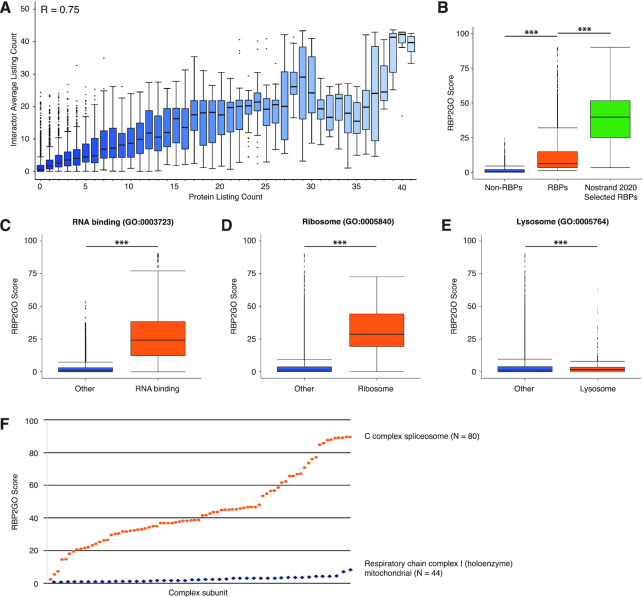
Development and validation of the RBP2GO score. (A) The box plot depicts the distribution of the number of listings as RBP candidate for a protein (x-axis) and the average number of RBP listings for its up to ten top interactors per protein according to STRING. The median is indicated as a bar inside the box. R = 0.75 (Pearson's correlation, *** P value < 0.001). (B) The box plot depicts the RBP2GO score associated with the ensemble of 14 646 human non-listed proteins, 6100 human RBP candidates and a selection of 356 human RBPs validated in a recent study (43). *** P value < 0.001, Mann–Whitney U test. The median is indicated as a bar inside the box. (C) The box plot depicts the RBP2GO score associated with human proteins related to the GO term ‘RNA binding’ compared to the remaining human proteins (Other). The median is indicated as a bar inside the box. *** P value < 0.001, Mann–Whitney U test. (D) Same as in (C) with the GO term ‘ribosome’. (E) Same as in (C) with the GO term ‘lysosome’. (F) The scatter plot depicts the RBP2GO score of two human complexes (one dot per subunit). N indicates the total number of subunits in either complex. See Supplementary Table S5 for a detailed list of P values.
For each species, the RBP2GO score is normalized to the number of datasets and theoretically ranges from 0 to 100. We calculated that - as expected - non-listed proteins have a significantly lower RBP2GO score than the set of RBP candidates (Figure 4B). In addition, a selection of 356 RBPs validated in a recent large-scale study that uses multiple assays focusing on different aspects of RBP function (43) has a significantly higher RBP2GO score than the whole set of RBP candidates (Figure 4B).
As a further control, we analyzed the RBP2GO score of GO terms such as ‘RNA binding [GO:0003723’], ‘Ribosome [GO:0005840]’ and ‘Lysosome [GO:0005764]’ (Figure 4C–E). For proteins linked to either GO term ‘RNA binding’ or ‘Ribosome’, the RBP2GO scores were significantly higher than for the proteins not associated with these GO terms. For the GO term ‘Lysosome’, the RBP2GO scores were significantly lower, strongly indicating a reduced probability for the associated proteins to be RBPs. Finally, we analyzed the RBP2GO scores of two CORUM complexes with 80 (C complex spliceosome) and 44 subunits (Respiratory chain complex I (holoenzyme) mitochondrial), respectively. The RBP2GO scores of the subunits were significantly different with mean values of 45.0 ± 22.0 and 2.4 ± 1.6, respectively (Figure 4F).
Exploitation of the database options and RBP2GO scores
The content of the RBP2GO database can be analyzed by combining the RBP2GO scores with the InterPro data on protein domains, seeking for example for specific RBDs. We focused on the RBDs highlighted in a recent review focusing on RNA-binding modules in RBPs (44) and analyzed these ten common RBDs in the human dataset (Figure 5A). Proteins containing a Pumilio, RRM or KH domain had the highest RBP2GO scores, while the SAM and ZnF_CCHH domains associated with the lowest RBP2GO scores. For the SAM domain-containing proteins, the RBP2GO scores were even comparable to the RBP2GO scores of proteins presenting no RBDs (Figure 5A). Zinc finger proteins are commonly known as DNA-binding protein. However, the ZnF_CCHH domain (or ZnF_C2H2) seems to also mediate protein-protein and RNA-protein interactions, whereas the specificity for the RNA can be enhanced by the presence of a ZnF_CCCH domain (which correlated with higher RBP2GO scores) (45,46). The SAM domain is primarily a module involved in protein-protein interactions. Its implication in RNA-protein interaction was recognized later and seems to be dependent on the shape of the target RNA (47,48). The low RBP2GO scores associated with these domains may reflect a stronger context-dependent interaction with RNA than for the other domains, raising new interesting research questions.
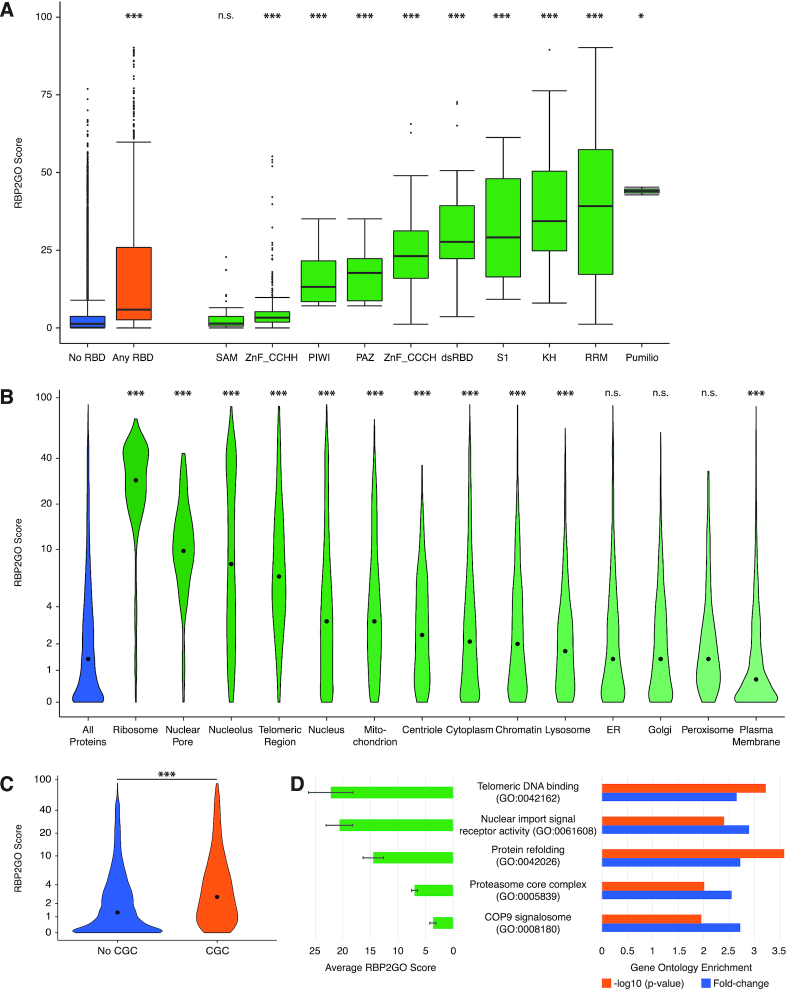
Exploitation of the RBP2GO datasets in combination with the RBP2GO score. (A) The box plot depicts the RBP2GO score for human proteins containing different classes of RNA-binding domains (RBDs) (44) as compared to all proteins containing RBDs (Any RBD, orange) and proteins containing none of these RBDs (No RBD, blue). The median is indicated as a bar inside the box. n.s. not significant, * P value < 0.05, *** P value < 0.001, Mann–Whitney U test comparing each category to ‘No RBD’. (B) The violin plot depicts the RBP2GO score for human proteins from different cellular components as compared to all proteins (blue). The y-axis was scaled using the scales::pseudo_log_trans(base = 2) function. The median is indicated as a dot inside the violin. n.s. not significant, *** P value < 0.001, Mann–Whitney U test comparing each compartment to the group of ‘All Proteins’. (C) The violin plot depicts the RBP2GO score of known human cancer genes (CGC in orange) and proteins not listed in CGC (No CGC, blue). The y-axis was scaled using the scales::pseudo_log_trans(base = 2) function. The median is indicated as a dot inside the violin. *** P value < 0.001, Mann–Whitney U test. (D) On the left part, the bar graph shows the average RBP2GO score of the human proteins enriched within the respective GO terms. Error bars indicate the standard error of the mean. On the right part, the graph depicts the gene ontology enrichment in fold-change (blue bars) with the corresponding –log10(P value), Fisher's exact test. The P values were corrected for multiple testing using the Benjamini–Hochberg method of the P.adjust function in R. See Supplementary Table S5 for a detailed list of P values.
Next, we investigated the RBP2GO score of proteins found in different human cellular components ranging from the ribosome to the plasma membrane (Figure 5B). While components such as the ribosome and the nucleolus had as expected significantly higher RBP2GO scores, other components such as the peroxisome and the plasma membrane had comparatively lower RBP2GO scores possibly reflecting a lower functional dependence on RNA and RBPs. Future studies may also focus specifically on membrane-bound RBPs which might be systematically underrepresented in whole cell lysates.
The analysis of the proteins known to be involved in cancer according to the CGC as compared to the non-CGC-listed proteins uncovered significantly increased RBP2GO scores for the cancer-associated proteins (Figure 5C) underlining the importance of RNA-protein complexes in tumorigenesis (49,50).
Finally, we performed an enrichment analysis between RBP candidates linked to a specific GO term as compared to the whole human proteome. For a number of GO terms not obviously linked to RNA-related processes, we found similar enrichments regarding the fold change and the significance (Figure 5D). Importantly, the average RBP2GO scores differed between these groups: while some enriched GO terms such as ‘telomeric DNA binding’ and ‘nuclear import signal receptor activity’ were associated with higher RBP2GO scores, other enriched GO terms such as ‘proteasome’ or ‘COP9 signalosome’ were linked to lower RBP2GO scores. This observation is in line with previous findings that some subunits of the proteasome did not have the ability to directly bind to RNA (19). Interestingly, the subunits of the COP9 signalosome are in some species similar to the subunits of the proteasome (51), so that similar RBP2GO scores could also reflect similarly low association with RNA. Altogether, this indicates that the RBP2GO score could be used as additional criterion to select processes and functions potentially linked to RNA for experimental analysis.
CONCLUSION AND FUTURE DIRECTIONS
In this study, we provide RBP2GO to the scientific community, a user-friendly, intuitive and interactive database comprehensively compiling RBP information on 22 552 RBP candidates derived from 105 datasets across 13 species (Figures 1 and 2A). In addition to useful general information about the proteins, we integrated datasets on their interaction partners, complexes, processes, functions and cellular components to compile rapid, convenient and versatile functional search tools. RBP2GO provides data at the level of individual datasets for RBP candidates and non-RBPs, allowing different types of comparative analyses (Figures 2B–D and 4D). It reports for each RBP candidate the number of datasets listing the protein as RBP, which reflects the probability of the protein to be a true RBP. To facilitate the use of this parameter, we developed the RBP2GO score (Figure 4) that is based on the listing count of each protein and the average listing count of the top ten interactors, two parameters that are also available individually for the analysis of the dataset. We demonstrated the utility of the RBP2GO score in combination with the functional data provided by our database (Figure 5).
Here, we only illustrated a few examples of the analytical capacity of RBP2GO. We anticipate that the whole dataset will support a variety of analyses from different perspectives and therefore foster our understanding of RBPs, their interactions and functions. Since RBPs are impacting a substantial number of key cellular processes, we expect that RBP2GO will be of interest for a wide-range of scientists with various expertise and backgrounds. In particular, it will also enable novices to the field to search for the RNA links in the biological process of their interest. The resource will be maintained and updated through regular and careful screening of the literature and integration of new proteome-wide datasets.
DATA AVAILABILITY
RBP2GO is available at https://RBP2GO.DKFZ.de without registration.
ACKNOWLEDGEMENTS
The authors sincerely acknowledge the IT Core Facility of the German Cancer Research Center for their support and hosting the RBP2GO Shiny app. The authors deeply thank Hind Dahbi-Flohr for her advice on the design of the web interface, Rebecca Schneeweiss for advice on data preparation as well as Sarah Schneeweiss for editing the video tutorial.
SUPPLEMENTARY DATA
Supplementary Data are available at NAR Online.
FUNDING
Research on RNA–protein complexes in our lab is supported by the German Cancer Aid [70113919 to S.D.]; Wilhelm Sander-Stiftung [2020.062.1 to S.D.]; Baden-Württemberg Stiftung [BWF_ISF2019-027 to M.C.-H.]. Funding for open access charge: DKFZ Core Funding.
Conflict of interest statement. S.D. is co-owner of siTOOLs Biotech GmbH, Martinsried, Germany, unrelated to this work. The other authors disclose no conflicts of interest.
REFERENCES
1.
2.
3.
4.
5.
6.
7.
8.
9.
10.
11.
12.
13.
14.
15.
16.
17.
18.
19.
20.
21.
22.
23.
24.
25.
26.
27.
28.
29.
30.
31.
32.
33.
35.
36.
37.
38.
39.
40.
41.
42.
43.
44.
45.
46.
47.
48.
49.
50.
51.
52.