 Demographic History and Genomic Response to Environmental Changes in a Rapid Radiation of Wild Rats
Molecular Biology and Evolution


Deyan Ge and Anderson Feijó authors contributed equally to this work.

- Altmetric
For organisms to survive and prosper in a harsh environment, particularly under rapid climate change, poses tremendous challenges. Recent studies have highlighted the continued loss of megafauna in terrestrial ecosystems and the subsequent surge of small mammals, such as rodents, bats, lagomorphs, and insectivores. However, the ecological partitioning of these animals will likely lead to large variation in their responses to environmental change. In the present study, we investigated the evolutionary history and genetic adaptations of white-bellied rats (Niviventer Marshall, 1976), which are widespread in the natural terrestrial ecosystems in Asia but also known as important zoonotic pathogen vectors and transmitters. The southeastern Qinghai-Tibet Plateau was inferred as the origin center of this genus, with parallel diversification in temperate and tropical niches. Demographic history analyses from mitochondrial and nuclear sequences of Niviventer demonstrated population size increases and range expansion for species in Southeast Asia, and habitat generalists elsewhere. Unexpectedly, population increases were seen in N. eha, which inhabits the highest elevation among Niviventer species. Genome scans of nuclear exons revealed that among the congeneric species, N. eha has the largest number of positively selected genes. Protein functions of these genes are mainly related to olfaction, taste, and tumor suppression. Extensive genetic modification presents a major strategy in response to global changes in these alpine species.
Introduction
Moving away, persisting via local adaptation or phenotypic plasticity, or extinction are the three outcomes of a natural population response to environmental changes (Chevin et al. 2010). To survive under environmental extremes requires to adapt through behavioral, morphological, or physiological means, and these may differ even among closely related species (Hoffmann and Sgro 2011). The effectiveness of these responses influences evolutionary dynamics, population demography, and ultimately the survival in the wild. Discovering the demographics and population genetics that coincide with responses to environmental change and their underlying genetic adaptations are now major tasks in biological research (Franks and Hoffmann 2012). Development of sequencing technologies and data analysis methods now allows evolutionary reconstruction of the climate responses at the genome level.
The extinction and population decrease of large mammals since the late Quaternary have received much attention in recent scientific studies (Stuart et al. 2004; McClenachan et al. 2016). Megafaunal extinctions reshaped the structure of terrestrial ecosystems (Malhi et al. 2016; Galetti et al. 2018). Rodents, bats, lagomorphs, and insectivores are now the common and dominant mammal groups in most regions, and relative species richness of rodents is predicted to increase further within the next 50 years (Davis et al. 2018). Small mammals, particularly rodents, are also reservoirs and hosts for diverse zoonotic diseases (Guzzetta et al. 2017; Rabiee et al. 2018), and thus the population dynamics and range shifts of these species affect the origin and transmission of potential pathogens into humans. However, the evolutionary mechanisms that drive speciation and adaptation of these species remain poorly explored.
The recent population size dynamics and range expansion of commensal rodents, such as brown rats (Rattus norvegicus) (Deinum et al. 2015; Puckett et al. 2016; Teng et al. 2017; McClelland et al. 2018; Zeng et al. 2018; Suzuki et al. 2019) and house mice (Mus musculus) (Jing et al. 2014; McClelland et al. 2018), have largely been linked to activities and migrations of humans. These rodents are now the most successful invaders in the world, affecting human history by transferring plague, hantavirus, Anjozorobe virus, and others (Liu et al. 2017; Rabiee et al. 2018; Raharinosy et al. 2018). However, wild species closely related to these commensal rodents are abundant in nature and also play important roles as pathogen reservoirs and transmitters, whereas the population dynamics and range changes have been poorly explored. The lack of comprehensive field surveys and studies on the evolution and demographic history of these species may leave humans unprepared to epidemic outbreaks.
White-bellied rats (Niviventer Marshall, 1976) are among the most speciose and dominant mammals in forest ecosystems from Southeast Asia to North China. Previous studies clarified the phylogenetic relationships and taxonomy of different species complexes in this genus, with approximately 23 species recognized (Musser 1981; Musser and Carleton 2005; Denys et al. 2016; Zhang, He, et al. 2016; Ge et al. 2018; Ge, Feijó, et al. 2020). These species have shown rapid speciation since the late Miocene (Lu et al. 2015; Zhang, He, et al. 2016) and are ideal taxa for studying the adaptive evolution of terrestrial mammals that diversified in one of the most complex geological environments on Earth. Species of Niviventer serve as vectors of hantavirus (Wang et al. 2000; Cao et al. 2010; Lin et al. 2012; Hu et al. 2014; Ge et al. 2016; Dai et al. 2019), Lyme disease-related Borrelia (Masuzawa et al. 2001), Tsutsugamushi disease caused by Rickettsia tsutsugamushi (Latif et al. 2017), and Babesisosis, a tick-borne disease (Saito-Ito et al. 2008), among others. Ambiguity in the demographic history of these animals impedes a comprehensive understanding of their current status and may bias future monitoring of their population dynamics.
In the present study, we aimed to infer the demographic histories of Niviventer species combining coalescence methods and environmental range reconstructions under late Quaternary climate change. These individual scenarios are placed in a phylogenetic framework that establishes transitions in habitat association, in particular with regard to the altitudinal range of each species. Whole-genome data for each species then illuminate the primary genetic differences underlying the evolutionary dynamics of these range shifts. Combined with the information on demographic and phylogenetic history, these data can address fundamental questions about the genomic basis of range shifts, and in particular the effect of shifts to extreme conditions at high altitude, compared with generalist species with wider climatic amplitude. Establishing which genes are under positive selection in species associated with different climatic range, allows inferences about the genomic basis of habitat shifts in an important adaptive radiation, and can help answering the question of how wild rats will respond to climatic changes in future.
Results
Phylogeny, Origin, Hybridization, and Divergence Time of Niviventer
Mitochondrial cytochrome b (CYTB) gene from 1,304 individuals including 117 sequences newly generated in the presented study was used in phylogenetic analyses (supplementary table 1, Supplementary Material online). Moreover, we shotgun sequenced the genome of 15 Niviventer species, two species of Chiromyscus, and R. andamanensis at 14× coverage on an average (38.68 ± 4.18 Gb, range 32.11–45.94, corresponding to 11.7–16.7× genome size of R. norvegicus). Phylogenetic reconstructions were based either on the CYTB gene alone, 13 protein-coding genes of the mitochondrial genome (MTG), or the single-copy orthologs (SCOs) extracted from autosomal scaffolds (supplementary tables 1–3, Supplementary Material online). Between 1,812 and 3,448 SCOs were identified for each sequenced Niviventer species. For MTG and SCOs, we reconstructed the phylogeny of Niviventer by using concatenation of all genes. Moreover, for the SCOs, we estimated species trees using unrooted gene trees under the multispecies coalescent model to account for incomplete lineage sorting. All analyses supported the monophyly of Niviventer (fig. 1 and supplementary figs. 1A and 2A, Supplementary Material online), with Chiromyscus as its sister taxon based on CYTB, but two species of Chiromyscus presented as paraphyletic using MTG and SCOs with regard to Niviventer. Phylogeny reconstructed using SCOs by concatenation and ASTRAL (Zhang et al. 2018) are similar in phylogenetic structure, which recognized the sister relationship of NESC and NASC (fig. 1).

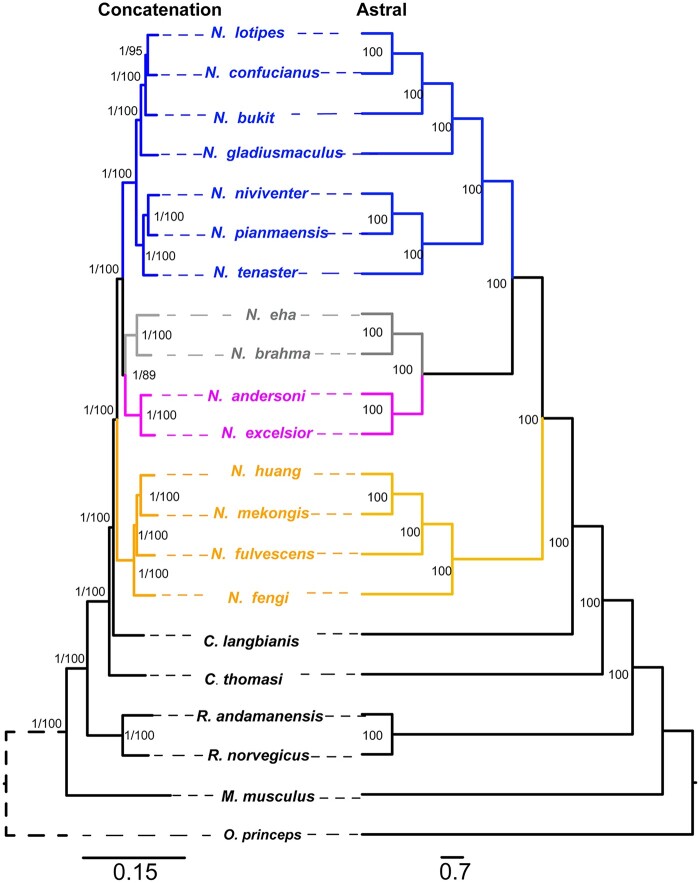
Phylogeny of Niviventer reconstructed based on SCOs of the genome. SCOs were analyzed using the concatenation and ASTRAL methods, respectively.
Within Niviventer (fig. 1), four species complexes identified previously were found to be monophyletic: 1) the N. eha species complex (NESC, N. eha and N. brahma), endemic to the mountainous regions of the southeastern Qinghai-Tibet Plateau (QHTP) and western Yunnan and inhabiting the highest elevation among all extant wild murids; 2) the N. andersoni species complex (NASC, N. andersoni and N. excelsior), distributed at middle to high elevations on the southeastern and southwestern QHTP, and in the Qingling Mountains and southeastern Wuling Mountains; 3) the N. niviventer species complex (NNSC, N. bukit, N. confucianus, N. tenaster, N. niviventer, N. pianmaensis, N. gladiusmaculus, N. culturatus, N. coninga, N. lotipes, etc.), widely distributed in Southeast Asia, from the southeastern QHTP to North of China; and 4) the N. fulvescens species complex (NFSC, N. hinpoon, N. rapit, N. cremoriventer, N. huang, N. fengi, N. fulvescens, etc.), extending farther south in Asia, with a distribution in Southeast and Central China (Lu et al. 2015; Zhang, He, et al. 2016).
Phylogenetic networks reconstructed using the Autumn algorithm (Huson and Linz 2018) recovered three networks, each of them showing three hybridization events (fig. 2A–C). Hybridization was inferred 1) between the ancestors of NESC and NFSC; 2) the common ancestor of N. huang and N. mekongis with N. fulvescens; 3) the common ancestor of N. huang and N. mekongis with N. fengi to generate N. fulvescens; 4) the common ancestor of NESC with a clade of NNSC (N. pianmaensis and N. niviventer) to generate NASC; 5) as well as between N. fulvescens and N. fengi. Inferring the species network using maximum pseudolikelihood (Yu and Nakhleh 2015) and Bayesian inference (Wen et al. 2016) in Phylonet identified four hybridizations, which not only occurred between the ancestors of Niviventer, but also between Niviventer and Chiromyscus (fig. 2D and E). Analyses in Phylonetworks (Solís-Lemus et al. 2017) recognized four hybridizations (fig. 2F): NNSC proposed as a hybrid of the common ancestor of NASC and NESC with the common ancestor of N. huang and N. mekongis. Inheritance values (γ) for the former is 0.969, whereas that of the latter is 0.031. The common ancestor of NESC and NASC hybridized with the ancestor of NASC (γ = 0.025, 0.075, respectively). The ancestor of N. niviventer and N. pianmaensis hybridized with the ancestor of N. tenaster (γ = 0.857, 0.143, respectively), N. confucianus hybridized with N. lotipes (γ = 0.965, 0.035, respectively).
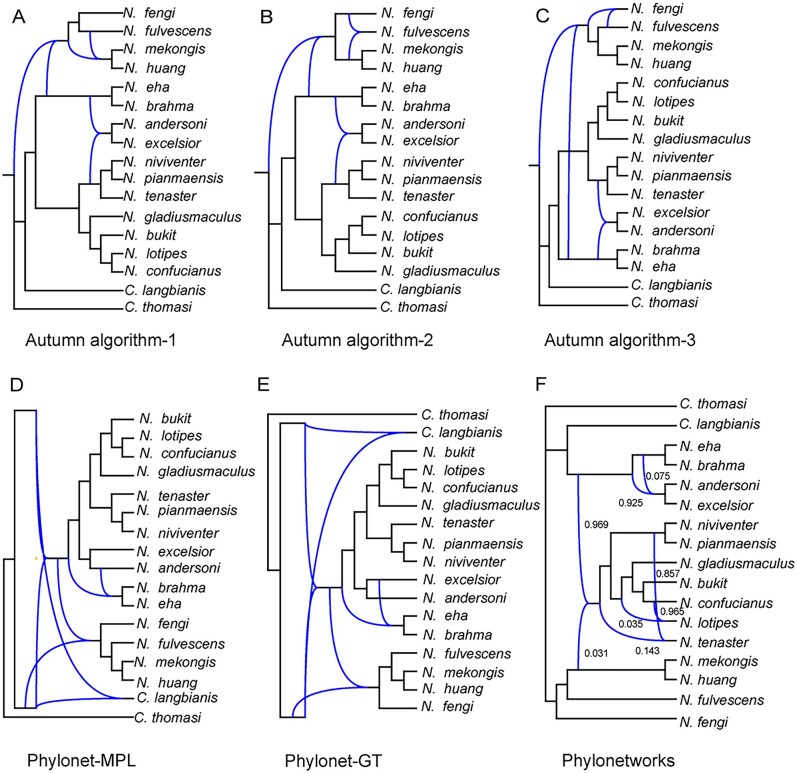
Phylonetworks inferred using four different methods. Analyses were based on the best gene trees reconstructed using maximum likelihood in RaxML.
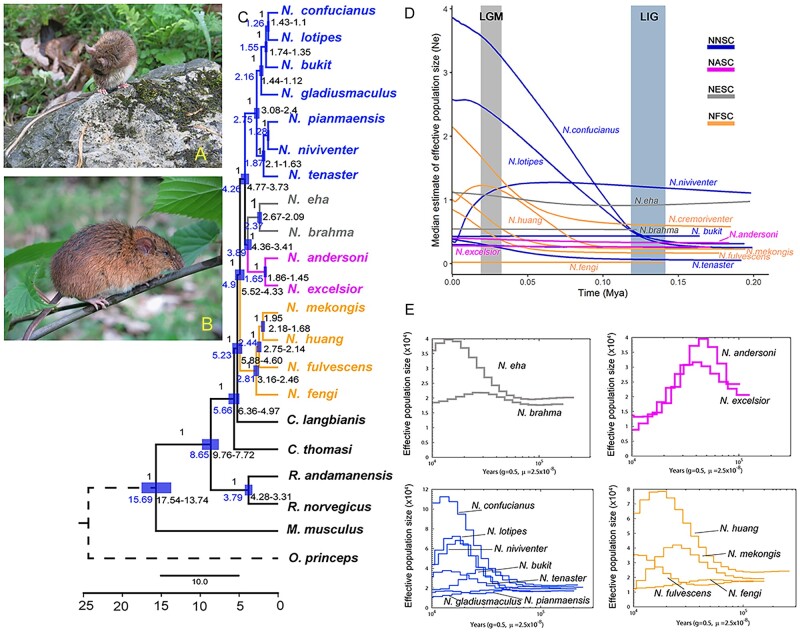
Profiles, divergence time, and demographic history of Niviventer. (A) N. andersoni. (B) N. huang. Photographer: Deyan Ge. (C) Divergence time of Niviventer inferred using SNP sites of all SCOs. (D–E) Demographic history of species within Niviventer inferred based on CYTB using EBSP (D) and PSMC based on the whole-genome data (E).
The divergence time of Niviventer based on MTG was dated to the late Miocene, at ∼6.49–4.99 Ma (supplementary fig. 2B, Supplementary Material online). The split of NESC and NFSC was dated to 6.05–4.63 Ma, and the split of NASC and NNSC was dated to 5.78–4.42 Ma. The divergence time of Niviventer based on SCOs of the genome was dated to 5.88–4.60 Ma (fig. 3C). The split of NFSC was dated to 3.16–2.46 Ma. Divergence of NESC and NASC was dated to 4.36–3.41 Ma. Divergence of NNSC was dated to 3.08–2.4 Ma. These results highlighted a rapid speciation of Niviventer since the late Miocene.
Biogeographic history reconstruction of Niviventer using statistical Dispersal-Vicariance Analysis (S-DIVA) and Bayesian Binary MCMC (BBM) by the trees generated from MTG and SCOs revealed its origin on the southeastern QHTP (fig. 4A–D). Four major geographical scenarios were detected in the evolution of these animals: 1) NESC remained on the southeastern QHTP and in western Yunnan and did not shift its range; 2) NASC expanded to the high mountains surrounding the southeastern and eastern QHTP to the Qingling and Wuling mountainous region in China; 3) NNSC dispersed to the southeast, center and north of China and mountainous regions in Southeast Asia; and 4) NFSC dispersed to Southeast Asia and southeastern China. Reconstruction of elevational evolutionary history of this genus using the tree generated from BEAST analyses based on the whole-genome data revealed this taxon probably originated at ∼2,100 m (supplementary fig. 3, Supplementary Material online).
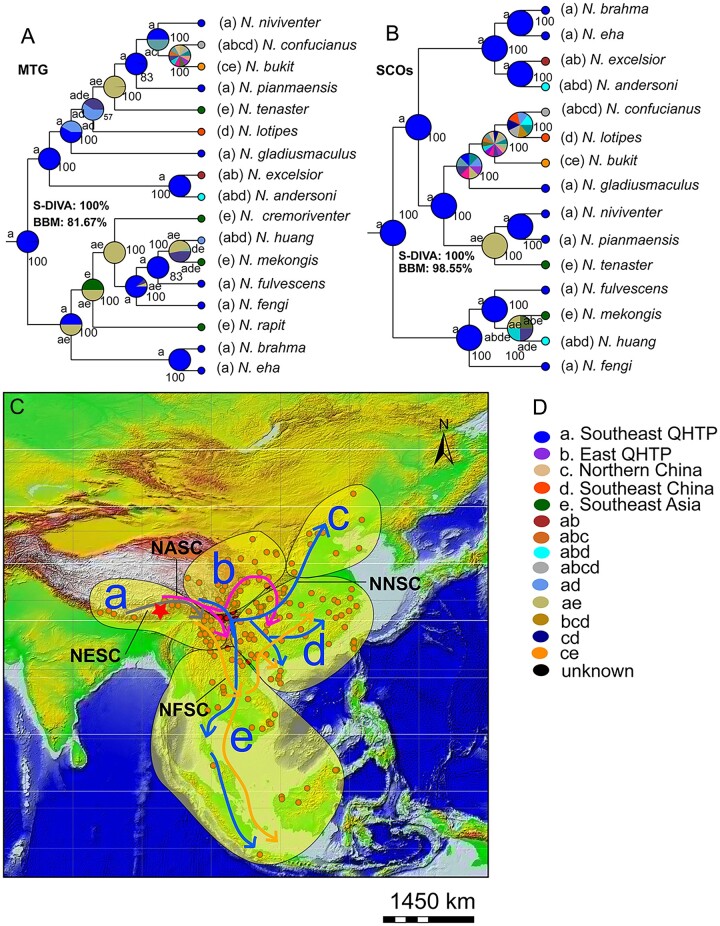
Phylogeographic evolution of Niviventer. MTG (A) and SCOs of the whole genome (B) were analyzed separately. Both S-DIVA and BBM methods supported an origination history of Niviventer from southeast QHTP.
Demographic History and Range Shifts of Niviventer
Tajima’s D, Fu and Li’s D, Fu and Li’s F, and Fu Fs tests and mismatch tests showed significant population size increases in N. confucianus, N. lotipes, N. mekongis, N. niviventer, and N. huang (supplementary table 4 and fig. 4, Supplementary Material online). Inference of demographic history from variation in mitochondrial CYTB using Extended Bayesian Skyline Plots (EBSP) in BEAST (Drummond and Rambaut 2007) revealed marked population size increases for the same five species, all of which inhabit wider ranges when compared with their congeners (supplementary fig. 1, Supplementary Material online). Clear population size increases were also evident in N. tenaster, N. fulvescens, and N. eha. The first two species are distributed in the mountainous region in southeast Asia and in southeast of the QHTP, whereas N. eha occurs on the QHTP at high elevations. There was little change in the population sizes of middle to alpine mountain species, including N. fengi, N. brahma, and N. bukit. Niviventer andersoni and N. excelsior also showed a relative stable population size, but dramatic population size decreases were showed using the autosomal genome data. Niviventer huang in Southeast China showed initial population size increase, but its population size dramatically decreased in the last 0.025 Ma (fig. 3D and supplementary fig. 5, Supplementary Material online). Niviventer niviventer demonstrated a trend of decreasing population size since 0.05 Ma. The analysis of demographic history from heterozygous sites in the nuclear genome using the pairwise sequential Markovian coalescent (PSMC) model (Li and Durbin 2011) was generally consistent with the above conclusions (fig. 3E). We identified population size increases in N. confucianus, N. lotipes, N. bukit, N. eha, and N. mekongis, population size decreases in N. andersoni, N. excelsior, N. niviventer, and N. fulvescens; and population size stability in N. brahma, N. fengi, and N. pianmaensis, the last of which were confined to small regions on the southeastern QHTP (fig. 3E).
Genes under Positive Selection
Genome scanning by PosiGene with validation in PAML revealed N. eha has the largest number of positively selected genes among the four species complexes based on the present data sets (Table 1, supplementary table 5, Supplementary Material online). Bayesian inference using these genes revealed clear topological inconsistency when compared with the species tree reconstructed using the whole data set of SCOs (fig. 5), which implies adaptive evolution in these genes.
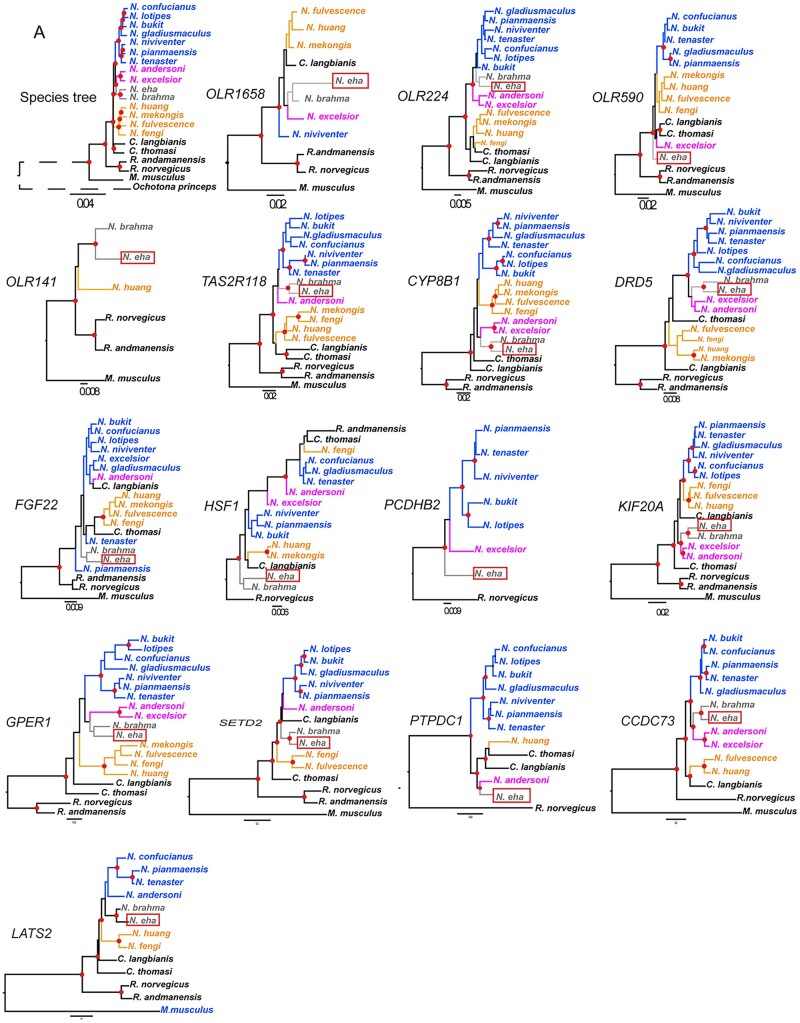
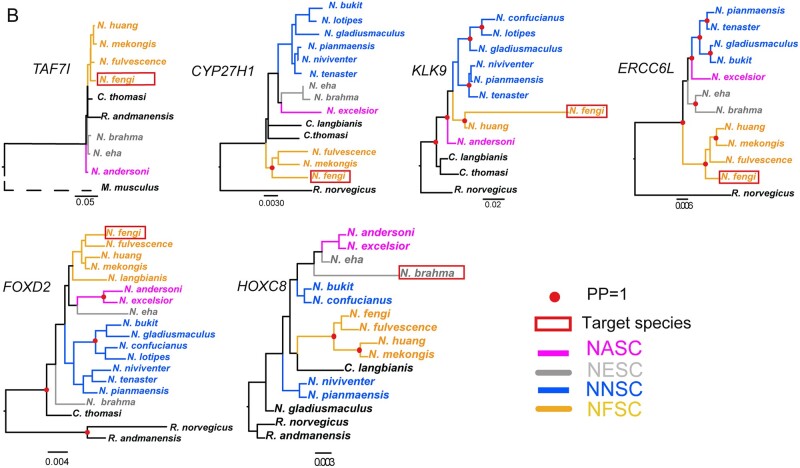
Species tree of Niviventer compared with gene tree of positively selected genes. (A) Species tree, gene trees of OLR1658, OLR224, OLR590, OLR141, TAS2R118, CYP8B1, DRD5, FGF22, HSF1, PCDHB2, KIF20A, GPER1, SETD2, PTPDC1, CCDC73, LATS2. These genes are positively selected in N. eha. (B) Gene tree of TAF71, LOC100909462, KLK9, ERCC6L, FOXD2, HOXC8. The first five of them are positively selected in N. fengi, and the last one of them was positively selected in N. brahma. Node marked with red points with posterior probabilities (pp) =1. Genes present in less than five species were not used to reconstruct gene tree.
About 17 genes of N. eha showed a P value <0.05 (supplementary table 5, Supplementary Material online). These included four genes from the olfactory receptors (OLR141, OLR1658, OLR224, OLR590), two genes from the taste receptors (TAS2R114, TAS2R118), coiled-coil domain containing 73 (CCDC73), cytochrome P450 family 8 subfamily B member 1 (CYP8B1), dopamine receptor D5 (DRD5), fibroblast growth factor 22 (FGF22), G protein-coupled estrogen receptor 1 (GPER1), heat shock factor 1(HSF1), kinesin family member 20 A (KIF20A), large tumor suppressor kinase 2 (LATS2), protocadherin beta 2 (PCDHB2), protein tyrosine phosphatase domain containing 1 (PTPDC1), and SET domain containing 2, histone lysine methyltransferase (SETD2, fig. 6 and supplementary fig. 7, Supplementary Material online).
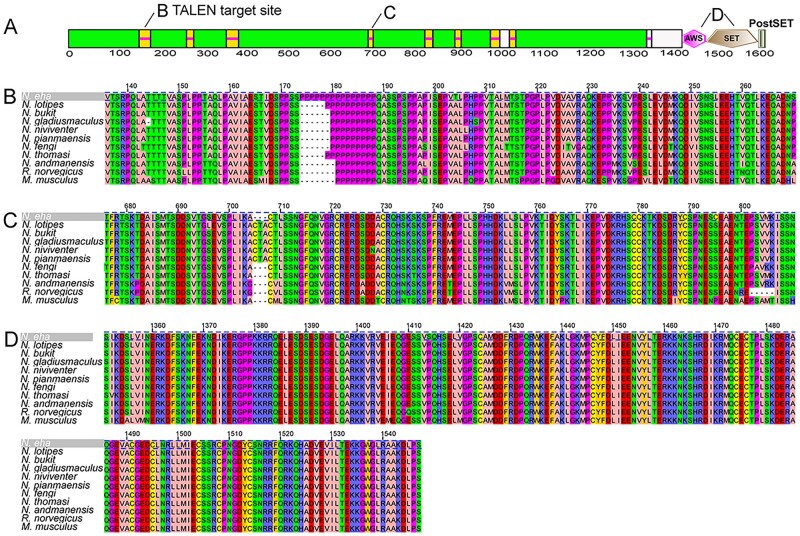
Mutation in partial protein sequence of SETD2. (A) Protein structure predicted in SMART, and the location of annotated domain from 1 to 1,600. (B) 136–270 of SETD2. (C) 676–810 of SETD2. (D) 1,350–1,547 of SETD2.
Five genes were identified as positively selected in N. fengi, cytochrome P450, family 27, subfamily b, polypeptide 1 (CYP27B1), forkhead box D2 (FOXD2), TATA-box binding protein associated factor 7-like (TAF7L), ERCC excision repair 6 like, spindle assembly checkpoint helicase (ERCC6L), and kallikrein related-peptidase 9 (KLK9). One gene, homeobox C8 (HOXC8), was identified as positively selected in N. brahma (supplementary table 5, Supplementary Material online).
GO enrichment analyses of biological processes revealed N. eha had 24 significantly enriched functions (supplementary table 6, Supplementary Material online). G protein-coupled receptor signaling pathway, sensory perception of chemical stimulus, and cell cycle process ranked as the top three enriched functional categories. Some of these positively selected genes, for example, SETD2 (fig. 6), HIF1, LATS2 were involved in multiple biological processes, which means they are pleiotropic genes and playing diverse roles in local adaptation. However, N. fengi and N. brahma have too few genes identified as under positively selection, and no significant enriched biological pathway was detected in these two species based on the present data set.
Niche Evolution in Niviventer
Models of the effects of climate change on species distributions using ecological niche models (ENMs) revealed marked overall temporal range shifts in Niviventer species (fig. 7 and supplementary fig. 7, Supplementary Material online). The transition from Last Interglacial (LIG) to the cold and arid Last Glacial Maximum (LGM) increased the suitable areas for white-bellied rats by 43%, whereas the transition from the LGM to warmer contemporary conditions decreased the area by 39%. Thirty years from now, suitable habitats are expected to expand southward in low elevations by ∼9% (supplementary table 7, Supplementary Material online). Nevertheless, idiosyncratic responses to range shifts over time were observed across species (fig. 7). Most species showed alternating cycles of range expansion and contraction from the LIG to future scenarios (e.g., N. cremoriventer, N. fulvescens N. mekongis, and N. rapit), whereas a few exhibited a continued decline (N. andersoni) or expansion (N. huang) of suitable areas through the Quaternary. The suitable area of nine species will be reduced by up to 66% (fig. 7A and supplementary table 7, Supplementary Material online), species endemic in middle to high elevation will shift upward under the future global warming, whereas those at lower elevation will expand and then the average elevational range of these species will decrease (fig. 7A and supplementary table 7, Supplementary Material online). Future climate change will mostly negatively affect species with subtropical and temperate distributions and those that inhabit high elevations. Conversely, for five species, the ongoing global warming will lead to an expansion of suitable habitats of up to 58% (fig. 7). These species mainly show a tropical distribution in Southeast Asia and in the southern portion of QHTP or inhabit a wide elevation range in subtropical zones, reflecting their adaptation to contrasting climatic conditions. Notably, N. eha will increase its distribution toward the QHTP, while reducing its range in low elevation areas.
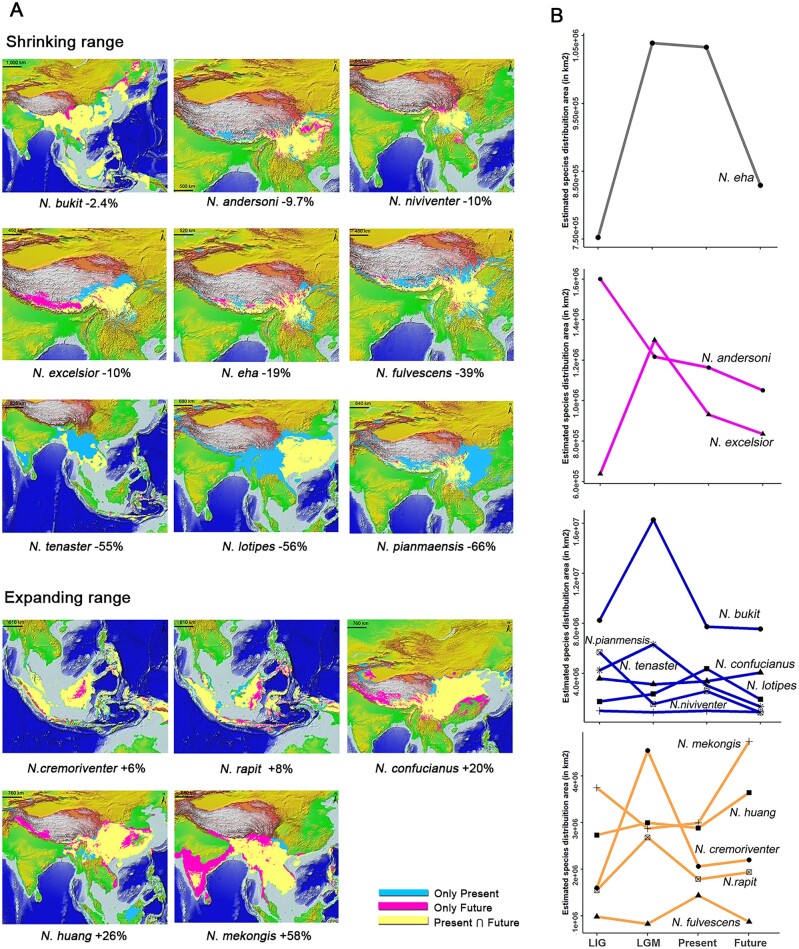
Temporal shifts in suitability areas of Niviventer species. (A) Present (blue) and future (pink) modeled distributions overlapped, showing the intersection area (yellow). (B) Trends in suitability area shifts through LIG, LGM, present and future, the color of lines represent different species complexes, which are same as figures 1 and 3.
The age-range correlation analysis showed a marked range overlap between sister species in recent nodes (supplementary fig. 8, Supplementary Material online), and a negative but nonsignificant relationship between range overlap and phylogenetic age (intercept 0.476, P = 0.34; supplementary fig. 8A, Supplementary Material online). When reconstructing the climatic tolerance of species, we detected one major split in the early stages of Niviventer evolutionary history, resulting in a tropical environment-adapted clade formed by the NFSC and temperate environment-adapted clades formed by the remaining species (supplementary fig. 8C, Supplementary Material online). Within the NFSC, three species (N. huang, N. fulvescens, and N. mekongis) later converged toward a more temperate climate. Interestingly, four of the five species predicted to undergo range expansions in the future belong to this tropical environment-adapted clade.
Discussion
Out of Tibet: The Geographical Evolution of Niviventer
The QHTP is a young and large high-altitude plateau. Prior to the uplift in the early to the middle Miocene, this region was characterized by warm and humid environments (Zhang, Ao, et al. 2016; Li, Zhou, et al. 2020), as evidenced by warm-climate C4 grasses present as a significant dietary component of ancient herbivores on the QHTP (Wang XM, Wang Y, et al. 2015). Until recently, the QHTP harbored many large mammals that went extinct in the late Quaternary, and these species likely began shifting their ranges away from Tibet beginning with cooling at the end of the Pliocene (Deng et al. 2011; Wang et al. 2016). Biogeographic shifts out of Tibet have been hypothesized for several large mammalian lineages, including an ancestral woolly rhinoceros, Coelodonta thibetana (Wang et al. 2013; Wang XM, Wang Y, et al. 2015); the early sheep, Protovis himalayensis (Wang et al. 2016); a hypercarnivorous canid, Sinicuon cf. dubius (Wang, Li, et al. 2015); a pantherine cat, Panthera blytheae (Li et al. 2014); the running hyena, Chasmaporthetes gangsriensis (Tseng et al. 2013); and an ancient Arctic fox, Vulpes qiuzhudingi (Wang et al. 2014).
The out-of-Tibet concept postulates that the uplifting QHTP acted as a “cradle of evolution” for cold-loving ice age mammals (Wang et al. 2014). Small mammals are excellent indicators for understanding the response of animals to regional environmental changes and ecosystem health. They show high diversity with verifiable geographical evolutionary histories, and thus can serve as models for studying regional biodiversity and faunal changes (Leis et al. 2008; Barnosky et al. 2012). For example, pikas (Ochotona spp.) as the keystone species of the QHTP (Smith and Foggin 1999; Lai and Smith 2003) are good examples of small mammals that originated on the QHTP and dispersed to Eurasia, Africa, and North America. However, pikas have experienced dramatic extinction and contraction in a wide range outside of the QHTP (Ge et al. 2013; Wang et al. 2020). They therefore represent relic mammalian taxa that were adapted to a cold environment before leaving the QHTP but now show a trend of retracting to the QHTP under global warming.
In this study, we inferred the geographical origin of the genus Niviventer on the southeastern QHTP. The NASC, NNSC, and NFSC lineages of this genus present good examples of extant mammals that adapted to temperate and tropical environments after leaving the QHTP. However, the NESC, the earliest diverging clade within Niviventer, is confined to the QHTP. These results indicate that the QHTP not only is the cradle for cold-loving species but also initiates the diversification of mammalian taxa, which now disperse to tropical and temperate regions.
Adaptive Genetic Evolution in Niviventer
Positive natural selection, or the tendency of beneficial traits to increase in prevalence in a species, is the driving force behind adaptive evolution. Genome level scans identified N. eha as having the largest number of positively selected genes among Niviventer species, here interpreted as adaptive genetic changes associated with the high-altitude environment on QHTP. Five positively selected genes were identified in N. fengi, also present at high altitude but endemic to the Jilong Valley in the southeastern QHTP where it is sympatric with the much more widely distributed N. eha. The range expansion toward the QHTP and the population size increase of N. eha highlights its adaptation to the high elevations, likely via the fixation of many new advantageous alleles, particularly those involved in olfactory sensitivity, taste, and tumor suppression. Small population size can be assumed to have resulted in the rapid fixation of these advantageous alleles, as currently evidenced by N. eha.
The expansion of N. eha within the QHTP likely coincided with rapid genetic modification in response to global warming. Surprisingly, the greatest number of genes under selection was in the olfactory receptor genes (OLR141, OLR224, OLR590, OLR1658), the largest gene family in the mammalian genome (Buck and Axel 1991). The types of genes detected in these scans provide insight into the adaptations that coincide with the high-altitude habitats. The ability of this species to distinguish food resources and to discovery predators timely influences their survival and reproductive capacity. Reduction of olfactory sensitivity during hypoxia is a common symptom of altitude sickness. Living on the QHTP likely has some selective regime affecting olfaction of N. eha. Moreover, genes of taste receptor (TAS2R114, TAS2R118) are under positive selection, which provide additional evidence that adaptations to an environment where olfaction and taste play an important role for survival, more so than in middle or low altitude habitats (Lossow et al. 2016). However, high-quality genome assemblies and annotations for these species are still needed for detailed study on the evolution of these genes due to their large number and high similarity.
A recent study revealed a high risk of cancer occurrence as a result of evolutionary adaptations to cold environments (Voskarides 2018). Consistent with this finding, several positively selected genes of N. eha regulate important biological processes that may be involved in suppression of cancer occurrence. SETD2 acts as an epigenetic modifier with tumor suppressor functionality (Li et al. 2016), and also regulates the maternal epigenome, genomic imprinting, and embryonic development (Xu et al. 2019). SETD2 shows high level of nucleotide variation in Niviventer, particularly in the TALEN target sites region, whereas the main functional domains in AWS (associated with SET) and SET are highly conservative (fig. 6). DRD5 inhibits tumor growth (Leng et al. 2017). LATS2 is a core member of the Hippo pathway that regulates organ size (Aylon et al. 2016). FGF22 plays important roles in regulating impairment of ribbon synapses (Li, He, et al. 2020), as well as cutaneous development and repair (Beyer et al. 2003). PCDHB2 is involved in cell adhesion (Carter et al. 2010). Moreover, KIF20A regulates the division modes of neural progenitor cells during cortical development (Geng et al. 2018). HSF1 was discovered as a transcriptional response to elevated temperature shock, and also regulates mevalonate and cholesterol biosynthesis pathways (Li et al. 2017). CYP8B1 catalyzes cholic acid synthesis in the liver and then regulates fat absorption (Jahan and Chiang 2005). GPER1 is believed to be involved in emotional and cognitive functions and stress control (Jahan and Chiang 2005). Molecular variation of these genes in N. eha likely enhances its ability to cope with recent environmental changes on the QHTP.
The positively selected genes identified in N. fengi are different from N. eha even though two species slightly overlap in the southeastern QHTP. Among these genes, FOXD2 is critical to control of the cell cycle and metabolism (Johansson et al. 2003). ERCC6L is a DNA helicase. It is involved in cell proliferation and associated with embryonic development and in maintaining growth (Yin et al. 2011). Kallikrein-related peptidases, including KLK9, have been reported to possess functions in innate immunity and inflammation (Filippou et al. 2020). For the only one identified positively selected gene of N. brahma, HOXC8 is a homeobox gene family member, which is essential for growth and differentiation; over expression of HOXC8 reduces cell adhesion and concomitant cell migration, and regulates tumor growth (Ruthala et al. 2011).
In contrast, species present with mostly midaltitude ranges, even if extended into the high elevation, show no genes under positive selection, as is evident in N. niviventer, N. fulvescens, N. andersoni, N. pianmaensis, N. gladiusmaculus, and N. excelsior. This is despite some obvious morphological adaptations, for example, the divergent external and cranial dental morphologies of N. andersoni. This species is the largest species of Niviventer, but we did not detect positively selected genes in the nuclear genome of this species. In contrast, N. eha is the smallest species, yet showed the largest number of positively selected genes. This suggests that genetic adaptive changes detected in genome scans do not primarily detect the kind of changes leading to morphological adaptive evolution, but rather reveal physiological (growth and cell proliferation) and sensorial (taste, olfaction) functions. The ease with which genomes scans of the kind used here can be implemented, adaptive radiations of a wide range of species can be investigated to link the signatures of genomic selection to specific adaptive shifts in life style, environmental conditions, morphological features or other traits, as well as demographic changes that may be needed for the rapid fixation of adaptive mutations.
Ecological Differentiation and Demographic History of Niviventer
In the genus Niviventer we can distinguish two major lineages separating the mostly temperate and tropical NASC, NNSC, and NFSC lineages from the early diverging NESC complex confined to the cold conditions of the QHTP. These apparent climatic adaptations could be linked to idiosyncratic responses to temporal range shifts in Niviventer species. Most species in the tropical environment-adapted NFSC clade are expected to expand their range in the future under global warming (Dallmeyer et al. 2017). Likewise, the habitat generalist, N. confucianus will experience a range increase of 20%, likely related to increasing vegetation in central to northern China (Li, Chen, et al. 2015). Niviventer eha, which occupies the highest elevations among Niviventer species, displayed a clear trend of expansion in terms of both population size and potential range toward higher areas of the QHTP. This pattern is different from that of other species restricted to a small range on the southeastern QHTP and in western Yunnan. For example, N. brahma (sister species of N. eha), N. pianmaensis, and N. fengi are confined to small regions located on the southeastern QHTP, the most complex terrain shaped by deep valleys, rivers, and high mountains, which likely prohibit their range expansion. Future climate change will drive these species to move to higher elevations (supplementary table 7, Supplementary Material online).
Ecological differentiation analyses suggest that either sympatric speciation plays an important role in Niviventer diversification or the spatial overlap may represent climate segregation along mountain slopes. For example, although there is a very high degree of range overlap among species in NNSC (supplementary fig. 1, Supplementary Material online), we detected marked disparities in climatic tolerance, especially in temperature-related traits, such as the presence of spines on the skin, suggesting that the species have adapted to distinct conditions along mountain slopes.
Inferences from climatic envelope modeling were largely consistent with demographic population models from mitochondrial markers and genome data. Niviventer confucianus showed the most prominent population size increases (fig. 3), probably due to its high tolerance of habitat variation. This species can be considered native “weedy” species that have recently risen in dominance (Rowe and Terry 2014). Interestingly, we did not identify significant positively selected genes in N. confucianus. Together with N. eha, which is expanding in population size and range toward high elevations, possibly driven by decreased predation from carnivores and competition with other herbivores, these species may threaten human health and ecosystem safety since most reports of hantavirus in Niviventer were from these two species (Cao et al. 2010; Lin et al. 2012; Ge et al. 2016).
Conversely, the mid-to-high elevation species N. niviventer, N. andersoni, N. excelsior, and N. fulvescens showed a trend of decreasing population size based on PSMC analysis and a decreasing in suitable future areas, which was correlated with climate warming and a gradual increase in the impact at these elevations. The population decline of N. huang mirrored the rapid population increase of humans in Southeast China since this species was confined to a lower elevation, where the development of agriculture and forestry accelerated the change in land usage (Shi et al. 2018).
In summary, the genus Niviventer originated on the QHTP, successfully dispersed from the QHTP, and adapted to temperate and tropical regions in Asia. The NASC, NFSC, and NNSC successfully left the QHTP, but they showed different demographic histories in response to global environmental changes. Species from Southeast Asia and “weedy” species showed a clear trend of population expansion. Interestingly, N. eha, a wild rat living at high elevations showed clear trend of population increase. Genetic modifications of this species are mainly related to olfaction, taste, and tumor suppression. Deep-level sequencing and functional validation of these positively selected genes are needed for a more comprehensive understanding of the adaptive evolution of Niviventer.
Materials and Methods
Field Work and Sampling
The liver or muscle samples of rodents used in the present study were collected by the Institute of Zoology, Chinese Academy of Sciences (IOZCAS, Beijing, China); Kunming Institute of Zoology, Chinese Academy of Sciences (KMIOZCAS, Kunming, China), the National Institute for Communicable Disease Control and Prevention (ICDCP, Beijing, China); and the Zoological Institute of the Russian Academy of Sciences (ZIN, Saint Petersburg, Russia). All these samples were preserved in 95% ethanol at −40 °C before extraction. Total DNA was extracted by using a Qiagen DNeasy Blood and Tissue Kit (Germany). Detailed information for molecular voucher specimens included in the present study is provided in supplementary table 1, Supplementary Material online, which includes collection locations, longitude, latitude, elevation, GenBank accessions, and museums or institute where we preserved the collected specimens. All animal specimens were collected in accordance with the policy of the animal care and use policies of each institution.
Sequencing of Mitochondrial DNA Markers
Historical collections of Niviventer, particularly species within the NFSC and NNSC, are easily misidentified when using morphology. To avoid such misidentification in the following analyses, we included Cytochrome b (CYTB) sequences from 1304 individuals of Niviventer, 117 of which were newly obtained in the present study. The CYTB sequences were amplified using the universal primers for mammals L14723 and H15915 (Irwin et al. 1991). PCR products were directly sequenced in both directions using ABI technology. Accessions and detailed collection information for these sequences are provided in supplementary table 1, Supplementary Material online.
Whole-Genome Sequencing
15 species of the genus Niviventer, two species of Chiromyscus (C. langbianis and C. thomasi), and one species of Rattus (R. andamanensis) were selected for whole-genome sequencing (supplementary table 2, Supplementary Material online). Whole-genome DNA was fragmented to an average length of 350 bp using a Covaris instrument. The fragmented DNA was end-polished, A-tailed, and ligated to Illumina sequencing adaptors using a TruSeq Nano DNA HT Sample Preparation Kit with further PCR amplification. The PCR products were purified (AMPure XP system), and the libraries were analyzed for size distribution by an Agilent 2100 Bioanalyzer and quantified using real-time PCR. The paired-end libraries were submitted for paired-end sequencing (2 × 150 bp) on an Illumina HiSeq 1500 instrument. Sequencing was conducted by Novagene (Beijing, China).
Genome Data Quality Control
The raw read data of each species were tested and filtered using fastp (Chen et al. 2018), which is a fast, all-in-one preprocessor for quality control of FASTQ files. Low-quality bases with Phred score <20 were clipped from the 5′ and 3′ ends of reads. Adapters and low-quality and duplicated reads were filtered out. The quality of the cleaned data was measured using FASTQC (Schmieder and Edwards 2011; Patel and Jain 2012).
Genome Assembly
We used MEGAHIT 1.2.8 (Li, Liu, et al. 2015) for de novo assembly using the default settings. To evaluate genome completeness, we used BUSCO 3.0.2 (Simão et al. 2015) to estimate the percentage of expected conserved single-copy orthologs captured in our assemblies by using data for Glires as a reference (Kriventseva et al. 2019).
Phylogenetic Reconstruction
We established three data sets with which to reconstruct the phylogeny of Niviventer based on genome level data sets: 1) CYTB sequences of 1331 individuals by including outgroup taxa; 2) the complete MTG of 23 species, including 17 Niviventer species; and 3) the concatenated data sets of SCOs extracted from the whole-genome sequencing data, 15 of which belonged to Niviventer, with six outgroup species: C. thomasi, C. langbianis, R. andamanensis, R. norvegicus, M. musculus, and Ochotona princeps.
We appended the newly obtained CYTB sequences with those of previous studies, and aligned these sequences in MUSCLE 3.8.31 (Edgar 2004). We selected the best nucleotide substitution models using PartitionFinder 2.1.1 (Lanfear et al. 2017), with the three codon positions of CYTB split into different partitions. We performed Bayesian inferences using 8,000,000 generations with four independent runs in MrBayes 3.2.7 (Ronquist et al. 2012). We summarized the tree by discarding the first 25% of trees as burn-in.
To reconstruct the phylogeny based on the MTG, we used NOVOPlasty (Dierckxsens et al. 2017) to assemble the MTG from the whole clean reads. The MTG of R. norvegicus (KM577634) was used as a reference. We used MitoZ 2.4 (Meng et al. 2019) to annotate these sequences. Whole mitochondrial DNA sequences with annotation information from 18 species were submitted to GenBank under accession numbers MW193727–MW193744, and detailed information for these data is provided in supplementary table 2, Supplementary Material online.
Complete MTG sequences of N. rapit (KY117572) and N. cremoriventer (KY117573) were downloaded from GenBank. These genomic data from GenBank were annotated with MitoZ. Thirteen protein-coding sequences from newly sequenced taxa and those downloaded from GenBank were aligned using MUSCLE (Edgar 2004) and concatenated together. We used PartitionFinder 3.8.31 (Lanfear et al. 2017) to select the most appropriate partition sets for this data set. We performed Bayesian inferences as above.
To extract single-copy orthologs from the whole-genome data, we used the assemblies from MEGAHIT as the input file. The SCOs of Glires provided by OrthoDB (Kriventseva et al. 2019) were used as a reference database. We aligned the protein sequence from each of the reference species to that from each newly assembled species by TBlastN of the BLAST (Altschul et al. 1990), and all coding domains of assemblies were predicted by Augustus (Stanke and Waack 2003). The DNA sequences of single-copy orthologs were used for phylogenomic reconstruction. These sequences were aligned in MUSCLE (Edgar 2004). We used Gblocks 0.91 b (Talavera and Castresana 2007) to remove the highly variable regions of the alignment of each ortholog. The minimum length of the conserved region was set to 10 (-b4 = 10) with all gaps were removed in these analyses.
We used two methods to reconstruct the phylogeny of Niviventer basing on SCOs. In the first method, we concatenated all SCOs together, and extracted SNP sites using SNP-sites (PaGe et al. 2016). Bayesian Markov chain Monte Carlo (MCMC) inferences using these SNP sites was conducted in MrBayes 3.2.2. Trees were visualized in FigTree 1.40 (Rambaut 2010). Secondly, we inferred species tree using the gene trees of 4,964 SCOs (at least presented in four species) in RaxML 8.2.12 (Stamatakis 2014) with 100 bootstraps and a GTRGAMMA model for each gene. The best tree for each gene was used to summarize species tree in ASTRAL.5.7.3 (Zhang et al. 2018). This is one of the leading methods for inferring species trees from gene trees while accounting for gene tree discordance, which can be caused by incomplete lineage sorting, gene-flow between species etc.
Testing Phylogenetic Networks and Hybridization among Species
To reconstruct the phylogenetic network among Niviventer, we used the following four methods: 1) Autumn algorithm (Huson and Linz 2018) implemented in Dendroscope 3.7.2 (Huson and Scornavacca 2012), which computing minimum hybridization networks for a given pair of “realistic” rooted phylogenetic trees on overlapping taxa sets. Gene trees resulted from the SCOs were used in this analysis. 2 and 3) We inferred phylonetworks using maximum pseudolikelihood and Bayesian inference in Phylonet (Yu and Nakhleh 2015; Wen et al. 2016). 4) We reconstructed phylonetwork among species using Phylonetworks (Solís-Lemus et al. 2017, 2018). Gene trees of SCOs were used in these three methods.
Inferring Divergence Time and Geographical Evolutionary History
We established two data sets to inferring the divergence time of Niviventer. The first data set including SNP extracted the concatenated data of all SCOs using SNP-sites. Then we used the MTG data set, which included two more species Niviventer (N. cremoriventer and N. rapit) than the single-copy ortholog data set, to infer the divergence time and geographical evolutionary history. Molecular dating was conducted in BEAST 1.8.4 (Drummond and Rambaut 2007). The divergence time of Murinae (16 Ma), and the age of Rattini (11.2 Ma) were used as calibration points in the present analyses (Aghová et al. 2018). The stability of the results was tested in Tracer (Rambaut and Drummond 2007). The phylogeny reconstructed in the above analyses was used for geographical evolutionary history inference in RASP 4 (Yu et al. 2020). We inferred the elevations evolution of Niviventer using the average values of their current distribution based on available collection records. All outgroup taxa were excluded from these analyses to avoid bias due to the distribution of outgroups.
Reconstructing Demographic History
We used two data sets to analyze the demographic history of different species within Niviventer. The first data set included CYTB sequences from 17 species, and the second data set included 15 assembled contig files for each species.
For the CYTB data, we used DnaSP v5 (Librado and Rozas 2009) to quantify the number of haplotypes in each species. We ran tests for Tajima’s D (Tajima 1989), Fu and Li’s D (Fu 1997), Fu and Li’s F (Fu 1997), and Fu’ F (Fu 1997) to assess whether the evolution of different species fit a neutral equilibrium. Significant and large negative values of Tajima’s D and F values are indicative of population expansion, whereas positive values for these tests indicate a decrease in population size. Second, we tested the pairwise mismatch distribution for the signatures of the demographic expansion. A unimodal mismatch distribution is apparent when the population experiences a sudden expansion. In contrast, multimodal and ragged mismatch distributions are indicative of a stable or contracting population. Third, we reconstructed the demographic history of these species by using the CYTB sequences of each species to construct extended Bayesian skyline plots (EBSPs) in BEAST (Bouckaert et al. 2014). A strict molecular-clock model was used with substitution models and clock models unlinked among partitions in all the analyses. A range of 0.02–0.06 nucleotide changes per site per million years was used as the lower and upper values for the clock rate, as this range is commonly used for the mtDNA of small mammals (Martin and Palumbi 1993; Suzuki et al. 2015). We used 0.5 as a scaling factor in the population model because only the female mtDNA contributes to the effective population size. Divergence times inferred in the above analyses were used as the ranges of divergence times for each lineage. For all lineages, analyses were run for 80 million generations, sampling every 1,000 steps and discarding the first 25% of generations as burn-in. We performed each analysis twice to test the convergence of the results. For all analyses, the effective sample size (ESS) of all parameters exceeded 200.
Moreover, we used the pairwise sequential Markovian coalescent (PSMC) model (Li and Durbin 2011) to test demographic history based on individual contig files of the genomic data for each species. Since no reference genome for species of Niviventer were available in GenBank, we used the contig files that were obtained in the above assemblies from MEGAHIT to regenerate 20 pseudochromosomes for each species. In this step, the contig files of each species were merged randomly to regenerate 20 pseudochromosomes in the FASTA file by using Fatools in iTools (He et al. 2013). Then we mapped the clean reads back to the newly generated pseudochromosome data individually. Next, we used BWA (Li and Durbin 2009) and SAMtools (Li et al. 2009) (with the parameters samtools view -bS) to convert the aligned results to bam files. We sorted the bam files and built an index for the sorted file. We estimated genotype likelihoods with an adjusted mapping quality >50 (samtools mpileup -C50). We used BCFtools to identify the single-nucleotide polymorphisms (SNPs) (bcftools view -c). We used the file generated to conduct PSMC analysis (Li and Durbin 2011). We used “vcfutils.pl” to obtain a consensus genome sequence (vcfutils.pl vcf2fq -d 3 -D 100), in which -d is a command to exclude sites with a root-mean-square mapping quality <5, and mapping depths >100 or <3. We converted the format of consensus sequences by using fq2psmcfa (fq2psmcfa -q20). After the transformation, the population histories of each species were inferred by PSMC analysis (psmc -N25 -t15 -r5 -p ″4 + 25 × 2 + 4 + 6). Since Niviventer is closely related to Rattus, we followed the studies of Rattus to use 0.5 year as the generation time, and 2.5 × 10⁻⁸ as the mean mutation rate for nuclear protein-coding genes according to previous studies (Teng et al. 2017; Zeng et al. 2018).
Identifying Genes under Positive Selection
DNA sequence files of each species annotated by Augustus in the above analyses were concatenated into one FASTA file for each species. We used TransDecoder v 5.5.0 (http://transdecoder.github.io) to identify Coding domain (CDs). We used PosiGene (Sahm et al. 2017) to scan positively selected genes (PSG) in each species. In the first running, R. norvegicus were used as anchor species and reference species. About 60,084 cds sequences of R. norvegicus were used as baits to assign homologous sequence of these genes in newly sequenced species into respective folders. In the formal analyses, the most closely related species of the target species was used as an anchor species. Rattus norvegicus and M. musculus was used as outgroup taxa. CD data sets for both species were downloaded from GenBank. There were three major steps during this analysis: 1) building the ortholog catalog based on CD sequences of R. norvegicus by using a best bidirectional BLAST hit criterion; 2) aligning these orthologs separately using PRANK (Loytynoja and Goldman 2005), removing highly divergent sequences, and producing a guide tree for the third step; and 3) identifying genes under positive selection using CODEML in PAML (Yang 2007). A multiple comparisons test was performed. Genes with adjusted P value <0.05 was used in the following analyses.
Adjusted P < 0.05 resulted in above analyses may induced from poor quality or misalignment of sequences. We realign each gene of all available species individually that was selected by PosiGene using MUSCLE, and manually check them by eye to make sure poorly sequenced data were excluded in the final analyses, and the remaining sequences correctly aligned to the known sequence of R. norvegicus or M. musculus, and then can be translate into protein sequences correctly. Stop codons at the end of cds were excluded. We used CODEML in PAML to test the significance of positive selection on these genes individually. Branch-site mode in CODEML was used to test the significance of positive selection. MA model (model = 2, NSsite = 2, fix omega = 0) and MA null model (model = 2, NSsite = 2, fix omega = 1) were run on each alignment of selected genes from the above analyses to produce likelihood ratio test (LRT) scores, and then to determine P values using χ2 tests.
Genes were considered PSGs if the tests resulted in a false discovery rate (FDR) of <0.05 with an adjusted P value of <0.05. False discovery rate (FDR) correction was conducted in the R using the Benjaminiand Hochberg method. Moreover, we evaluated the correctness of sequences generated by Illumina using Sanger sequencing. Partial sequences of SETD2 and CYP8B1 were amplified and sequenced using primers listed in supplementary table 8, Supplementary Material online. MrBayes inferences of each gene that presented in more than five species were conducted to build tree for these positively selected genes.
GO Enrichment Analyses and Detection of Functional Interactions among Proteins
We performed Gene Ontology (GO) enrichment analysis by using the positively selected genes detected as described above, with ortholog catalog of Rat (R. norvegicus) as the background species. The analyses were performed with the online server ShinyGo v0.61 (Ge, Jung, et al. 2020). FDR correction was performed in the GO enrichment analysis. Shiny GO is an online tool for the discovery and visualization of enriched GO terms in user-provided gene lists.
Testing for Ecological Differentiation
To examine the effects of climate change on species range and speciation processes, we first built past (Last Interglacial, LIG, and Last Glacial Maximum, LGM), present, and future (2050, RCP8.5 scenario) ecological niche models (ENMs) using the MaxEnt 3.4.1 algorithm implemented in the ENMeval R package (Muscarella et al. 2014). We used 19 temperature- and precipitation-related variables downloaded from the worldclim database at a 2.5-min resolution for all periods. Because the correlations between climatic parameters in past, present, and future scenarios varied, we kept all 19 variables to ensure that our models were comparable. Nevertheless, MaxEnt is robust to predict collinearity, and therefore, such collinearity should not affect our results (Feng et al. 2019). Species occurrence was confined to confirmed museum specimens or genetically sampled individuals. For N. rapit and N. tenaster, we complemented our data set with museum records available through the Global Biodiversity Information Facility (GBIF) database (https://www.gbif.org/). After excluding duplicated localities, the available sample sizes for the species were N. andersoni (n = 35), N. bukit (n = 7), N. confucianus (n = 65), N. cremoriventer (n = 20), N. eha (n = 28), N. excelsior (n = 12), N. fulvescens (n = 15), N. huang (n = 26), N. lotipes (n = 29), N. mekongis (n = 15), N. niviventer (n = 15), N. pianmaensis (n = 7), N. rapit (n = 17), and N. tenaster (n = 6) (supplementary fig. 1, Supplementary Material online). We did not include N. coninga, N. culturatus, N. fengi, N. gladiusmaculus, and N. brahma in the climatic niche analyses because of their limited distribution records.
To test the performance of our models, we partitioned the localities into testing and training bins using the “checkerboard2” method for species with sample sizes >25 and the “jackknife” method for species with smaller sample sizes (Muscarella et al. 2014). About 10,000 background points were randomly selected for model training from a defined buffer area (Lat: −10S, 60 N; Long: 65 N, 140 N) that includes the entire distribution of the genus. For each species, we compared models with distinct complexities using regularization multipliers ranging from 0 to 5 with five combinations of feature classes (L, LQ, LQP, H, and LGH; where L = linear, Q = quadratic, H = hinge, and P = product), and ranked them via the second order corrected Akaike information criterion (AIC). The performance of the best model (smallest AIC) was evaluated using the area under the curve (AUC) (Mason and Graham 2002). All models showed AUC values closer to one (ranging from 0.8351 to 0.9877) (supplementary table 9, Supplementary Material online), indicating higher performance in discriminating species occurrence data from random background points (Phillips et al. 2004).
To compare past, current, and future niche models, we first converted the raw MaxEnt output into a logistic output, which resulted in a probability of presence varying from 0 to 1. This approach allows a direct comparison across distinct models (Phillips et al. 2006). Comparisons between past, present, and future modeled species range were based on binary maps defined by the 10th percentile training presence Cloglog threshold; grid cells with a logistic probability of presence value higher than this threshold were reclassified as “1,” indicating presence and those with a probability below the threshold were reclassified as “0” indicating absence.
To assess species range shifts over time we calculated the suitable area (in km2) and assessed the direction of shifts for each modeled scenario based on the threshold maps. To evaluate the effect of climate on speciation, we combined our modeled species distribution ranges obtained using the Cloglog threshold presence maps with the genomic tree. We assessed the evolution of climatic tolerances in Niviventer by using the phyloclim R package (Heibl 2009) and investigated the relationship between time since divergence and species range overlap via age-range correlation (ARC) analysis using the ENMTools R package (Warren et al. 2010). ARC analysis sheds light on the role of allopatric or sympatric speciation on shaping genus current diversity (Fitzpatrick and Turelli 2006).
Acknowledgments
We appreciate valuable suggestions from Drs Arne Sahm, Shixia Xu, Fangluan Gao, Qiang Gao, Hua Chen, Chaochao Yan, Yu Wang, Yalin Cheng, and Chengmin Shi for data analyses. We also appreciate great help from anonymous reviewers and the editorial team. This work was sponsored by the Second Tibetan Plateau Scientific Expedition and Research Program (Nos. 2019QZKK0402, 2019QZKK0501) and the National Nature Science Fund of China (31872958). D.Y.G. and A.P.V. was supported by the Newton Advanced Fellowship of the Royal Society, United Kingdom (NA150142). A.V.A. is sponsored by the International Fellowship for Distinguished Scientists, Chinese Academy of Sciences (Ref. 2017VBA0027) and in part by grants-in-aid from the Ministry of Science and Higher Education of Russian (project AAAA-A19-119082990107-3). A.F. is financially supported by the Chinese Academy of Sciences President’s International Fellowship Initiative (2018PB0040/2021PB0021).
Author Contributions
D.Y.G., Q.S.Y., and A.P.V. designed research. D.Y.G., A.F., S.C.Y., S.K.P., and A.V.A. performed research and data analyses. D.Y.G., Z.X.W., L.L., A.V.A., J.L.C., L.X., X.L.J., and Q.S.Y. participated in sample collection. D.Y.G., A.F., A.V.A., L.L., A.P.V., and Q.S.Y. wrote the article.
Data Availability
Assembled sequences newly generated in the present study are available in GenBank (accession number MW191601–MW191697, MW193727–MW193744). Original sequence reads of genome data are available at the China National GeneBank (accession number CNP0001167).

| Target Species | Genes | Homologous Transcript in Rattus norvegicus | Number of Species Selected by PosiGene | P Value Raw | Adjusted P Value Resulted in PosiGene | Number of Species Included in Final Evaluation in PAML | P Value Resulted in CODEML in PAML | FDR |
|---|---|---|---|---|---|---|---|---|
| Niviventer brahma | HOXC8 | NM001177326 | 4 | <0.0001 | <0.0001 | 16 | 0.0001 | 0.0001 |
| Niviventer eha | OLR141 | NM001001274 | 3 | <0.0001 | <0.0001 | 6 | <0.0001 | 0.0006 |
| Niviventer eha | OLR1658 | NM001000105 | 4 | 0.0048 | 0.0048 | 11 | <0.0001 | 0.0006 |
| Niviventer eha | PTPDC1 | XM006253700 | 3 | <0.0001 | <0.0001 | 13 | <0.0001 | 0.0006 |
| Niviventer eha | KIF20A | NM001108426 | 3 | 0.0001 | 0.0001 | 18 | 0.0002 | 0.0009 |
| Niviventer eha | CCDC73 | XM006224541 | 6 | <0.0001 | <0.0001 | 14 | 0.0012 | 0.0041 |
| Niviventer eha | HSF1 | NM024393 | 4 | 0.0014 | 0.0014 | 17 | 0.0035 | 0.0097 |
| Niviventer eha | OLR224 | NM001000553 | 5 | 0.0077 | 0.0077 | 20 | 0.004 | 0.0097 |
| Niviventer eha | TAS2R118 | NM023994 | 5 | 0.0001 | 0.0001 | 19 | 0.0054 | 0.0115 |
| Niviventer eha | SETD2 | XM008766632 | 3 | 0.0036 | 0.0036 | 15 | 0.0149 | 0.0269 |
| Niviventer eha | OLR590 | NM001000658 | 6 | 0.0175 | 0.0175 | 16 | 0.0158 | 0.0268 |
| Niviventer eha | GPER1 | NM133573 | 3 | 0.0135 | 0.0135 | 19 | 0.0179 | 0.0277 |
| Niviventer eha | DRD5 | NM012768 | 5 | 0.0036 | 0.0036 | 19 | 0.021 | 0.0298 |
| Niviventer eha | LATS2 | XM008770748 | 3 | 0.0143 | 0.0143 | 14 | 0.028 | 0.0338 |
| Niviventer eha | PCDHB2 | NM001109123 | 3 | 0.0077 | 0.0077 | 8 | 0.0291 | 0.0338 |
| Niviventer eha | TAS2R114 | NM023996 | 3 | 0.008 | 0.008 | 3 | 0.0298 | 0.0338 |
| Niviventer eha | CYP8B1 | NM031241 | 3 | 0.0045 | 0.0045 | 19 | 0.0358 | 0.038 |
| Niviventer eha | FGF22 | NM130751 | 5 | 0.0463 | 0.0463 | 20 | 0.0423 | 0.0423 |
| Niviventer fengi | KLK9 | NM001106253 | 4 | <0.0001 | <0.0001 | 12 | <0.0001 | 0.006 |
| Niviventer fengi | FOXD2 | XM0233422 | 3 | 0.0004 | 0.00035 | 19 | 0.0011 | 0.033 |
| Niviventer fengi | CYP27B1 | XM008765374 | 4 | <0.0001 | <0.0001 | 14 | 0.0393 | 0.0428 |
| Niviventer fengi | TAF7L | NM001135877 | 4 | 0.0356 | 0.0356 | 9 | 0.0415 | 0.0428 |
| Niviventer fengi | ERCC6L | NM001098674 | 4 | 0.0114 | 0.0114 | 12 | 0.0428 | 0.0428 |
Note.—The full list of PGS selected by PosiGene is given in supplementary table 6, Supplementary Material online.