 Origin of a Giant Sex Chromosome
Molecular Biology and Evolution


- Altmetric
Chromosome size and morphology vary within and among species, but little is known about the proximate or ultimate causes of these differences. Cichlid fish species in the tribe Oreochromini share an unusual giant chromosome that is ∼3 times longer than the other chromosomes. This giant chromosome functions as a sex chromosome in some of these species. We test two hypotheses of how this giant sex chromosome may have evolved. The first hypothesis proposes that it evolved by accumulating repetitive elements as recombination was reduced around a dominant sex determination locus, as suggested by canonical models of sex chromosome evolution. An alternative hypothesis is that the giant sex chromosome originated via the fusion of an autosome with a highly repetitive B chromosome, one of which carried a sex determination locus. We test these hypotheses using comparative analysis of chromosome-scale cichlid and teleost genomes. We find that the giant sex chromosome consists of three distinct regions based on patterns of recombination, gene and transposable element content, and synteny to the ancestral autosome. The WZ sex determination locus encompasses the last ∼105 Mb of the 134-Mb giant chromosome. The last 47 Mb of the giant chromosome shares no obvious homology to any ancestral chromosome. Comparisons across 69 teleost genomes reveal that the giant sex chromosome contains unparalleled amounts of endogenous retroviral elements, immunoglobulin genes, and long noncoding RNAs. The results favor the B chromosome fusion hypothesis for the origin of the giant chromosome.
Introduction
Almost two centuries of cytogenetic studies have revealed the great diversity of animal karyotypes. Chromosome numbers range from a single chromosome pair in the jack jumper ant (Crosland and Crozier 1986) to ∼225 chromosome pairs in the Atlas blue butterfly (Lukhtanov 2015). Chromosome numbers can differ dramatically among closely related species even without changes in ploidy (Yang et al. 1997). Although the total length of the chromosomes is directly related to genome size, and thus to factors such as population size (Lynch and Conery 2003), there is little theory to explain why chromosome numbers should vary so dramatically.
There are also dramatic differences among species in the shapes of chromosomes. Some lineages contain mostly acrocentric chromosomes, whereas others segregate mostly metacentric chromosomes. Differences among species have been attributed to supposedly random processes of chromosome fusion and fission. In some cases, fusion events have left behind a trace of interstitial telomere sequences (ITSs), such as human chromosome 2 (Ijdo et al. 1991). Recent data suggest that these differences in fusions and fission events may arise from changing biases in centromeric drive during female meiosis (Molina et al. 2014; Blackmon et al. 2019), but the molecular basis for these shifts remain obscure (Kursel and Malik 2018). Additional forces such as mutation rates, population structure, drift, recombination, and gene expression may also contribute to these differences (Qumsiyeh 1994; Dobigny et al. 2017). We suspect there might be some common mechanisms and rules governing the variety of sizes and shapes of chromosomes in a particular lineage. However, at present, we are unable to predict the structure of karyotypes—meaning the number and shape (acrocentric vs. metacentric) of chromosomes—in particular lineages.
The genome is a battleground on which genetic conflicts are fought on many levels. Selfish genetic elements such as transposons tend to proliferate, increasing the size of genomes (Canapa et al. 2015; Kapusta et al. 2017). Centromeres compete for transmission through meiosis (Malik 2009). Many of these conflicts involve selfish elements that drive (i.e., are transmitted at greater than 50%), particularly via female meiosis (Burt and Trivers 2006). Such selfish genetic elements often impose a cost on fitness, including transposon insertions that render genes nonfunctional (Werren 2011), and deleterious alleles that have hitchhiked to high frequency via linkage with a driving centromere (Fishman and Kelly 2015). These genomic conflicts also contribute to variation in the number, size, and shape of chromosomes in the karyotype (De Villena and Sapienza 2001; Chmátal et al. 2014).
Supernumerary “B” chromosomes, first described a century ago (Wilson 1907), offer a unique system for studying genomic conflicts. B chromosomes are selfish genetic elements that exist alongside the canonical karyotype (or “A” chromosomes) in some individuals of a population. They can vary in number and ploidy and are estimated to occur in at least 15% of eukaryotic species (Burt and Trivers 2006). These selfish chromosomes develop mechanisms to favor their transmission, despite a potential negative impact on organismal fitness (Meiklejohn and Tao 2010). B chromosomes are highly repetitive, largely heterochromatic, contain many transposable elements, pseudogenes, and noncoding RNAs. Recent work has shown that B chromosomes also often contain many functional genes that are transcribed which can affect transcriptome regulation in various tissues and ultimately may change observable phenotypes (Makunin et al. 2014; Banaei-Moghaddam et al. 2015; Ahmad and Martins 2019).
Sex chromosomes are another focal point for genetic conflicts. Sexually antagonistic selection favors a reduction in recombination on sex chromosomes to increase the association of sexually antagonistic alleles with the sex-determining locus (Charlesworth 1991; Charlesworth et al. 2005; Bergero and Charlesworth 2009). Successive events reducing recombination (e.g., inversions) can lead to evolutionary strata with different degrees of differentiation between the sex chromosomes (Bergero and Charlesworth 2009; Zhou et al. 2014). Alternative explanations for the restriction of recombination on sex chromosomes include meiotic drive, heterozygote advantage, and genetic drift (Ponnikas et al. 2018).
Sexual conflicts are common and often drive the evolution and turnover of sex chromosomes (Parker 1979; Chapman et al. 2003; Burt and Trivers 2006; Van Doorn and Kirkpatrick 2007; Bachtrog et al. 2014). It has been proposed that female meiotic drive contributes to the evolution of new sex chromosomes via fusions with autosomes, and that karyotype shape affects the types of fusions that occur (Yoshida and Kitano 2012). In fishes and reptiles, sex chromosome–autosome fusions more often involve Y chromosomes than X, W, or Z chromosomes, which is consistent with these Y-fusion events being slightly deleterious and fixed by genetic drift (Pennell et al. 2015; Kirkpatrick 2017).
It has been suggested that some sex chromosomes originated from B chromosomes, or vice versa, based on similarities in their repetitive DNA and transposons, lack of recombination, patterns of heterochromatic gene silencing, and dearth of functional genes (Hackstein et al. 1996; Camacho et al. 2000; Carvalho 2002; Nokkala et al. 2003). However, evidence to support these hypotheses is limited (Charlesworth et al. 2005; Bachtrog 2013; Fraïsse et al. 2017). Definitive tests of these hypotheses will require data from closely related species, as both B chromosomes and young sex chromosomes evolve quite rapidly.
Cichlid fishes have undergone an extraordinary radiation in East Africa, diversifying into more than 1,500 species over the last 25 MY (Kocher 2004). Cichlid karyotypes vary and B chromosomes have now been discovered in numerous cichlid species (Poletto, Ferreira, and Martins 2010; Valente et al. 2014). Many Lake Malawi cichlid species harbor a B chromosome that is present as a single copy and only in females. This B chromosome carries an epistatically dominant female (W) sex-determiner, which likely evolved to promote the transmission of the B chromosome through female meiosis (Clark et al. 2017; Clark and Kocher 2019). In Lake Victoria cichlids, a different B chromosome persists in high frequency (85% of individuals in all species examined). The Lake Victoria B chromosome can be found in one to three copies in males or females, and typically shows no effect on the phenotype (Poletto, Ferreira, and Martins 2010; Valente et al. 2014). However, in one species of Lake Victoria cichlids, B chromosomes were shown to have an effect on sex determination (Yoshida et al. 2011). Both the Victoria and Malawi B chromosomes have been characterized cytogenetically (Poletto, Ferreira, and Martins 2010; Fantinatti et al. 2011) and at the sequence level (Clark et al. 2018; Coan and Martins 2018). Similar to other well-studied B chromosomes, these cichlid B chromosomes are highly repetitive (Valente et al. 2017). Some autosomally derived sequence blocks of up to ∼500 kb have become amplified to produce many copies on these B chromosomes. Many of these blocks contain transcribed genes involved in processes related to meiosis and mitosis, suggesting that genes on these B chromosomes may be involved in ongoing conflicts to maintain the B chromosomes in the population (Valente et al. 2014; Clark et al. 2018).
Studies of African cichlids also have revealed an extraordinary diversity of sex chromosomes, and the highest rate of sex chromosome turnover among vertebrates (Gammerdinger and Kocher 2018; Vicoso 2019). Genetic conflicts have contributed to at least some of this diversity. For example, sexual conflict involving color polymorphisms led to the evolution of a novel W sex chromosome (Roberts et al. 2009). Most cichlid sex chromosomes are homomorphic and were therefore identified using sequence markers (Lee et al. 2003, 2011; Ezaz et al. 2004; Ser et al. 2010; Sun et al. 2014). Whole-genome sequencing techniques are allowing for the rapid discovery of additional cichlid sex chromosomes (Gammerdinger et al. 2016, 2019).
Several of these novel sex chromosomes involve chromosome fusions (Gammerdinger et al. 2018). The most common teleost karyotype consists of 24 chromosome pairs (2N = 48) and is relatively stable within and among lineages (Amores et al. 2014). Previous cytogenetic analyses revealed relative karyotype stability in both Old World cichlids (2N = 48) and New World cichlids (2N = 44) but identified examples of species-specific fusion and fission events across the family Cichlidae (Poletto, Ferreira, and Martins 2010). Additional work revealed that African cichlids have experienced two relatively recent chromosome fusions of ancient vertebrate chromosomes (Liu et al. 2013) to create LG7 and LG23 (Conte et al. 2019). In Astatotilapia burtoni, a sex chromosome is found on LG5-14, a chromosome fusion that is not found in other cichlid species (Roberts et al. 2016). The A. burtoni genome also experienced another fusion (LG8-24 fused with LG16-21) that has not been associated with sex determination (Ser et al. 2010; Li et al. 2015; Roberts et al. 2016).
The cichlid tribe Oreochromini, comprising ∼80–100 species (including the commercially important Nile tilapia, Oreochromis niloticus), are unique in having a very large and highly repetitive giant chromosome not present in most other cichlids. This giant chromosome, referred to here as linkage group 3 (LG3), comprises at least 13.4% of the entire oreochromine genome, and is two to three times larger than any other chromosome in the karyotype (Majumdar and McAndrew 1986; Oliveira and Wright 1998; Ferreira and Martins 2008). In O. niloticus, a large portion of the LG3 giant chromosome does not pair during the early pachytene stage of meiosis (Foresti et al. 1993; Ocalewicz et al. 2009). LG3 carries a WZ sex determination locus in several species including the blue tilapia, O. aureus (Campos-Ramos et al. 2001; Lee et al. 2004; Conte et al. 2017). The LG3 giant chromosome is retained in oreochromines, even when sex determination is controlled by loci on other chromosomes, such as LG1 and LG23 (Eshel et al. 2012; Gammerdinger et al. 2014; Li et al. 2015). A LG3 giant sex chromosome has also been observed in several closely related cichlid lineages including Pelmatolapia (Tilapia) mariae (Gammerdinger et al. 2019). Figure 1 provides an overview of karyotype evolution in cichlids, as well as the distribution of fusion events, the LG3 giant sex chromosome, and B chromosomes in species from Lake Malawi and Lake Victoria.

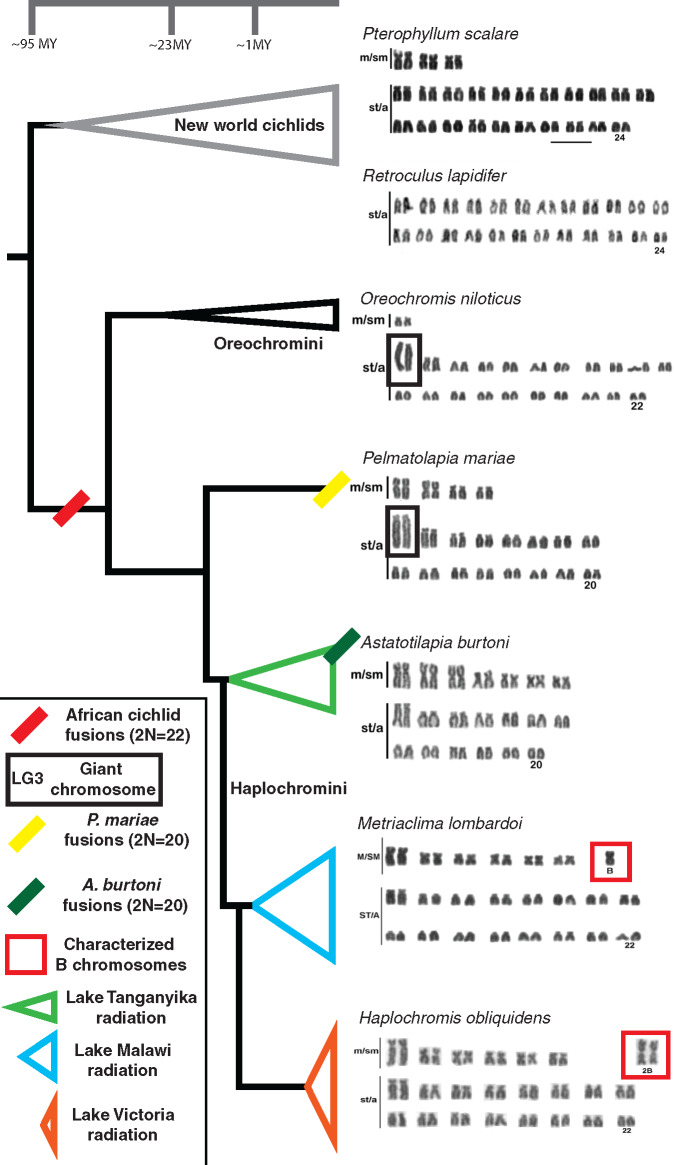
Summary of major karyotype evolution across the phylogeny of cichlids. The Oreochromini and several additional lineages harbor the LG3 giant chromosome. The LG3 giant chromosome acts as a WZ sex chromosome in at least three different species of Oreochromis as well as additional lineages such as Pelmatolapia mariae. Karyotypes are adapted with permission (Poletto, Ferreira, Cabral-de-Mello, et al. 2010; Clark et al. 2017). Metacentric and submetacentric chromosomes are labeled “m/sm” and subtelo/acrocentric chromosomes are labeled “st/a.”
We considered two hypotheses for the origin of the LG3 giant sex chromosome. The first model is that an ancestral autosome acquired a sex-determining allele. Following the canonical model of sex chromosome evolution, selection would favor a reduction in recombination (e.g., inversions) that maintains an association between the sex determination locus and nearby sexually antagonistic variation (Van Doorn and Kirkpatrick 2007). This reduction in recombination would allow an accumulation of deleterious alleles and repetitive elements (Charlesworth et al. 2005; Bachtrog et al. 2014; Vicoso 2019). Under this model, the giant sex chromosome should show conserved synteny with the ancestral autosome, except where gene order has been altered by inversions.
The second model proposed here is that the LG3 giant sex chromosome arose by fusion of a highly repetitive B chromosome with another chromosome. Either chromosome could have been carrying a sex determination locus prior to fusion. The B chromosome may have carried a sex determination locus to favor its transmission through meiotic drive. This has been shown in Lake Malawi cichlid species where a W sex determination locus likely evolved to enhance the meiotic drive of the B chromosome that carries it since this W is dominant to a separate XY locus (Clark and Kocher 2019). Such a fusion might be favored if it associated sexually antagonistic variation with the sex determiner, or if it contributed to the drive of the B chromosome. Alternatively, the other chromosome may have carried a sex determination locus and fusion was favored because of a sexually antagonistic locus on the B chromosome. In either case, major portions of the giant sex chromosome would show no significant synteny with the ancestral autosome due to the fusion with a B chromosome.
Here, we test these hypotheses through a comparative genomic analysis of many cichlid and teleost fish genomes. We present results characterizing the giant sex chromosome in the Oreochromini by analyzing synteny, recombination, repeat content, and gene ampliconic arrays. The giant sex chromosome we describe here provides one study system to better to understand alternative trajectories in sex chromosome evolution.
Results
WZ Sex Determination Locus on LG3
Our analysis utilizes two Oreochromis genome assemblies—the chromosome-scale assembly of a LG1XX female O. niloticus (Conte et al. 2019) and a new chromosome-scale assembly of a LG3ZZ male O. aureus (Tao et al. 2020). In the O. niloticus assembly, 87.6 Mb of LG3 was assembled and anchored. In the O. aureus assembly, the size of the LG3 anchored assembly was 134.4 Mb. Much of the sequence that was unanchored in the O. niloticus assembly has now been anchored to LG3 in the O. aureus assembly (supplementary file 1, Supplementary Material online). These two new genome assemblies represent large advances in tilapia genomics, but they have not yet been used to study the origin of the giant sex chromosome.
The O. niloticus assembly was previously used to characterize several LG3WZ sex chromosomes. Using the new O. aureus assembly as the reference, we now recharacterize the sex determination region on LG3 in Pelmatolapia mariae (Gammerdinger et al. 2019) and O. aureus (Conte et al. 2017). FST analysis was used to characterize the genome-wide pattern of divergence between males and females of P. mariae and O. aureus which both show a large region of elevated divergence on LG3 (supplementary file 2, Supplementary Material online). The fine-scale boundaries of the sex-determining region for each species were determined by examining the number of WZ patterned SNPs in a 10-kb sliding window. The P. mariae WZ sex determination locus on LG3 starts at ∼25 Mb and extends to 134.4 Mb. The O. aureus LG3WZ sex determination locus starts at ∼30 Mb and extends to 134.4 Mb (supplementary file 3, Supplementary Material online). This recharacterization of the sex-determining region in these species using the new O. aureus ZZ reference has revealed many additional regions of the LG3 giant sex chromosome that were either unassembled and/or unanchored in the previous genome assemblies.
Conservation of Synteny
The Japanese medaka (Oryzias latipes) provides the most suitable outgroup for studying synteny of LG3 in the Oreochromini since medaka has a typical teleost karyotype of 24 chromosome pairs and is the most closely related species with high-quality chromosome-scale assemblies (Ichikawa et al. 2017). Due to the fact that the LG3 giant sex chromosome is highly repetitive and contains many gene duplications (Ferreira et al. 2010; Conte et al. 2017), comparison of one-to-one orthologs of five species was necessary to remove alignment artifacts (see Materials and Methods). Figure 2 provides a comparison of these five-way one-to-one orthologs of O. aureus LG3 to the corresponding medaka chromosome 18. LG3 is divided into three parts (LG3a, LG3a’, and LG3b) based on these patterns of synteny. LG3a consists of the region with conserved synteny comprising the first ∼42 Mb of O. aureus (99 one-to-one orthologs). LG3a’ consists of the middle ∼45 Mb (from ∼42 to ∼87 Mb) and contains only 12 one-to-one orthologs. LG3b consists of the last 47 Mb of O. aureus (from 87 to 134 Mb) and contains zero one-to-one orthologs to medaka. LG3b comprises 35% of the anchored LG3 giant sex chromosome and represents the region potentially originating from a B chromosome fusion. The one-to-one orthologs at the end of medaka chromosome 18 correspond to the final orthologs on LG3a’ in the middle of LG3. The assembly of O. niloticus LG3 (87 Mb) shows a similar pattern of synteny to medaka, although the boundary between LG3a’ and LG3b is not as well defined (supplementary file 4, Supplementary Material online). Several cichlid species outside of the tribe Oreochromini that do not have the LG3 giant chromosome show conserved synteny to medaka across this entire chromosome (supplementary files 5–7, Supplementary Material online). Additionally, it does not appear that LG3a’ and LG3b arose from a different autosome as they do not show detectable synteny with any other chromosomes.
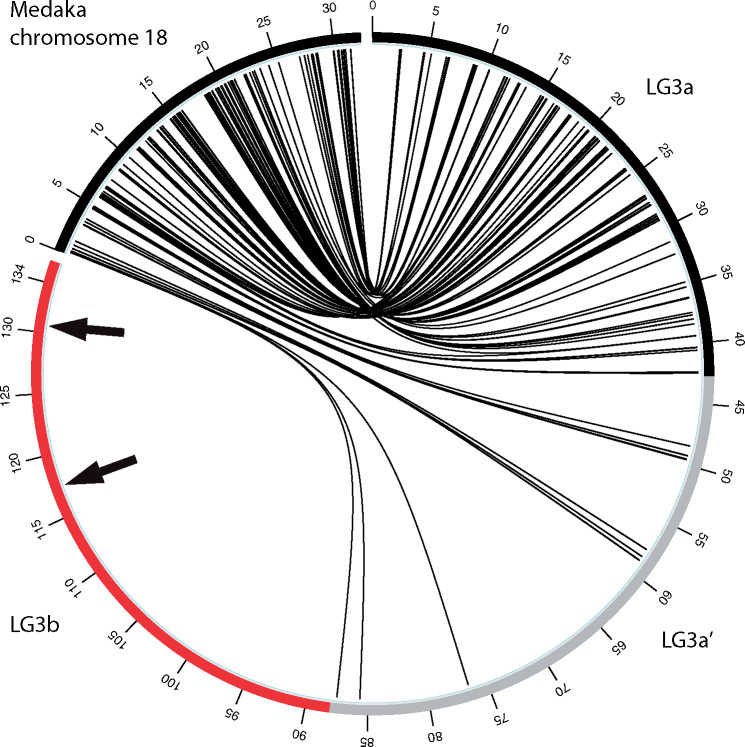
Five-way, one-to-one ortholog alignments of Oreochromis aureus LG3 to medaka chromosome 18. Interstitial telomeric sequences (ITS) are labeled with black arrows.
Several previous cytogenetic studies have shown that O. niloticus LG3 contains two separate interstitial telomere repeat sequences (ITSs) (Chew et al. 2002; Martins et al. 2004). These ITSs may be indicative of chromosome fusion events (Azzalin et al. 2001; Bolzán 2017). Consistent with the cytogenetic studies, the O. aureus assembly also contains two interstitial telomere repeats arrays (TTAGGG)n that are present on LG3 at 116.9 Mb, 130.6 Mb. An additional telomere repeat array is located at the presumed actual telomeric end at 134 Mb (genome-wide list in supplementary file 8, Supplementary Material online). The African cichlid-specific chromosome fusion events on LG7 and LG23, which occurred before the formation of the LG3 giant sex chromosome, have not left traces of ITSs detectable by either cytogenetic studies (Chew et al. 2002; Martins et al. 2004) or the genome assemblies of O. aureus and O. niloticus (supplementary file 8, Supplementary Material online).
Patterns of Recombination
The pattern of recombination in O. niloticus was previously characterized using a high-density map (Joshi et al. 2018; Conte et al. 2019). LG3a shows the typical sigmoidal pattern of recombination seen on other African cichlid chromosomes, in which recombination rate is low near the telomeres and high in the middle of the chromosome. LG3a’ has a lower level of recombination, and LG3b shows large regions of no recombination (fig. 3). These patterns of recombination also coincide with the patterns of synteny (fig. 2 and supplementary file 4, Supplementary Material online). LG3a shows a high density of syntenic markers both between Oreochromis species, and in comparisons to medaka. LG3a’ shows a lower density of markers and smaller blocks of uninterrupted synteny in both the O. niloticus to medaka and O. aureus to medaka comparisons. LG3b shows relatively few syntenic markers between oreochromines, and no one-to-one orthologs with medaka.
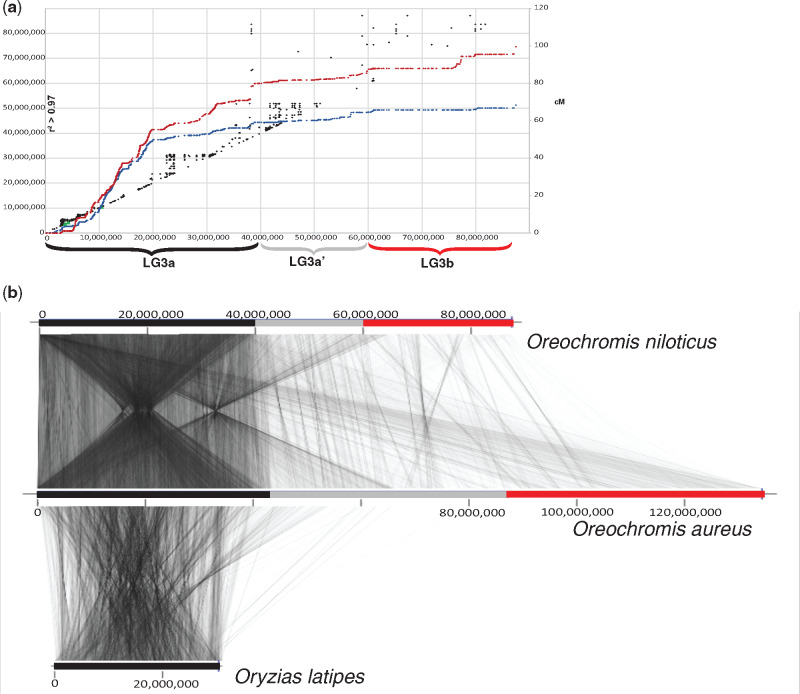
Patterns of recombination in Oreochromis niloticus correspond to the organization of synteny between O. niloticus and O. aureus LG3. (a) Recombination of female (red) and male (blue) O. niloticus LG3 shown in cM (right) and linkage disequilibrium (r2 > 0.97, left) in black. Adapted with permission from (Conte et al. 2019). (b) Synteny of the 87-Mb anchored assembly of LG3 in O. niloticus, compared with the 134-Mb anchored assembly of LG3 in O. aureus, compared with the ancestral chromosome 18 in Oryzias latipes.
Sequence Content of the Giant Chromosome
The sequence content of the oreochromine giant chromosome is unusual compared with 69 other teleost fish genome assemblies. Oreochromis niloticus has the highest number of immunoglobulin genes and more than double the number of immunoglobulin transcripts of any other teleost (supplementary file 9, Supplementary Material online). LG3a’ and LG3b account for 47.4% (100/211) of O. niloticus immunoglobulin genes (supplementary file 10, Supplementary Material online). Subtracting these, O. niloticus would have a slightly above average count (111 vs. the teleost average of 101). Overall, O. niloticus LG3 has a significantly higher number of immunoglobulin genes than expected genome wide (P = 8.22 × 10⁻¹⁸, Fisher’s exact test). The same is true for LG3a, LG3a’, and LG3b (P = 1.03 × 10⁻⁶, 2.36 × 10⁻⁹, and 0.0014, respectively, Fisher’s exact test). The Oreochromini also have the largest amount of total sequence of any teleost annotated as endogenous retrovirus (ERVs), of which LG3a’ and LG3b account for 13.8% (1.06 Mb of the total 7.67 Mb genome-wide). However, the Oreochromini do not have the highest number of ERV insertion events. This either suggests a fragmented and incomplete representation of these elements in teleost assemblies constructed from short-read sequence data (Conte and Kocher 2015) and/or that oreochromine ERVs are more recent and intact, resulting in fewer annotated ERV copies than more highly decayed ERVs in other species. The Oreochromini also have the highest number of annotated long noncoding RNAs (lncRNAs) among teleosts. LG3a’ and LG3b account for 13.1% of these lncRNAs. LG3b has a high density of zinc-finger proteins relative to the rest of the genome, although the overall number of these zinc-finger proteins is similar to that in other teleosts. Additionally, LG3 contains a higher amount of satellite repeats than expected compared with the rest of the genome (P = 2.81 × 10⁻¹², Fisher’s exact test and supplementary file 10, Supplementary Material online). Finally, a gene ontology (GO) enrichment analysis of LG3b identified several significantly enriched terms, all related to immune regulation and immune response (supplementary files 11 and 12, Supplementary Material online).
The giant sex chromosome contains several large, highly repetitive, ampliconic gene arrays which are commonly found on both sex chromosomes and B chromosomes of other species (Bellott et al. 2010). The extent of these ampliconic arrays can be seen on a chromosome scale by examining sequence similarity across LG3 (fig. 4 and supplementary file 13, Supplementary Material online). These ampliconic gene expansions are found most frequently in the nonrecombining regions of LG3b. However, some of these genes have also expanded throughout LG3 and are also seen in lower copy numbers in the freely recombining region on LG3a and lower recombining region of LG3a’. A table of genes that have undergone expansion on LG3 is provided in supplementary file 14, Supplementary Material online.
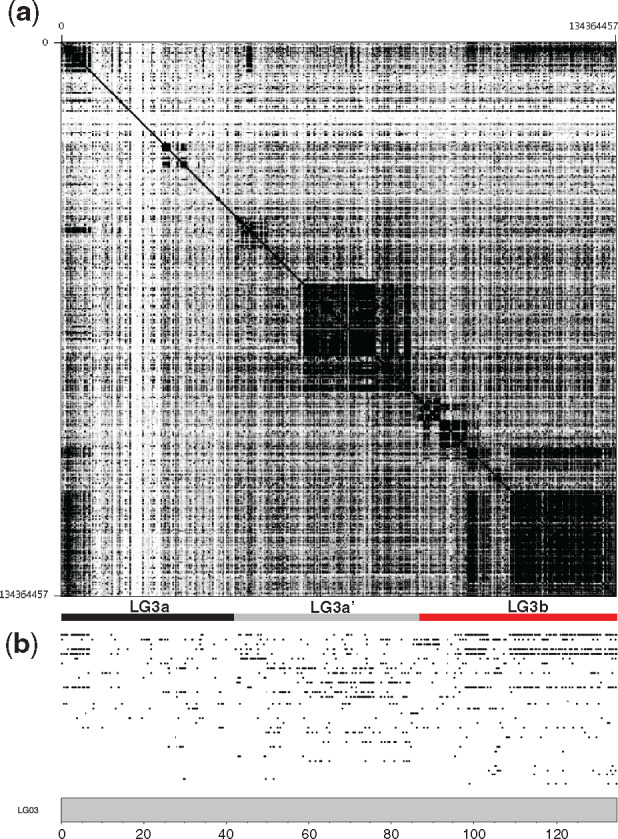
(a) Dotplot of the Oreochromis aureus LG3 giant sex chromosome. (b) Locations of the ampliconic gene expansions which are sorted from top to bottom by number of copies on LG3. Supplementary file 14, Supplementary Material online, provides details of each of these ampliconic genes.
Patterns of Transposable Elements on the Giant Chromosome
The LG3 giant chromosome has the highest density of repetitive elements across the genome (Ferreira et al. 2010; Conte et al. 2019), which may be a signature of a fusion with a B chromosome. B chromosomes in cichlids have been characterized as having a much higher content of specific TE families relative to the A genome (Coan and Martins 2018). One explanation for this might be that B chromosomes can act as a “safe-haven” for particular TEs (McAllister and Werren 1997; Camacho et al. 2000; Werren 2011). Therefore, B chromosomes may be more likely to contain TE insertions diverged from copies on the A chromosomes. In the most extreme case, one might also expect selfish B chromosomes to contain private TE families not found in the A chromosomes. Oreochromis aureus LG3 contains three different unknown TE families that were not found on any other chromosome and which are present in at least 100 copies (see Materials and Methods), defined here as “completely private TE families.” Additionally, O. aureus LG3 contains six additional TE families that were present in at least 100 copies and were almost exclusively found on LG3 only (>98% of copies), defined here as “predominately private TE families” (supplementary file 15, Supplementary Material online). One of these families was annotated as a DNA/Dada element, whereas the remainder were unknown elements. These private TE families on LG3 were mostly found on LG3a’ and LG3b, whereas very few copies of these TE families were found on LG3a. The rest of the O. aureus genome contains only two chromosomes (LG4 and LG13) with completely private TE families (one each) and no other chromosomes containing a predominantly private TE family. The private TE results are similar for O. niloticus LG3 compared with the rest of the genome (supplementary file 15, Supplementary Material online).
The age of these private TEs is an important factor to consider as well. For example, if the private TEs were all very recent in age, then perhaps they arrived well after the potential B chromosome fusion event. On the other hand, if the private TEs were older in age, then this may be evidence that they evolved on the original B chromosome prior to a potential fusion. The genome-wide O. aureus repeat landscape (supplementary file 16, Supplementary Material online) is similar to the O. niloticus repeat landscape (Conte et al. 2017, 2019). The completely private TE copies share a similar distribution of sequence divergence as the whole genome, with copies of all ages as is the case for the predominately private TE copies (supplementary file 16, Supplementary Material online). However, a two-sample Kolmogorov–Smirnov test indicates a significant difference between these two distributions (D = 0.198, P = 0.000). The difference in the cumulative frequency distributions is highest at a CpG adjusted Kimura substitution level of 10 (supplementary file 17, Supplementary Material online). This may indicate that these repeats derive from an older B chromosome.
Discussion
Several previous studies have noted similarities between B chromosomes and sex chromosomes and suggested that they may have shared origins (Camacho et al. 2000; Carvalho 2002). Due to the fact that African cichlids have several well-characterized B chromosomes and a high rate of sex chromosome turnover, we sought to test two competing hypotheses concerning the origin of a prominent giant sex chromosome in the Oreochromini. The first hypothesis is that an ancestral autosome gained a new sex-determining allele, upon which sexually antagonistic selection favored a reduction in recombination via a series of inversions. These reductions in recombination then allowed for the accumulation of many repetitive sequences, eventually resulting in the present giant sex chromosome. The second hypothesis is that an ancestral autosome fused with a highly repetitive B chromosome, and either the B chromosome harbored a dominant sex determination locus, or the ancestral autosome carried a sex determination locus and fused with a B chromosome to resolve genetic conflict(s). In either case, under this model, much of the repetitive nature of the LG3 giant chromosome is derived from the initial B chromosome that was later incorporated into the A genome via the fusion. This may have coincided with the spread of heterochromatin to silence transposable elements on the B chromosome, and a reduction of recombination outward from the fusion.
The LG3 giant chromosome functions as a WZ sex chromosome in at least several extant tilapia species. We have characterized the sex-determining interval as ∼25–134.4 Mb in T. mariae and ∼30–134.4 Mb in O. aureus using the new O. aureus ZZ reference. If the LG3 giant sex chromosome arose as a conventional sex chromosome, we would expect it to contain orthologous sequences across the entire length of the chromosome. We would also expect fewer orthologous sequences in the region of reduced recombination that has accumulated repetitive sequence. Alternatively, if the giant sex chromosome arose via fusion with a B chromosome, we would expect there to be a large region with no orthologous sequences compared with the ancestral autosome. Therefore, the primary test of these hypotheses was to examine the syntenic relationships of the LG3 giant sex chromosome with an example of the ancestral autosome. The medaka genome assembly was chosen for this synteny comparison since it shares the 24 chromosomes common to a majority of teleosts (Guyomard et al. 2012; Amores et al. 2014) and is representative of an ancestral karyotype that has not undergone many rearrangements (Kasahara et al. 2007). Additionally, several recent medaka genome assemblies (Ichikawa et al. 2017) are also very accurate and complete, which benefited our analysis. Figure 2 shows the alignment of the one-to-one orthologs between O. aureus LG3 and the corresponding medaka chromosome 18. The majority of one-to-one orthologs are found in LG3a, and a few are present in LG3a’. LG3b contains zero orthologs across at least 47 Mb. The 47-Mb comprising LG3b alone is larger than all but one other cichlid chromosome (the African cichlid-specific fusion of LG7 is the only larger chromosome at 66 Mb). This finding is consistent with the B chromosome fusion hypothesis. Considering the synteny results in the context of the first hypothesis, it is difficult to imagine a series of inversions and/or rearrangements that could have resulted in such a large portion of the chromosome that does not contain any ancestral orthologs.
The second test of the hypotheses was to examine a notable characteristic of fused chromosomes: the presence of interstitial telomere repeat sequences (ITSs) (Bolzán 2017). ITSs have been shown to be markers of ancient chromosome fusion events in several well-studied vertebrate genomes (Ijdo et al. 1991; Azzalin et al. 2001; Tsipouri et al. 2008). ITSs were found at two places on LG3b in O. aureus (116.9 and 130.6 Mb) and are not found on any other chromosomes. Previous cytogenetic studies in O. niloticus discovered two ITSs in roughly the middle of the long arm of LG3 (Chew et al. 2002; Harvey et al. 2003; Martins et al. 2004). So, the placement of the O. aureus ITSs is not completely consistent with the O. niloticus cytogenetic studies. This discrepancy may be explained either by differences in the structure of LG3 between these two Oreochromini species and/or limitations in the accuracy of the assemblies. The fact that two distinct ITSs are found on LG3b raises the possibility of multiple fusion events, inversion event(s) on LG3, and/or a more complicated history than either of our two hypotheses account for. There are also several important caveats that suggest the presence of these ITS sequences on LG3 may not be due to a chromosome fusion event. It is possible that ITSs were carried by TE families specific to subtelomeric regions or could have been inserted due to telomerase-mediated repair of double-stranded breaks (Bolzán 2017). Telomeres play a large role in chromosome stability, but the presence of ITSs can cause instability of chromosomes by acting as hotspots for breakage, recombination, and rearrangements (Aksenova and Mirkin 2019). ITSs also can be markers of chromosome rearrangement events (Schneider et al. 2013). It remains to be seen if the ITSs on the LG3 giant chromosome are simply markers of past rearrangement events or whether they also affect other chromosomal properties. Nonetheless, the presence of these ITSs on LG3b is more consistent with the B chromosome fusion hypothesis.
If the giant sex chromosome had originally evolved as a B chromosome for some time before a potential fusion and incorporation into the A genome, one might expect it to contain copies of unique TE families that are not present in the A genome. Indeed, these private TE families are more common on LG3 relative the other chromosomes (supplementary file 15, Supplementary Material online). These private TE families are mostly located on LG3a’ and LG3b. However, recombination in this region is lower and so the efficacy of purging deleterious TE insertions is also lower. The wide range in the age of the private TEs suggests that perhaps they evolved on a former B chromosome and not more recently (supplementary file 16, Supplementary Material online). Although these private TE families are much more common on the LG3 giant sex chromosome, the fact that two private TE families also occur on other chromosomes may mean that private TE families can arise in different ways and may not be diagnostic of a B chromosome. This piece of evidence does not strongly support or reject either hypothesis.
The remainder of the results gathered describing the LG3 giant sex chromosome including recombination, gene content, and the ampliconic regions are not able to distinguish between the two hypotheses regarding the origin of the giant sex chromosome since each feature shows similar patterns in both B chromosomes and sex chromosomes (Camacho et al. 2000). The synteny, ITSs, and private TE results that characterize the giant sex chromosome favor rejection of the canonical sex chromosome hypothesis to various degrees, but do not provide overwhelming evidence to reject this hypothesis. Figure 5 provides an overview of the putative steps that may have led to the formation of the giant sex chromosome under each hypothesis. Table 1 provides a summary of the results and how well they support each hypothesis.
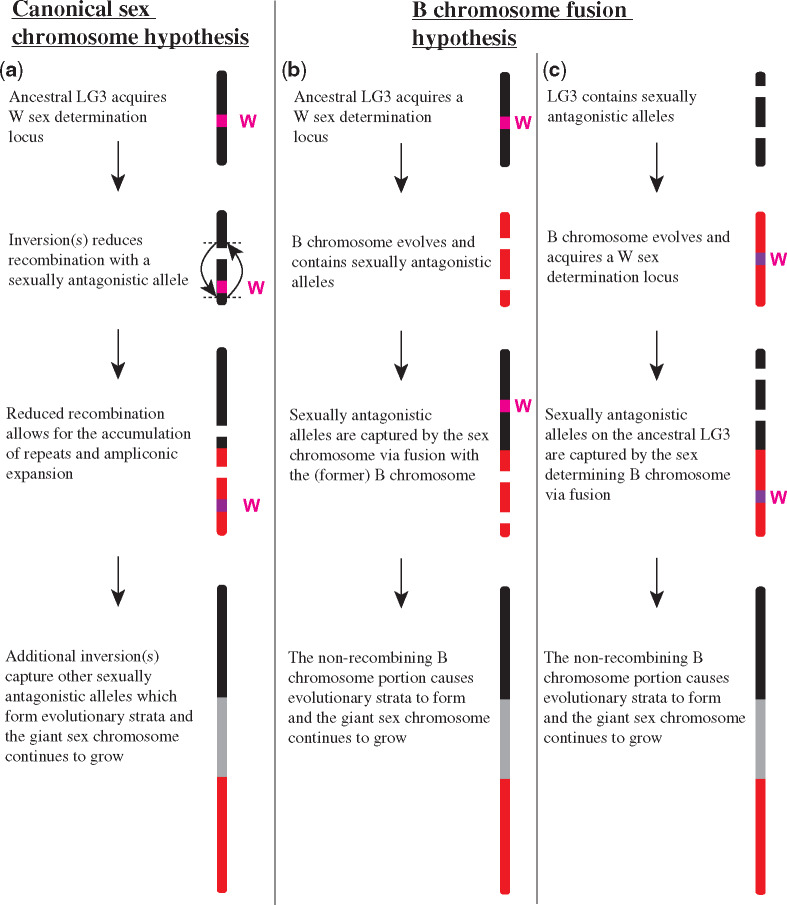
Putative steps involved in the evolution of the giant sex chromosome. (a) Canonical sex chromosome hypothesis. (b) B chromosome fusion hypothesis where the W sex determination locus evolved on the ancestral LG3 chromosome. (c) Alternative B chromosome fusion hypothesis where the W sex determination locus evolved on the B chromosome.

| Evidence/Result | Canonical Sex Chromosome Hypothesis | B Chromosome Fusion Hypothesis |
|---|---|---|
| Synteny of LG3 (fig. 2) | — | *** |
| Presence of interstitial telomere sequences (ITSs) on LG3b | — | ** |
| Recombination (fig. 3) | ** | ** |
| LG3 sequence content | ** | ** |
| Ampliconic arrays (fig. 4) | ** | ** |
| Private TEs on LG3 | — | * |
Note.—*** indicates strong support, ** indicates support, but with caveats, * indicates some support, — indicates no support.
Although the oreochromine giant sex chromosome provides a very intriguing new case to test the B chromosome fusion sex chromosome hypothesis, data from more cichlid species with and without B chromosomes are needed. Fusions of B chromosomes with A chromosomes are not unprecedented. The fusion of a B chromosome with an autosome has been shown in the fungus Nectria haematococca, where the B chromosome provides antibiotic resistance (Miao et al. 1991). Another B chromosome fusion has been shown in the grasshopper Eyprepocnemis plorans, where B chromosomes interact with nucleolar organization regions of A chromosomes that result in polymorphic fusion events (Teruel et al. 2009). B chromosomes that physically interact with A chromosomes at nonhomologous regions during different stages of the cell cycle may be more predisposed to fusions, although more examples would be needed to test this hypothesis. Yet another fusion has been reported in laboratory stock of the medfly Ceratitis capitata, where small B chromosomes fused with the X chromosome, creating polymorphism in X chromosome size (Basso and Lifschitz 1995). Populations in which B chromosomes are fused to a sex chromosome in some individuals of a population but not others, may provide the most suitable situation for studying the role of B chromosomes in the origin of sex chromosomes. It remains to be seen if such a situation still exists in any cichlid species.
The LG3 giant chromosome acts as a WZ sex chromosome in some species (e.g., O. aureus and P. mariae), but not in others (e.g., O. niloticus). There is not yet any evidence of heteromorphism between the W and Z chromosomes in any of these species, which is not unusual for cichlid sex chromosomes. Some species may have recently fixed either the W or Z chromosome, perhaps as the result of the frequent turnover of sex chromosome systems in this lineage. It will be easier to reconstruct the evolutionary history of these sex chromosome turnovers once the sex-determining gene(s) on LG3 are identified. It may appear that O. niloticus and O. aureus LG3 differ dramatically given the size difference (fig. 3). However, it is important to point out that the O. niloticus assembly contains more unanchored sequences than the new O. aureus assembly. Many of these unanchored sequences in O. niloticus assembly contain the LG3W sex determination interval (Conte et al. 2017). It is also important to note that analyses in this study rely on using an LG3 ZZ reference. Structural differences between the LG3 W and Z are not necessarily accounted for here and more will be learned with a high-quality LG3 W assembly.
It should also be noted that giant sex chromosomes do not appear to have evolved in other cichlid lineages. Most of the sex chromosomes identified in East African cichlids have evolved quite recently and show modest levels of differentiation. The extreme differentiation of LG3 in oreochromines compared with other cichlids suggests that this giant sex chromosome is much older than other cichlid sex chromosomes. There is no evidence to suggest that these more recent sex chromosomes are on a trajectory to become giant sex chromosomes.
Comparisons across many teleost genomes indicate that the LG3 giant sex chromosome has a distinct repetitive sequence content (supplementary files 9 and 10, Supplementary Material online). What process(es) may have caused this chromosome to acquire so many repeated sequences? Molecular evolutionary arms races are known to play a role in genome size evolution (Ågren and Wright 2015; Kapusta et al. 2017; Cosby et al. 2019). An arms race in which zinc-finger proteins evolve to bind to and suppress transcription of endogenous retroviruses (ERVs) has been well documented in mammalian genomes (Bruno et al. 2019; Wolf et al. 2020). Oreochromines have an average number of loci encoding zinc-finger proteins compared with other teleosts, but LG3 and particularly LG3b contains a large fraction of the zinc-finger proteins in the oreochromine genome (supplementary file 10, Supplementary Material online). So, it is possible that the increased number of zinc-finger proteins on LG3 is involved in silencing ERVs and perhaps other transposable elements. Although there is ongoing conflict between host and ERVs, studies have shown that ERVs can also be co-opted and contribute to host immunity and antiviral defense (Lynch 2016; Chuong et al. 2017; Frank and Feschotte 2017). It is possible that a by-product of this arms race is a benefit to the host immune system. This could explain why this giant chromosome is still present in species where it is not the sex-determining chromosome. lncRNAs also play a role in the immune response to viral infection (Satpathy and Chang 2015; Ouyang et al. 2016) and are very abundant on LG3b and compared with other teleost genomes.
Recently, high-quality genome assemblies of sex chromosomes have become available (Liu et al. 2019; Peichel et al. 2020). An assembly of the neo-Y chromosome in Drosophila miranda showed that the neo-Y chromosome has expanded and many of the genes have been amplified to high copy number (Bachtrog et al. 2019). Many of the genes on this neo-Y have functions related to chromosome organization such as chromosome organization/segregation, mitotic cell cycle, meiosis, spindle assembly, and kinetochore assembly. This gene content is very similar to the gene content of the two well-described African cichlid B chromosomes in Lake Victoria (Valente et al. 2014) and Lake Malawi (Clark et al. 2018) which also include ampliconic gene expansions. The purpose of the D. miranda neo-Y study was not to examine the potential involvement of a B chromosome, but the similarities are striking and may warrant investigation across various taxa harboring these such rapidly evolving chromosomes. Additional high-quality sex chromosomes will continue to become assembled and publicly available and it will be interesting to see what insights they will provide for investigating the similarities and origins of B chromosomes and sex chromosomes.
Conclusion
This study presents a new case to address questions about the possible origin of sex chromosomes from B chromosomes. Our results suggest that the giant sex chromosome in oreochromine cichlids did not arise via canonical sex chromosome evolution and instead arose via the fusion of an autosome with a B chromosome. Our work documents the structure of a unique sex chromosome in African cichlids and provides a benchmark against which the characterization of sex chromosomes in this group can be compared. More generally, it provides a new system for studying the evolutionary dynamics that play a large part in shaping chromosome architecture.
Materials and Methods
Oreochromis aureus DNA Sequencing and Assembly
The DNA sequencing and assembly of the O. aureus ZZ assembly (GCA_013358895.1) have been previously described (Tao et al. 2020) and is summarized here. High molecular weight DNA of O. aureus (from Wuxi Freshwater Fisheries Center in China) was extracted from muscle tissues using a Blood & Cell Culture DNA Midi Kit (Q13343, Qiagen, CA). DNA quality and quantity assessment were performed using a Qubit double-stranded DNA HS Assay Kit (Invitrogen, Thermo Fisher Scientific) and an Agilent Bioanalyzer 2100 (Agilent Technologies). Approximately 8 µg of genomic DNA from ZZ male O. aureus individual was size-selected (10–50 kb) with a Blue Pippin (Sage Science, Beverly, MA), and processed using the Ligation sequencing 1D kit (SQK-LSK108, ONT, UK) according to the manufacturer’s instructions. Libraries were constructed and sequenced on R9.4 FlowCells using the GridION X5 sequencer (ONT, UK) each at the Genome Center of Nextomics (Wuhan, China). To acquire a chromosomal-level assembly of the genome, 1 g of gonad tissue collected from the same O. aureus strain with a ZZ genotype and used for Hi-C library construction. The Hi-C experiment consisted of cell crosslinking, cell lysis, chromatin digestion, biotin label, proximity chromatin DNA ligations, and DNA purification, which were performed by Annoroad Genomics (Beijing, China) following the standard procedure (Lieberman-Aiden et al. 2009). The purified and enriched DNA was used for sequencing library construction. Illumina HiSeq X Ten platform (Illumina) was used to perform paired-end sequencing with a read length of 150 bp.
Flye (version 2.3.1) (Kolmogorov et al. 2019) was used to assemble the Nanopore raw reads, with default parameters. The draft assembly was then polished by Racon (version 1.3.1) (Vaser et al. 2017). To do so, the raw Nanopore reads were mapped using minimap2 (version 2.15-r905) (Li 2018), with options “-x map-ont –secondary=no.” Two rounds of Racon polishing were performed with default parameters. Purge_haplotigs (Roach et al. 2018) was used to remove tentative haplotigs (alternative haploid contigs). The coverage distribution of Nanopore reads was calculated using the “readhist” module in purge_haplotigs, after the reads were mapped against the assembly by minimap2. The options “-j 80 -s 80” were used to decide the classification of haplotigs, and the duplicate haplotigs were subsequently removed. The 3D-DNA pipeline (version 180922) (Dudchenko et al. 2017) was used to assembly the contigs into chromosomes. The Hi-C reads were first mapped against the contigs using Juicer (version 1.7.6) (Durand et al. 2016) with default settings. After removing the duplicates, the Hi-C contact map was directly taken as input for 3D-DNA. The parameters were set as “–editor-coarse-resolution 500,000 –editor-coarse-region 1,000,000 –editor-saturation-centile 5 -r 0.” Juicebox Assembly Tools (Dudchenko et al. 2018) were then used to review and manually curate scaffolding errors. Pilon (version 1.22) (Walker et al. 2014) was used to polish the assembly with Illumina sequencing reads. For the O. aureus ZZ genome, ∼40× sequencing data from a short-insert library were produced for polishing the assembly (NCBI BioProject PRJNA609616). The following options were then used by Pilon: “–minmq 30 –diploid –fix bases, gaps –mindepth 15.” To assess the completeness of the assembled genome, we screened the assembly for BUSCO genes (version 3.0.2) (Seppey et al. 2019) of actinopterygii. The “geno” model was used with default parameters.
WZ Sex Determination Locus on LG3
Whole-genome pooled sequencing of T. mariae males (SRR6660983/SRR6660984) and females (SRR6660979/SRR6660980) and O. aureus males (SRR5121056) and females (SRR5121055) were aligned to the O. aureus ZZ reference assembly using BWA mem version 0.7.12-r1044 (Li 2013) using most default parameters with the addition of “-t 20 -M -R,” where read groups were individually specified for each separate pool. Description of the materials and methods used to generate the T. mariae male and female reads are previously published (Gammerdinger et al. 2019). Description of the materials and methods used to generate the O. aureus male and female reads are previously published (Conte et al. 2017). Picard version 2.1.0 was used to sort the SAM files, mark duplicates, and index the BAM files. The samtools (Li et al. 2009) version 0.1.18 “mpileup” command was used to generate mpileup files for each comparison using default parameters with the “-f” parameter to specify the O. aureus reference. The popoolation2 (Kofler et al. 2011) “mpileup2sync.jar” tool was used to convert these mpileup files into sync files using the “–fastq-type sanger –min-qual 20 –threads 20” parameters and java version “1.6.0_41” with the “-ea -Xmx110g –jar” options. Perl version 5.16.3 was used to run the Sex_SNP_finder_GA.pl (Gammerdinger et al. 2016) script to calculate FST, and determine WZ sex-patterned SNPs with the following settings: “–fixed_threshold = 0.9 –minimum_polymorphic_frequency = 0.3 –maximum_polymorphic_frequency = 0.7 –minimum_read_depth = 10 –maximum_read_depth = 100 –minimum_read_count = 2 –sex_SNP_finder_window_size = 10,000.”
Synteny Analysis
Five-species one-to-one orthologs were computed using OrthoFinder version 2.3.3 with the “-I 5 -S diamond” options enabled. NCBI RefSeq protein annotations from five fish species were used as input for this analysis. They include the O. niloticus (GCF_001858045.2), Archocentrus centrarchus (GCF_007364275.1), A. calliptera (GCF_900246225.1), Metriaclima zebra (GCF_000238955.4), and the outgroup Japanese medaka Ory. latipes (GCF_002234675.1). OmicCircos (Hu et al. 2014) version 1.16.0 used with R version 3.4.1 was used to generate the plots of these ortholog synteny comparisons.
Whole Chromosome Synteny Analysis with Nucmer and genoPlotR
MUMmer version 4.0.0.beta2 (Kurtz et al. 2004) was used for whole-genome synteny analysis. First, the “nucmer” program was used to generate all-by-all comparisons of nucleotide sequences. The O. niloticus (GCF_001858045.2) and the Japanese medaka Ory. latipes (GCF_002234675.1) assemblies were compared with the O. aureus (GCA_013358895.1) assembly. For both comparisons, the “delta-filter” program was used to filter these alignments with the following options: “-1 -l 50 -i 50 -u 50.” Finally, the “show-coords” program was used to convert the “delta-filter” output into a tab-delimited file with the following options: “-I 50 -L 50 -l -T -H.” The alignments were visualized (fig. 3) using the R package genoPlotR version 0.8.9 (Guy et al. 2010).
Analysis of Oreochromis LG3b Content and Comparison across Teleost Genomes
We downloaded 69 publicly available teleost genomes (listed in supplementary file 9, Supplementary Material online) that have RefSeq annotation available from the NCBI FTP server (Anon.) (ftp://ftp.ncbi.nlm.nih.gov/). Immunoglobulin genes and lncRNAs were extracted from the RefSeq annotation GFF file which was also downloaded from the FTP server. These correspond to annotations that were current as of RefSeq release 94. RepeatModeler (Smit and Hubley 2010) (version open-1.0.8) was used to identify and classify repeats for each of the 69 teleost genome assemblies, separately. These de novo repeats specific to each teleost genome assembly were combined with the RepBase-derived RepeatMasker libraries (Bao et al. 2015), separately. RepeatMasker (Smit et al. 2010) (version open-4.0.5) was run then on each assembly using NCBI BLAST+ (version 2.3.0+) as the engine (“-e ncbi”) and specifying the combined repeat library (“-lib”). The more sensitive slow search mode (“-s”) was used.
A two-sample Kolmogorov–Smirnov test was generated using the Real Statistics Resource Pack software (Release 7.2) (Zaiontz 2020) and also used to generate the cumulative distribution differences plot (supplementary file 17, Supplementary Material online).
Gene Ontology and Statistical Enrichment Analysis
There is currently no Gene Ontology annotation of the most recent O. niloticus genome assembly (O_niloticus_UMDNMBU/GCA_001858045.3). Therefore, BlastX (version 2.2.28+) was used to align O. niloticus NCBI RefSeq transcripts (O’Leary et al. 2016) against Swiss-Prot (Bateman 2019) “release-2019_01” which had been formatted using the Trinotate (version 3.1.0) (Bryant et al. 2017) “Build_Trinotate_Boilerplate_SQLite_db.pl Trinotate” command. Those transcripts on LG3b which had a significant BlastX hit were compiled into a list of 614 gene symbols. This list was uploaded as an ID List for the PANTHER Gene List Analysis (Thomas et al. 2003) using Homo sapiens as an organism and performing a statistical overrepresentation test with the GO-Slim Biological Process annotation set. A Fisher’s exact test was performed, and the false discovery rate (FDR) was calculated. Only significant results with an FDR of P < 0.05 were kept.
The distribution of immunoglobulin genes on O. niloticus LG3 was examined using Fisher’s exact test in R (version 3.2.3). About 1-Mb intervals across the 917 Mb of anchored LGs were used to create 2 × 2 contingency tables for LG3, LG3a, LG3a’, and LG3b. The contingency tables consisted of counts of 1-Mb windows in each LG3 part and containing immunoglobulin genes or not. This method was also used for testing the significance of ampliconic genes on LG3 as well as satellite repeats.
Dotplot of O. aureus LG03
Gepard version 1.4 (Krumsiek et al. 2007) was used to align O. aureus LG03 to itself. Word lengths of 100, 200, 300, and 500 bp and a window size of 0 bp (to indicate no zoom windowing) were used.
Telomere Repeat Analysis
The “TTAGGG” telomere repeat sequences were detected via RepeatMasker output which was run on the O. aureus assembly in the same way as described above. The telomere repeat annotations were filtered based on repeat length. For O. aureus, this repeat length was set at 100 or greater.
Acknowledgments
We thank current and former members of the UMD cichlid labs for their countless discussions on this project. We acknowledge the University of Maryland supercomputing resources (https://hpcc.umd.edu/, last accessed December 15, 2020) made available in conducting the research reported in this paper. This study was supported by funding from the US National Science Foundation (DEB-1830753 to T.D.K.).