 Tracing the Genetic Legacy of the Tibetan Empire in the Balti
Molecular Biology and Evolution

Xing-Yan Yang and Allah Rakha authors contributed equally to this work.

- Altmetric
- Population Genomic Variation
- Population Genetic Structure
- Detection of Gene Flow
- Inference of Admixture Scenarios
- Analyses Based on Local Ancestry Inference
- Evidence for Sex-Biased Gene Flow
- Demic and Cultural Diffusion
- Supplementary Material
- Supplementary Material
- Author Contributions
- Data Availability
The rise and expansion of Tibetan Empire in the 7th to 9th centuries AD affected the course of history across East Eurasia, but the genetic impact of Tibetans on surrounding populations remains undefined. We sequenced 60 genomes for four populations from Pakistan and Tajikistan to explore their demographic history. We showed that the genomes of Balti people from Baltistan comprised 22.6–26% Tibetan ancestry. We inferred a single admixture event and dated it to about 39–21 generations ago, a period that postdated the conquest of Baltistan by the ancient Tibetan Empire. The analyses of mitochondrial DNA, Y, and X chromosome data indicated that both ancient Tibetan males and females were involved in the male-biased dispersal. Given the fact that the Balti people adopted Tibetan language and culture in history, our study suggested the impact of Tibetan Empire on Baltistan involved dominant cultural and minor demic diffusion.
Since 7th century AD, the arising and expansion of Tibetan Empire established by the ancient Tibetan people is regarded as a high point in ancient civilization of the Qinghai-Tibet Plateau (Uray 1979; Beckwith 1993). By conducting series of military campaigns, the Tibetan Empire controlled territory of 4 million km2, spanning parts of East Asia, Central Asia, and South Asia (fig. 1). More than 10 million people were under rule (Denwood 2008). The historical and archaeological records indicated massive population migrations along with series of military conquers by the ancient Tibetan Empire (Ming 2007; Denwood 2008), which could leave a profound legacy on the cultural and genetic diversity of human populations (Beckwith 1993; Walter 2009; Owen-Smith and Hill 2013). Nevertheless, little is known about the genetics of this cultural and military expansion of ancient Tibetans.

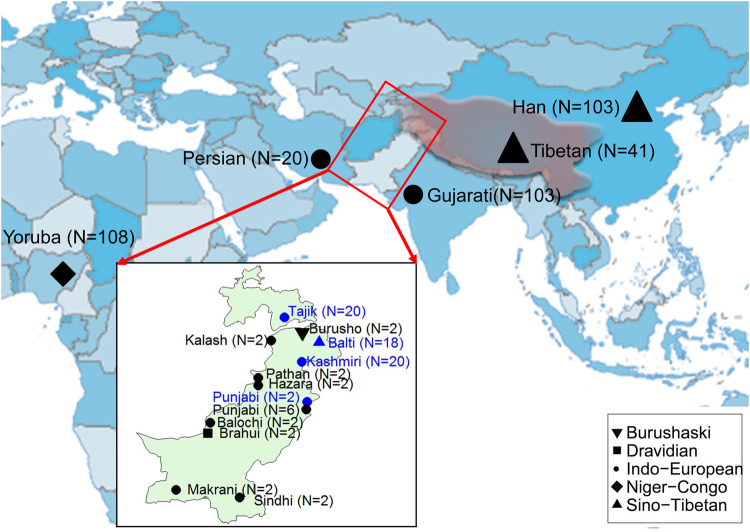
Whole-genome sequencing of four ethnic populations in Pakistan and Tajikistan. The populations sequenced in this study are labeled blue and previously published data are labeled in black. The WGS data set includes 455 individuals. The shape of the labels indicated the language family used in each population. The territory of the Tibetan Empire in its prime time during AD 780–800 is marked in shallow red. The detailed information is described in supplementary tables S1 and S2, Supplementary Material online.
The Balti people of Baltistan in Pakistan, an ethnic group proposed to be admixed of Tibetan immigrants with Indo-European (especially, Dardic) descents (Bakshi 1997), is a good model to trace the impact of ancient gene flow of Tibetans. There are two proposed sources for Tibetan contribution to Balti: the immigrants from Zhangzhung (i.e., Shangshung) which was an ancient kingdom locating in western and northwestern Tibet of China during 500 BC to AD 625 (Aldenderfer and Yinong 2004), and/or the immigrants as recent military conquers after the 7th century AD due to the expansion of Tibetan Empire (Uray 1979). In contrast to historical evidence, previous Y-chromosomal analyses revealed that the Balti individuals resembled their Indo-European speaking neighbors in northern Pakistan and no paternal gene flow from Tibetans was detected (Qamar et al. 2002). Recently, population genomic analysis has been proved as a powerful approach to explore human admixture history (Hellenthal et al. 2014; Brucato et al. 2017; Fernandes et al. 2019). However, the Balti and its neighboring populations were underrepresented in population genomic researches. Thus, the origin of Balti people is still opaque. In this study, we aimed to dissect the recent admixture derived from Tibetans into the Balti people during the historic period by analyzing whole-genome sequencing (WGS) data of the Balti and its neighboring populations.
Population Genomic Variation
We contextualized our newly generated data of 60 genomes including 18 Baltis from Gilgit-Baltistan, 20 Kashmiris from Azad Jammu and Kashmir, two Punjabis from Punjab in Pakistan, and 20 Pamiri Tajiks from Gorno-Badakhshan Autonomous Region in Tajikistan (fig. 1 and supplementary table S1, Supplementary Material online), with 395 published genomes from 14 modern populations (supplementary table S2, Supplementary Material online) (1000 Genomes Project Consortium. 2015; Lu et al. 2016; Mallick et al. 2016; Yang et al. 2018; Charati et al. 2019). The details for sampling, sequencing, SNP calling, data merging, and filtering were described in supplementary text, Supplementary Material online. A total of 4,252,528 autosomal SNPs for 455 individuals from 17 populations (supplementary table S3, Supplementary Material online) were used in the subsequent analyses.
To check the batch effect of joint SNP calling as well as potential bias in reference population sampling and data merging, we independently performed single-sample SNP calling for each of newly generated genomes as described before (Mallick et al. 2016). We then merged them with 753 high-depth sequencing genomes of globally diverse populations (Mallick et al. 2016; Bergström et al. 2020), to get a total of 61,126,197 autosomal SNPs for 879 individuals (supplementary table S3, Supplementary Material online). We applied analyses of the additional data set to validate the results of population structure and genetic admixture based on the WGS data of 455 individuals.
Population Genetic Structure
We applied principal component analysis (PCA) (Patterson et al. 2006) and ADMIXTURE (Alexander et al. 2009) based on the pruned WGS data of 455 individuals (supplementary table S3, Supplementary Material online) to discern the clustering pattern of the Balti to other populations and potential admixture in this population, respectively. The PCA under the continental level showed the separation between African (i.e., Yoruba) and other no-African populations in PC1, whereas the Balti individuals projected near other South Asians (supplementary fig. S1, Supplementary Material online). The PCA on a finer scale revealed that the Balti clustered with the regionally close Kashmiri and differentiated from Tibetan and Han populations (fig. 2A). The pattern could be well replicated in ADMIXTURE. Overall, when K = 3 (supplementary fig. S2A, Supplementary Material online), the genetic makeup of Balti population resembles that of East (“green”) and South/Central/West (“gray”) Asians (fig. 2B). Starting from K = 4, ADMIXTURE identified a West and Central Asian genetic component (“purple”), which was distinguished from the South Asian component (“gray”). The Tibetan-specific component (“blue”) in the Balti, Burusho, Hazara, and Punjabi populations was also well visible at K = 5, which has the best cross-validation index among all tests. The Iranian language-speakers’ component (“orange”) was inferred at K = 6. We then repeated PCA and ADMIXTURE in the additional data sets (supplementary tables S2 and S3, Supplementary Material online). All the results (supplementary figs. S3 and S4, Supplementary Material online) were supported by the patterns observed in WGS data of 455 individuals (fig. 2B).
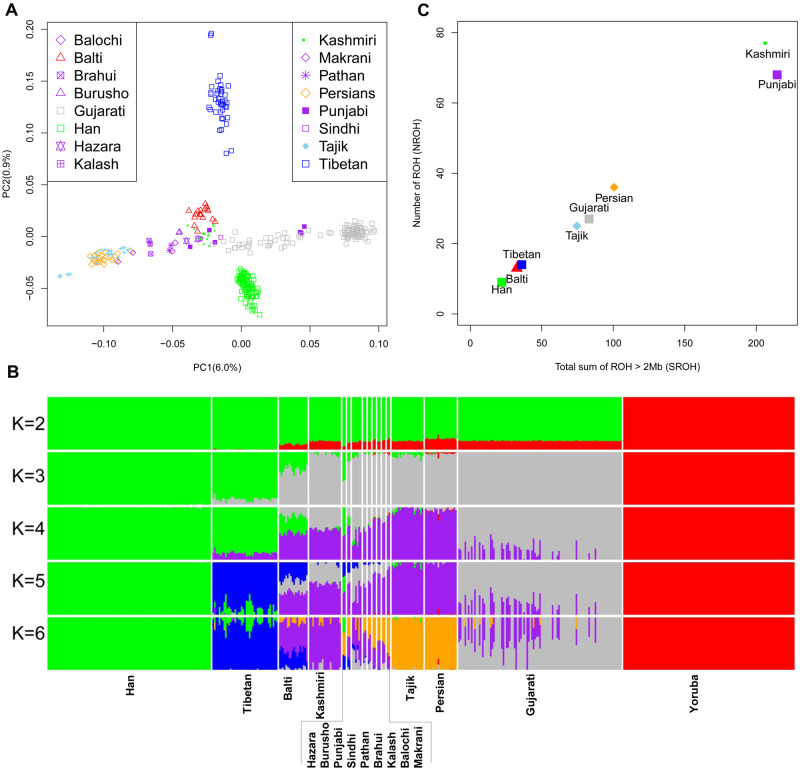
Population structure of the Balti and other populations. (A) PCA of the individuals from 16 Asian populations. (B) ADMIXTURE analyses for K values of 2–6 showing different contributions of ancestry. The analyses were based on the 472,755 SNPs in 17 populations after pruning of LD. The details for populations and data sets were described in supplementary tables S2 and S3, Supplementary Material online. (C) The mean sum total length of ROH (SROH) and number of ROH (NROH) in the Balti and other neighboring populations based on 5,408,870 SNPs.
We next used PLINK 1.9 (Chang et al. 2015) to scan the genomes for short (2–8 Mb) runs of homozygosity (ROHs) (Ceballos et al. 2018) to learn more about admixture as well as endogamy in the Balti population. The Kashmiri and Punjabi populations from Pakistan presented the highest mean number and sum of ROHs (fig. 2C), most likely due to a high level of consanguinity (Jabeen and Malik 2014). Similar to the Tibetan and Han populations, the Balti population carried low mean number and sum of ROH. The distribution of ROHs in the Persian, Gujarati, and Tajik populations was between the groups of Balti–Tibetan–Han and Kashmiri–Punjabi.
Detection of Gene Flow
We investigated the gene flow between the Balti and nearby populations using the following approaches: f3 and f4 (Patterson et al. 2012), TreeMix (Pickrell and Pritchard 2012), and identical by descent (IBD) sharing statistics (Bai et al. 2018). By using f3 (Balti; South/Central/West Asian, X), we found significant negative scores (Z ≤ −3) where X represented Tibetan, Han, or Hazara (supplementary fig. S5A, Supplementary Material online). As Hazara has been said to receive gene flow from East Asian (Lawson et al. 2012), we then explored f3 (Balti; Tibetan/Han, South/Central/West Asian) to show potential gene flow from East Asian (i.e., Tibetan or Han) to the Balti population (supplementary fig. S6A, Supplementary Material online). This process was also replicated by the f4 statistics (supplementary figs. S5B and S6B, Supplementary Material online). Referring to the context of population tree, we conducted TreeMix to show potential gene flow from Tibetan rather than Han to the Balti population (fig. 3A and supplementary fig. S7, Supplementary Material online). The Tibetan IBD segments (≥2 cM) shared in the Balti population is higher (W = 0.28) than that in Han Chinese (W = 0.19), whereas the pattern is not detected in the other neighboring populations (fig. 3B). The Han Chinese IBD segments (≥2 cM) were scarcely shared in the Balti population (fig. 3C). Therefore, Tibetan is proposed as one of candidate sources to the Balti population.
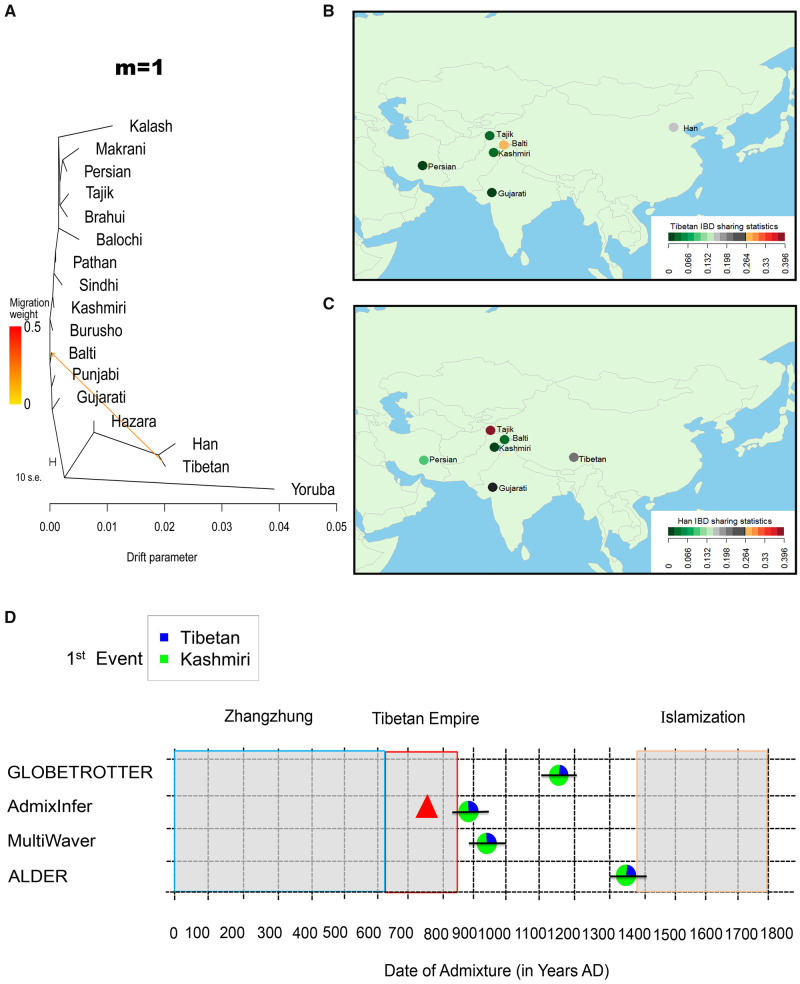
Gene flow, IBD sharing, and genetic dating. (A) The gene flow from the Tibetan into the Balti people inferred by using TreeMix for migration edges m = 1. The degree of recent gene flow measured by shared IBD segments between the Balti and Tibetan (B) and between the Balti and Han Chinese (C). The IBD segments with length ≥2 cM and significant score <10−5 were included. (D) Admixture event in the Balti population. The pie charts reflected the admixture proportions of ancestries and the lines represent the 95% confidence intervals of admixture dates. The durations for the Zhangzhung kingdom, the Tibetan Empire, and the Islamization of Baltistan are noted. The triangle refers to the time for Tibetan Empire conquered Baltistan in history.
Inference of Admixture Scenarios
Referring to the reported strategy (Busby et al. 2015), we first used CHROMOPAINTER and fineSTRUCTURE (Lawson et al. 2012) to characterize haplotype similarity and population assignment for the phased 455 genomes. The Balti, Tajik, Kashmiri, Tibetan, and Han individuals were grouped according to their population labels (supplementary fig. S8, Supplementary Material online). Some individuals from Punjabi, Persian, and Gujarati were clustered with other ethnic individuals, indicating the intricate genetic structure and admixture in those populations (Metspalu et al. 2011; Narasimhan et al. 2019). Excluding Hazara and Burusho with East Asian ancestry (Lawson et al. 2012), we assigned 14 populations as donors for the Balti population as receipt and re-ran CHROMOPAINTER. We then applied SOURCEFIND (Chacon-Duque et al. 2018) to characterize the Tibetan and Kashmiri ancestry components in the Balti population (supplementary fig. S9, Supplementary Material online). In addition, the Han ancestry component was detected in some runs. It was likely ascribed to the gene flows between Han and Tibetan populations after their divergence (Zhang et al. 2017). We then adopted GLOBETROTTER (Hellenthal et al. 2014) to infer the admixture scenario for the Balti population (supplementary table S4, Supplementary Material online). Our results showed that the Balti population originated from one-way admixture of the Tibetan and Kashmiri populations around 29 generations ago (fig. 3D and supplementary table S4, Supplementary Material online). The genetic contribution from the Tibetan to the Balti population was ∼26% (95% CI: 24.7–27.3%). Furthermore, we assigned 47 populations (especially including 15 populations from China and ten from Pakistan; supplementary table S2, Supplementary Material online) as donors and applied CHROMOPAINTER, SOURCEFIND, and GLOBETROTTER for the Balti population. The results supported the scenario of one-way admixture of the Tibetan and Kashmiri populations for the Balti dated to 27 generations ago (supplementary fig. S9 and table S4, Supplementary Material online). We adopted linkage disequilibrium-based methods ALDER (Loh et al. 2013) to estimate admixtures date of 21.31 ± 3.2 generations in the Balti using Tibetan and Kashmiri populations as proxies for the ancestral sources (fig. 3D and supplementary table S4, Supplementary Material online).
We applied qpAdm and qpGraph (Patterson et al. 2012) to model the admixture scenario inferred above for the Balti population (supplementary text, Supplementary Material online). The qpAdm analyses supported the candidate ancestry sources and their proportions as Kashmiri (76%) and Tibetan (24%) (supplementary table S5, Supplementary Material online). The qpGraph analysis showed the graph fitted recent Tibetan-ancestry gene flow into the Balti population (supplementary fig. S10, Supplementary Material online). When the published ancient DNA data from South and Central Asia (Narasimhan et al. 2019) were included for outgroup f3 and f4 statistics, we found no evidence of Tibetan-derived gene flow into the ancient samples (supplementary fig. S11, Supplementary Material online).
Analyses Based on Local Ancestry Inference
To further characterize the demographic history of specific ancestries, we intersected the results of local ancestry inference in the Balti genomes with referring to Tibetan and Kashmiri as candidate source populations in PCAdmix (Brisbin et al. 2012) (supplementary fig. S12A, Supplementary Material online) and RFMix (Maples et al. 2013) (supplementary fig. S12B, Supplementary Material online). We then calculated the length distribution of the ancestral tracts detected with PCAdmix to infer the admixture in the Balti population under various scenarios (fig. 3D and supplementary table S4, Supplementary Material online). The results of AdmixInfer (Ni et al. 2016) under a general admixture model suggested a continuous gene flow model for the Tibetan (22.6%)–Kashmiri (77.4%) admixture occurred about 39 generations ago. Further estimation using MultiWaver (Ni et al. 2019) under multiple-wave admixtures model also indicated one wave of the Tibetan (22.6%)–Kashmiri (77.4%) admixture taking place about 36 generations ago, rejecting the scenario of multiple-wave admixtures.
We retrieved the selective genes for high-altitude adaptation in Tibetans reported in published references and then scanned their enrichment in the Balti genomes (supplementary tables S6 and S7, Supplementary Material online). We adopted the threshold of genome-wide mean + 3SD (Bryc et al. 2015) to indicate an excess of local Tibetan ancestry in the RFMix (Maples et al. 2013) inferred tracts (supplementary fig. S12C and D, Supplementary Material online). We found that few Tibetan-specific adaptive genes were significantly enriched (>3 SD) (supplementary tables S6 and S7, Supplementary Material online). Nevertheless, the potential sampling bias due to small sample size (n = 18) might limit power to test the postadmixture selection hypothesis (Tang et al. 2007), which generally requires huge sample size (Jin et al. 2012; Bhatia et al. 2014).
Evidence for Sex-Biased Gene Flow
To check the roles of both sexes in the admixture, we analyzed the mitochondrial DNA (mtDNA), Y, and X chromosomal variation retrieved from the WGS data (supplementary text, Supplementary Material online). The mtDNA gene pool (supplementary table S1, Supplementary Material online) of the 18 Balti individuals comprised the haplogroups being predominant in West Eurasians (4/18): H6a1b, HV, R0a2, and U4b1a1a1 (Pala et al. 2012), South Asians 6/18: M5a2a, M65a, M65b, T2c, U2a1a, and U2b2 (Palanichamy et al. 2004; Sun et al. 2006), and East Asians 8/18: A, B4a4, F1d, M70, M9a1a1cb1a, and Z7 (Kong et al. 2003; Tanaka et al. 2004). In particularly, mtDNA haplogroups M70 (Kong et al. 2011; Kang et al. 2013), M9a1a1cb1a (Peng et al. 2011), and Z7 (Chandrasekar et al. 2009) were characterized in Tibetan, Sherpa, and Monpa populations. The dissection of Y chromosomal profile (supplementary table S1, Supplementary Material online) revealed that most paternal lineages (9/10) belong to haplogroups J, L, and R in the Balti males are likely from South Asians (Mondal et al. 2017; Ullah et al. 2017), or the neighboring West Eurasians (Lacau et al. 2012). The Tibetan-predominant haplogroup D1 (Shi et al. 2008) occurred in one Balti male. The Tibetan-ancestry proportions inferred by ADMIXTURE (Ongaro et al. 2019) were significantly higher (Wilcoxon test, P < 0.05) in autosomes than X chromosome (supplementary fig. S13, Supplementary Material online), suggesting higher contribution of Tibetan-ancestry males than females into the gene pool of Balti population.
Demic and Cultural Diffusion
Our population genomic analyses showed that the Balti population is a consequence of genetic admixture of exotic Tibetan (22.6–26%) and indigenous Kashmiri ancestries (74–77.4%) (fig. 3D). The gene flow from the Tibetan into the Balti population was dated around 39–21 generations ago, corresponding to AD 869–1391, assuming a generation time of 29 years (Langergraber et al. 2012), with multiple dating approaches (fig. 3D). The historical records report the Baltis’ homeland—Baltistan (known as Bruzha)—was conquered by the armed forces of Tibetan Empire at AD 757 (Denwood 2008) and then was controlled by Tibetans until 10th century (Dani 1998). The collapse of Tibetan Empire in AD 841 and subsequent civil wars drove mass migrations of Tibetans into northwestern Tibet and Kashmir (including Baltistan) regions (Shakabpa and Maher 2009). In particular, the analysis of X chromosome showed the gene flow was male-biased. Our results support the scenario, that is, the Tibetan-ancestry in the modern Balti population could be traced back to the military invasions and subsequent immigrants of Tibetan Empire.
The Tibetan-derived gene flow also brought substantial culture diffusion including language shift and elite dominance. The Balti people are Tibetic language speakers (Owen-Smith and Hill 2013). They historically practiced Tibetan writing, Bön, and Tibetan Buddhism before the arrival of Islam around the 15th century AD (Walter 2009). Our analyses of ROHs (fig. 2C) suggested that the Balti population did not adopt the traditional endogamy which was popular in Kashmiris (Jabeen and Malik 2014). Thus, the expansion of ancient Tibetan Empire into Baltistan brought minor demic diffusion accompanied with dominant cultural diffusion. Given the genetic diversity and structure existing in populations of Pakistan (Metspalu et al. 2011) and Tibet of China (Jeong et al. 2017; Zhang et al. 2017), the population genomic investigation with extensive sampling (Cole et al. 2017; Arciero et al. 2018), even accompanying with ancient DNA (Jeong et al. 2016; Narasimhan et al. 2019), are still required to discern the detailed genetic changes during the expansion of ancient Tibetan Empire.
Acknowledgments
We are grateful to all volunteers and samplers. We thank Rasmus Nielsen and Guanghui Dong for comments and discussions and Shaobin Xu for assistance in computation. This study was supported by grants from the Strategic Priority Research Program of the Chinese Academy of Sciences (XDA20040100 and XDA20090000), the National Natural Science Foundation of China (31621062 to Y.-P. Z.) and the Bureau of Science and Technology of Yunnan Province, the Chinese Academy of Sciences President’s International Fellowship Initiative, and the Animal Branch of the Germplasm Bank of Wild Species, Chinese Academy of Sciences (the Large Research Infrastructure Funding). M.-S.P. appreciates the support from the Youth Innovation Promotion Association of the Chinese Academy of Sciences.
Author Contributions
Y.P.Z., M.S.P., and A.R. designed research. A.R., N.T.A., M.E.A., K.B.I., X.C., W.K.Y., and A.A. collected the samples. X.Y.Y. conducted experiments. X.Y.Y. and M.S.P. analyzed the data and wrote the paper. Y.P.Z., W.C., J.H., X.B.Q., Y.G.Y., and B.S. revised the paper. Q.K.S., S.S.D., X.S., and R.H.Z. provided technical assistance. All authors read and approved the final manuscript.
Data Availability
The newly generated genome-wide sequence data of 60 individuals (FASTQ format) in this study have been deposited in the Genome sequence Archive in Big Data Center (http://gsa.big.ac.cn/; accession project numbers PRJCA000456 and PRJCA000457) and Japanese Genotype-Phenotype Archive (http://trace.ddbj.nig.ac.jp/jga; study accession number JGAS00000000238).