 How to Make a Rodent Giant: Genomic Basis and Tradeoffs of Gigantism in the Capybara, the World’s Largest Rodent
Molecular Biology and Evolution


- Altmetric
Gigantism results when one lineage within a clade evolves extremely large body size relative to its small-bodied ancestors, a common phenomenon in animals. Theory predicts that the evolution of giants should be constrained by two tradeoffs. First, because body size is negatively correlated with population size, purifying selection is expected to be less efficient in species of large body size, leading to increased mutational load. Second, gigantism is achieved through generating a higher number of cells along with higher rates of cell proliferation, thus increasing the likelihood of cancer. To explore the genetic basis of gigantism in rodents and uncover genomic signatures of gigantism-related tradeoffs, we assembled a draft genome of the capybara (Hydrochoerus hydrochaeris), the world’s largest living rodent. We found that the genome-wide ratio of nonsynonymous to synonymous mutations (ω) is elevated in the capybara relative to other rodents, likely caused by a generation-time effect and consistent with a nearly neutral model of molecular evolution. A genome-wide scan for adaptive protein evolution in the capybara highlighted several genes controlling postnatal bone growth regulation and musculoskeletal development, which are relevant to anatomical and developmental modifications for an increase in overall body size. Capybara-specific gene-family expansions included a putative novel anticancer adaptation that involves T-cell-mediated tumor suppression, offering a potential resolution to the increased cancer risk in this lineage. Our comparative genomic results uncovered the signature of an intragenomic conflict where the evolution of gigantism in the capybara involved selection on genes and pathways that are directly linked to cancer.
Introduction
Body size is arguably the most apparent characteristic when studying multicellular life, and understanding how and why body size evolves has been a major question in biology (Haldane 1927; Bonner 1968). Body size is a canonical complex trait, and, consequently, ontogenetic changes underlying body size evolution directly impact other life-history traits, such as fecundity and longevity (Calder 1984; Shingleton 2011). Yet, the genetic and developmental bases of size variation among species are not well understood for most lineages. Although increase in body size likely has several selective advantages (Purvis and Orme 2005), maximum body size in tetrapods appears to be determined mostly by intrinsic biological constraints (McNeill Alexander 1998; Kozlowski and Gawelczyk 2002; Sookias et al. 2012). Two major costs to the evolution of large bodies are the reduction in population size, which may increase extinction risk, and the increased risk of developing growth-associated diseases, such as cancer (Damuth 1981; Caulin and Maley 2011).
Not only do larger species have lower population densities (Damuth 1981), they also show slower metabolic rates, longer generation times, and a reduced reproductive output (Calder 1984). Together these traits lead to an overall reduction in the genetic effective population size (Ne) relative to small-bodied species (Leffler et al. 2012). In a finite population, the interplay between selection and genetic drift determines the fate of newly arisen mutations, and the strength of drift relative to selection will largely depend on Ne (Charlesworth 2009). In smaller populations, slightly deleterious mutations are expected to accumulate at a higher rate than in larger populations, due to stronger genetic drift relative to purifying selection, thus increasing the mutation load in the population, which may further increase the risk of extinction (Lynch and Gabriel 1990). In addition, animals show positive allometric scaling of number of cells in the body with overall body size (Savage et al. 2007), that is, animals evolve large body size mainly by increasing cell numbers not cell sizes. Thus, if every cell has an equal probability, however low, of becoming cancerous, and related species have equivalent cancer suppression mechanisms, the risk of developing cancer should increase as a function of the number of cells. Therefore, large species should face a higher lifetime risk of cancer simply because large bodies contain more cells (Caulin and Maley 2011; Tollis et al. 2017). Moreover, giant body sizes are achieved mainly by an accelerated postnatal growth rate (Erickson et al. 2001), which represents an increment in cell proliferation rates, as well (Lui and Baron 2011). For a given mutation rate, an elevated rate of cell proliferation accelerates the rate of mutation accumulation and, thus, increases the chances for a cell population of becoming cancerous (Cairns 1975).
The continued existence of enormous animals, such as whales and elephants, implies, however, that the evolution of gigantism must be coupled with the evolution of cancer suppression mechanisms. The lack of correlation between size and cancer incidence is known as Peto’s Paradox and suggests that large-sized species have mitigated the inherent increase in cancer risk associated with the evolution of large bodies (Caulin and Maley 2011; Tollis et al. 2017). For instance, genomes of two of the largest living groups of mammals, proboscideans (Asian and African elephants) and cetaceans (whales and dolphins), revealed lineage-specific expansion of genes associated with tumor suppression via enhanced DNA-damage response (Sulak et al. 2016; Vazquez et al. 2018) and positive selection in cell-cycle control pathways (Tollis et al. 2019), respectively. These genomic changes likely evolved in response to cancer selection, that is, selection to prevent or postpone deaths by cancer at least until after reaching reproductive maturity. Such changes might account for the relative lower incidence of cancer in large animals and the evolution of anticancer mechanisms (Leroi et al. 2002).
Among mammals, rodents are the most diverse group in terms of species richness and morphological disparity, particularly in body size. South American rodents of the infraorder Caviomorpha represent one of the most spectacular evolutionary radiations among living New World mammals (Hershkovitz 1972), and fossil data suggest the independent evolution of gigantism in at least three lineages (Vucetich and Deschamps 2015). Caviomorphs have the broadest range in body size within rodents, and make Rodentia one of the mammalian orders with the largest range in body size (Sánchez-Villagra et al. 2003). Most notable among the caviomorphs is the largest living rodent, the capybara, Hydrochoerus hydrochaeris (Linnaeus, 1776), family Caviidae (fig. 1C). Capybaras have an average adult body weight of 55 kg (Nowak and Paradiso 1983), being 60 times more massive than their closest living relative, the rock cavies (Kerodon sp.). Overall, capybaras are 3 orders of magnitude above the mean body size for the order and ∼2,000 times more massive than the common mouse, Mus musculus (Nowak and Paradiso 1983). Previous studies of physiology and molecular evolution showed that caviomorph insulin, a hormone involved in growth and metabolism, has a higher mitogenic effect relative to other mammalian growth factors (King and Kahn 1981; Opazo et al. 2005), suggesting that lineage-specific changes in insulin within caviomorphs may coincide with important changes in life-history traits. However, the genomic basis of the capybara’s unique size remains unexplored. Additionally, there is evidence that telomerase activity has coevolved with body mass in rodents, with the largest species (i.e., capybara and beaver) displaying low telomerase activity in somatic tissues, suggesting a potential role for replicative senescence as a cancer suppression mechanism in large-bodied rodents (Seluanov et al. 2007).

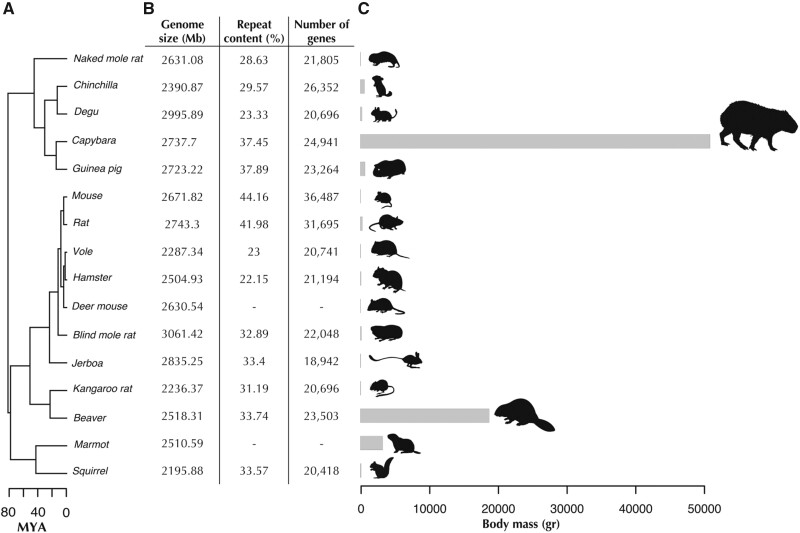
Divergence times, genome assembly statistics and body mass of representative rodents used for comparative genomics analyses. (A) Divergence times of rodent species using the topology obtained from the phylogenomic analysis (see Materials and Methods). Ma, million years ago. (B) Basic genome assembly statistics of rodent species included in comparative analyses. Repeat content and gene content were unavailable for deer mouse and marmot. (C) Body mass ranges from 20.5 g for the mouse to 55,000 g in the capybara, the largest living rodent.
Here we investigate 1) whether there is genomic evidence of demographic processes precipitating a genome-wide cost to evolving a large body size, 2) the genetic factors underlying the evolution of capybara’s giant body size, 3) whether capybara has a unique solution to its increased risk of cancer relative to smaller rodents, and 4) the relationship between growth-regulatory pathways and cancer during the evolution of gigantism.
Results
Genome Assembly and Annotation
We generated a whole-genome sequence and de novo assembly of a female capybara, using a combination of a DISCOVAR de novo assembly and Chicago libraries (see Materials and Methods). The total length of the assembly was 2.73 Gb, slightly shorter than the genome size estimated by flow cytometry of 3.14 Gb (table 1), including 73,920 contigs with an N50 of 12.2 Mb and the longest contig at 75.7 Mb. The GC content was estimated at 39.79%.

| Starting Assembly (Shotgun + DISCOVAR de novo) | Final Assembly (adding Chicago + HiRise) | |
|---|---|---|
| Total length (Mb) | 2,735 | 2,738 |
| Contig N50 (kb) | 148 | 161 |
| Number of scaffolds | 656,018 | 73,920 |
| Scaffold N50 (Mb) | 0.202 | 12.2 |
Our capybara assembly had very high coverage of coding regions: We recovered 89% of the 3,023 vertebrate Benchmarking Universal Single-Copy Orthologs (BUSCO pipeline; . We used guinea pig, rat, and mouse Ensembl protein sets to guide the homology-based annotation with MAKER v2.31.9 (). Most of the repeat content (72.5%) corresponded to transposable elements, with LINE-1 the most abundant (20.46%), similar to the mouse genome (Waterston et al. 2002). Further comparison across the rodent phylogeny showed that both genome size and repeat content of the capybara are comparable to that of other rodents (fig. 1B).
The Little Giants: Phylogenetic Analysis of Body Mass Evolution
To determine whether the capybara could be considered a giant based on a lineage-specific accelerated rate of body mass evolution, we used phylogenetic comparative methods. We found that the rate of body mass evolution among caviomorph rodents has not been constant throughout their phylogenetic history, as shown by the better fit of a multirate model compared with the single-rate-Brownian Motion model (ΔDIC = 78.6; supplementary table S1) with an estimated value of α = 1.35 (95% confidence interval [CI] of 1.0–1.7). The ancestral body size of the most recent common ancestor (MRCA) of Caviomorpha was estimated to be 971 g (95% CI: 221–5,135 g) and the size of the MRCA of the capybara and rock cavy (Kerodon rupestris) was estimated to be 1,132 g (95% CI: 437–23,225 g), suggesting that the rate of body size evolution has undergone one or more sudden changes.
Using the AUTEUR package (Eastman et al. 2011), we inferred three shifts in the rate of body-mass evolution along the caviomorph tree (supplementary fig. S4): one decrease in evolutionary rate at the root of the Octodontoidea clade (shift probability of 0.11), and two incidences of rate acceleration. The first rate increase was localized on the branch leading to the coypu (Myocastor coypus; shift probability of 0.16), the largest species within Octodontoidea, and a second increase, with the highest posterior support (shift probability of 0.44), in the MRCA of the capybara, rock cavy, and Patagonian mara (Dolichotis patagonum). Capybaras and Patagonian maras are the largest living species of caviomorph rodents, yet the capybara is approximately three times heavier (supplementary fig. S5). These results suggest that the capybara evolved from a moderately small ancestor, comparable to the size of a guinea pig, indicating that capybara’s characteristic large body size was achieved by a spurt in the rate of body mass evolution (see also Álvarez et al. 2017).
The accelerated rate of body mass evolution observed in capybaras relative to other rodents parallels the rate acceleration observed in the world’s largest animals, for example, elephants, the largest living terrestrial mammals relative to their much smaller afrotherian ancestors (Puttick and Thomas 2015), baleen whales including the blue whale, the largest animal to have ever lived, relative to ancestral mysticetes (Slater et al. 2017), and sauropodomorphs, the largest terrestrial animals in Earth history, relative to other dinosaurs (Benson et al. 2014). Thus, the tempo and mode of body size evolution in rodents demonstrates that the capybara also provides an example of gigantism.
Having characterized the genome and the mode of body mass evolution, we undertook detailed analyses of key genes and gene families to explore the genomic basis of the capybara’s large size, identified possible molecular adaptations related to cancer suppression, and detected the genomic signatures associated with a reduced Ne.
Body Size, Ne, Generation Time, and Genome-Wide Substitution Rates
We tested the hypothesis that larger species should harbor a higher number of slightly deleterious mutations, that is, mutation load, as a result of a reduction in population size. Under the simplifying assumption that synonymous mutations are neutral, the ratio of nonsynonymous substitutions to synonymous substitutions (dN/dS, or ω) can be also thought of as a measure of the strength of purifying selection over evolutionary time >4Ne generations (Elyashiv et al. 2010). Therefore, genome-wide (as opposed to gene-specific) inflation of ω indicates a reduction in the efficacy of purifying selection and thus a potential increase in the mutation load (Figuet et al. 2016). Because the strength of purifying selection relative to drift is lower in smaller populations (Ohta 1992; Popadin et al. 2007), and body mass is negatively correlated with population size (Damuth 1981), we expected a genome-wide increase in ω in the capybara relative to smaller rodents. To explore this prediction, we used body mass for each of 15 rodent species with available genome assemblies (fig. 1) as a proxy for Ne, and median genome-wide ω values across 229 single-copy gene orthologs (SCOs) as measure of the genetic load. We found that the median genome-wide ω in the capybara is higher relative to the rest of rodents (0.0964 and 0.0674, respectively; permutation test P-value < 0.001, table 2). Upon closer inspection, however, we found that the genome-wide median dN in capybara was similar to the rest of rodents (0.0063 vs. 0.0069, respectively; permutation test P-value > 0.1; table 2), thus the higher genome-wide ω in capybara was actually caused by its significantly lower median dS (0.065 vs. 0.108, respectively; permutation test P-value < 0.0001; table 2). A closer comparison between the capybara and guinea pig showed that this pattern was not likely affected by differences in GC composition among the genes or between species (supplementary fig. S6). Further, body mass showed a weak negative correlation with dS, but no correlation with dN values among rodents (fig. 2C). A lower genome-wide median dS could be caused by a generation-time effect (GTE), where longer generation times can lead to slower rates of neutral evolution per unit time (Ohta 1993; Chao and Carr 1993). Consistent with this hypothesis, body mass and generation time were positively correlated across rodents (fig. 2A).
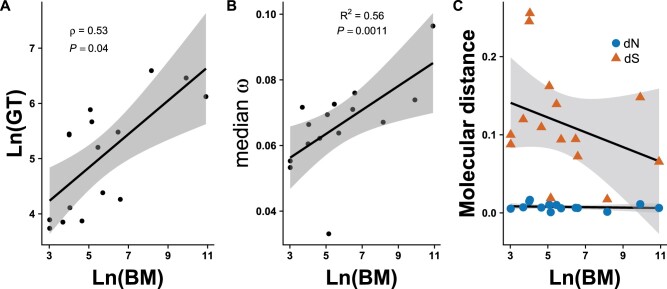
Generation-time effect on rates of molecular evolution among rodent genomes. (A) Correlation of body size and generation time among rodents (Phylogenetic Independent Contrasts (PIC): Spearman’s r = 0.535, P-value < 0.05). (B) Regression of log-transformed body mass values with genome-wide median w for each rodent species, excluding the naked mole rat, based on values for 229 SCOs (see text for details; PIC: R2 = 0.563, df = 12, P-value < 0.01). (C) Regression of log-transformed body mass values with genome-wide median w for each rodent species partitioned into dN and dS, excluding the naked mole rat, based on values for 229 SCOs (dS: effect = −0.0094, df = 13, P-value > 0.05; dN: effect = 0.0, df = 13, P-value > 0.05).
| ω | d N | d S | |
|---|---|---|---|
| Capybara | 0.0964 | 0.006 | 0.065 |
| Other rodents | 0.0674 | 0.006 | 0.108 |
| P-value * | <0.001 | 0.246 | <0.0001 |
* P-values are based on permutation tests. The elevated ω value observed in the capybara is caused by an overall lower synonymous substitution rate (dS) relative to the rest of rodents consistent with a GTE.
The naked mole rat (Heterocephalus glaber) had the highest genome-wide median ω of 0.105, much higher than the expected value according to its body mass and generation time in the model (; outlier based on standardized residuals analysis), suggesting that interspecific variation in ω is influenced by additional factors not related to the GTE. Previous studies showed evidence that a subterranean lifestyle and eusosociality (both present in H. glaber) are factors that further reduce Ne leading to a reduction of genetic diversity and an increase in mutation load (Romiguier et al. 2014; Visser et al. 2018), which may explain the inflation of ω in this species. In fact, the proportion of variation in genome-wide median ω that is explained by body mass (R2) increases from 0.28 to 0.56 when the naked mole rat is left outside the analysis (fig. 2B). Additionally, we estimated ω values for the 13 protein-coding mitochondrial genes in ten rodent species (supplementary table S3) and found that the capybara and naked mole rat present higher than average median ω values for both genomes, confirming our hypothesis of an independent reduction in Ne in both species (supplementary fig. S7). Although the capybara does not harbor a net higher number of fixed nonsynonymous substitutions, as is expected for mutation load, the decoupling of dN and dS values with size, and the constancy of dN values across all rodent species suggests that there is an elevated proportion of fixed nonsynonymous substitutions relative to the neutral expectation as body size increases. Taken together, these results provide evidence consistent with a nearly neutral model of molecular evolution among rodent species and support the existence of a GTE in the capybara linked to the evolution of its large size.
Gene-Specific Rates of Evolution in the Capybara Are Linked to Cellular, Metabolic, and Developmental Pathways Related to Growth
The distribution of estimated ω values for the 229 SCOs (see Materials and Methods) in the capybara was bimodal, with a left peak centered at ω = 0.09 (N = 193 genes), and a right peak at ω = 0.52 (N = 33 genes; ), whereas the combined distribution of ω values for the rest of rodents was unimodal and centered at ω = 0.06. A Gene Ontology (GO) enrichment test of these 33 high-ω genes in the capybara showed an overrepresentation of 22 GOSlim categories (out of 122; P-values < 0.05 after Bonferroni correction) that mainly included metabolic processes such as oxidoreductase activity, generation of precursor metabolites and energy, small molecule metabolic process, and cofactor metabolic process, among others. Additionally, these 33 genes had significantly higher median dN compared with the genes in the left peak (0.03 vs. 0.006, respectively; Welch’s two sample t-test, t = 7.18, df = 33.31, P-value < 0.0001) but did not differ significantly in median dS. Taken together, these results suggest that a shift possibly related to an increase in basal metabolic rate, which has been associated with an increase in body size (White and Seymour 2003), may be causing the bimodal distribution in the capybara.
In order to identify genes related to gigantism and cancer resistance, we performed an analysis of positive selection on the capybara lineage using codon-based models of evolution (Yang 2007; Smith et al. 2015) that take into account heterogeneous selection pressure at different sites within proteins, combined with a protein sequence-divergence approach (see Materials and Methods). We identified a set of 4,452 SCOs between five available genomes of hystricognath rodents: naked mole rat, degu (Octodon degus), chinchilla (Chinchilla lanigera), guinea pig, and capybara (fig. 3 inset). We considered genes as positively selected in the capybara lineage when they fell in the top 5% of fastest evolving genes as estimated by both of two metrics, the likelihood ratios (LRs) of branch-site models and the standardized protein distance index (PDI) statistic of protein p-distance, resulting in 39 candidate genes (fig. 3; supplementary fig. S13; see Materials and Methods). The modest number of candidate genes is not surprising given the low levels of protein divergence between capybara and guinea pig (mean: 0.01, 95% CI: 0.009–0.012). Our approach using two filters yielded more conservative results than filtering genes based on either the false discovery rate or a Bonferroni correction of LR P-values (0.01), which yielded a number of genes putatively under selection equal to 1,229 and 920, respectively. Thus, our approach narrows the set of candidate genes by identifying the genes with the strongest signals.
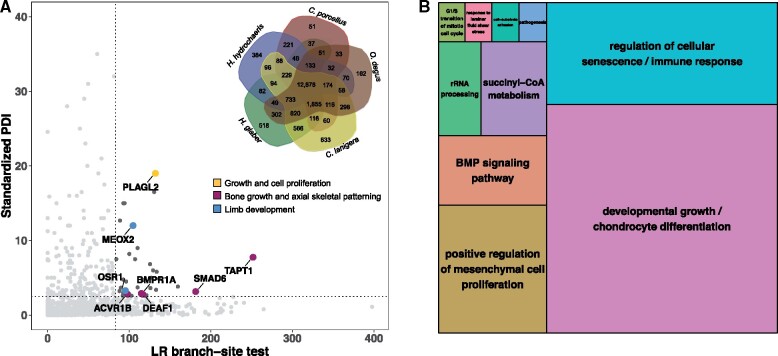
Positively selected genes in the capybara. (A) Standardized PDI represents the corrected divergence in amino acid sequences in capybara versus degu relative to the guinea pig (see Materials and Methods). LR branch-site test scores represent strength of evidence for positive selection acting on specific residues within the capybara protein sequence relative to the other four hystricognath rodent species (see Materials and Methods). Dark gray dots are genes that lie in the extreme 5% of both distributions (dotted lines) and are, thus, considered to be under positive selection according to our two criteria. Among the 39 genes putatively under positive selection, eight were associated with body size regulation (colored dots and arrows). PLAGL2, pleiomorphic adenoma-like protein 2; OSR1, odd skipped related transcription factor; ACVR1B, activin A receptor 1B; DEAF1, deformed epidermal autoregulatory factor 1; BMPR1A, bone morphogenetic protein receptor 1A; SMAD6, mothers against DPP homolog 6; TAPT1, transmembrane anterior posterior transformation 1; MEOX2, mesenchyme homeobox 2. Inset: Venn diagram of the protein orthologous clusters among the five hystricognath species: capybara (Hydrochoerus hydrochaeris), guinea pig (Cavia porcellus), degu (Octodon degus), chinchilla (Chinchilla lanigera), and naked mole rat (Heterocephalus glaber). Of the 12,878 orthologous groups shared by all five species, 4,452 were SCOs. (B) TreeMap from REVIGO for GO biological process terms present in the 39 genes evolving under positive selection in the capybara. Rectangle size reflects semantic uniqueness of GO term, which measures the degree to which the term is an outlier when compared semantically with the list of terms present in the mouse.
These 39 genes were enriched for 21 GOSlim categories, including growth, embryo development, cell population proliferation, and immune system process (fig. 3B shows specific GO biological processes terms). Additionally, fast-evolving genes in the capybara, among 8,084 SCOs shared by capybara–guinea pig–rat, were enriched for 36 GOSlim categories, including cell cycle, cell death, immune system process, mitotic cell cycle, and aging (Supplementary Material online). Lastly, besides codon-based models of evolution and protein distance methods, we identified conserved positions within protein alignments that uniquely change in the capybara as a proxy for changes in protein function (Jelier et al. 2011). Proteins with high proportion of unique-capybara residues were enriched for GO biological processes terms such as telomere maintenance (GO:0000723) and growth plate cartilage chondrocyte proliferation (GO:0003419; supplementary fig. S11).
Gene Family Expansions and Functional Composition of Capybara Genome
Gene family evolution, especially expansion by gene duplication, has been recognized as an important mechanism explaining morphological and physiological differences between species (Demuth et al. 2006). To characterize the repertoires of gene functions of rodent genomes, we employed a phenetic approach based on principal component analysis (PCA) that seeks to quantify and visualize the similarity in functional composition among species (see Materials and Methods). The PCA largely reflected phylogenetic relationships within Rodentia (fig. 4A), except for the capybara, which showed a clear signature of genome-wide functional expansion relative to the rest of rodents. To explore which gene families were driving this pattern, we performed an overrepresentation test to determine the gene families that dominated the loadings of each principal component. The main determinants of PC1 were the expansion of gene families related to sensory perception of smell, G-protein-coupled receptor signaling and immune response (fig. 4A). Further, based on a genome-wide screen of 14,825 gene families present in at least 15 of 16 genomes, we identified 39 families significantly expanded, and one family significantly contracted in the capybara (supplementary fig. S9).
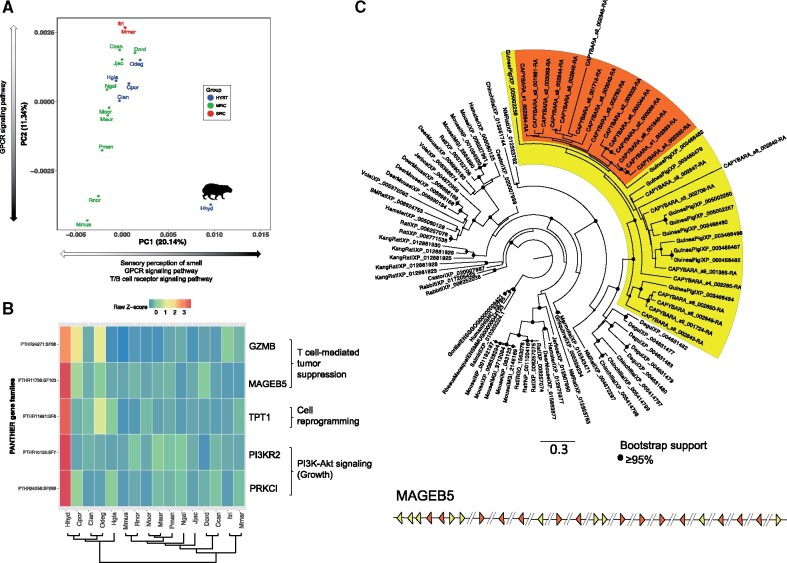
Gene family composition analysis. (A) Clustering of rodent genomes in a multidimensional space of molecular functions. The first two principal components are displayed, accounting for 20.14% and 11.34% of the variation, respectively. PC1 separates the capybara from the rest of the rodents based on the enrichment of gene families related to sensory perception and immune response. HYST, Hystricognathi clade; MRC, mouse-related clade; SRC, squirrel-related clade. Black portion of arrows indicates expansion of gene families within each PC. (B) Gene families related to growth control and tumor suppression that showed a significant expansion in the capybara (P-value < 0.05). The heatmap shows normalized gene counts of PANTHER molecular function categories for the 16 rodents. (C) Maximum likelihood phylogenetic tree of MAGEB5 gene family of capybara (24 MAGEB5 members) compared with rodents and rabbit, plus primate outgroups (human, gorilla, rhesus macaque, and squirrel monkey). The yellow clade contains capybara and guinea pig members, whereas the orange clade shows a monophyletic expansion of MAGEB5 genes in capybara. Bottom: Schematic representation of the organization of MAGEB5 copies throughout the capybara genome. Triangles represent position and transcriptional direction of each copy (colors match clades on phylogeny), and the “//” represent different scaffolds. Hhyd, Hydrochoerus hydrochaeris (capybara); Cpor, Cavia porcellus (guinea pig); Clan, Chinchilla lanigera (chinchilla); Odeg, Octodon degus (degu); Hgla, Heterocephalus glaber (naked mole rat); Mmus, Mus musculus (mouse); Rnor, Rattus norvegicus (rat); Mocr, Microtus ochrogaster (vole); Maur, Mesocricetus auratus (hamster); Pman, Peromyscus maniculatus (deer mouse); Ngal, Nannospalax galili (blind mole rat); Jjac, Jaculus jaculus (jerboa); Dord, Dipodomys ordii (kangaroo rat); Ccan, Castor canadensis (beaver); Itri, Ictidomys tridecemlineatus (squirrel); Mmar, Marmota marmota (marmot).
Evolution of Developmental Regulators of Growth and Size
Our comparative genomic results pointed to a number of genes and gene families within the insulin/insulin-like growth factor signaling (IIS) and transforming growth factor-β signaling (TGFβS) pathways exhibiting signatures of either accelerated evolution and positive selection, or gene family expansion in the capybara (figs. 3, 4B, 4C, and 5). The IIS pathway is implicated in embryonic and postnatal growth via cell proliferation (Baker et al. 1993). For instance, LEP (leptin; ω > 1 in pairwise comparison against guinea pig; Supplementary Material online) is an important growth factor that regulates body weight and bone mass through the IIS pathway (Margetic et al. 2002). PLAGL2 (Pleiomorphic adenoma-like Protein 2;fig. 3A) is a member of the PLAG family of zinc finger transcription factors, which drives the expression of the insulin-like growth factor II (igf2) activating the igf2-mitogenic signaling pathway (Hensen et al. 2002), and disruption can result in decreased body weight and postnatal growth retardation in mice (Hensen et al. 2004; Blake et al. 2017). IGF-II provides a constitutive drive for fetal and postnatal growth (Fowden 2003) and it has been shown that IGF-II levels do not drop after birth in caviomorph rodents, but instead remain detectable in adulthood (Levinovitz et al. 1992). PI3K signaling is implicated in cell proliferation, growth, and survival via the IIS and mTOR signaling pathways (Laplante and Sabatini 2012). PI3KR2 (Phosphatidylinositol 3-kinase Regulatory subunit β; fig. 4B) has been shown to have both oncogenetic (Ito et al. 2014) and tumor suppressor properties (Taniguchi et al. 2010), and PRKCI (atypical protein kinase C isoform PRKC iota; fig. 4B) functions downstream of PI3K and is involved in cell survival, differentiation, and proliferation by accelerating G1/S transition (Ni et al. 2016). PDX1 (Pancreatic and duodenal homeobox 1; accelerated evolution relative to rat and guinea pig—see Supplementary Material online) is an important transcription factor that is crucial for establishing and maintaining the functional identity of insulin-producing β-cells (Gao et al. 2014), and in adult β-cells it regulates insulin gene transcription (Pagliuca and Melton 2013), an important growth factor in caviomorphs (King and Kahn 1981).
The TGFβS pathway is crucial for regulation of cell growth, differentiation and development (Wu and Hill 2009), and TGFβ/BMP-activated Smads are critical for the formation of the skeleton during development (Chen et al. 2012). We found several genes within this pathway to exhibit signatures of positive selection (fig. 3A). For instance, SMAD6 (mothers against DPP homolog 6) is an important inhibitor of BMP-mediated effects on chondrocytes and is involved in endochondral bone formation in axial and appendicular skeletal development (Estrada et al. 2011; Chen et al. 2012). ACVR1B (activin receptor type 1B) and BMPR1A (bone morphogenetic protein receptor type 1A) are essential in endochondral bone formation, promoting proliferation and differentiation of chondrocytes and osteoblasts through BMP signaling especially during postnatal bone development (Lin et al. 2016). TAPT1 (transmembrane anterior posterior transformation 1) and DEAF1 (deformed epidermal autoregulatory factor 1) are required for vertebrate axial skeletal patterning during development through the regulation of Hox genes expression and activity (Howell et al. 2007; Casaca et al. 2014). Further, MEOX2 is essential in axial skeletal and limb muscular development (Mankoo et al. 2003), and interestingly, OSR1 is expressed in the interdigital regions of limb buds (So and Danielian 1999) suggesting a role in the formation of semi-webbed feet in the capybara. Additionally, postnatal skeletal duration of growth is controlled by the IIS pathway by maintaining an active population of chondrocytes in the growth plate, where IGF-II is essential for longitudinal and appositional postnatal bone growth in rodents (Uchimura et al. 2017). Overall, these results suggest that along with the growth-related effects of caviomorph insulin (King and Kahn 1981; Opazo et al. 2005), lineage-specific shifts in cell proliferation, especially in relation to postnatal bone growth, as well as axial skeletal and limb musculoskeletal development may have been crucial for allowing the evolution of a giant body size.
Growth Pathways Are Enriched in Cancer Pathways
Cancer places a major constraint on the evolution of large bodies. How can giants evolve, or even exist, if size is regulated through somatic growth and cancer appears through somatic evolution (Conlon and Raff 1999; Crespi and Summers 2005)? To investigate the relationship between growth and cancer during the evolution of a giant body size in the capybara, we used the genes that showed lineage-specific positive selection and rapid evolution, high concentration of unique-capybara residues, and capybara-expanded gene families (see above and Supplementary Material online) to perform a network analysis of 90 interacting genes using String Database (Mering et al. 2003). Network analyses based on GO biological process terms revealed seven functional clusters among the 90 genes including immunity, regulation of cell proliferation, cell communication and adhesion, metabolism and homeostasis, mitochondrion organization and metabolism, neuronal development, and ribosome maturation (fig. 6A).
We extracted 22 genes deeply involved in growth regulation by the IIS/TGFβS pathways, and the T-cell-mediated immunity pathway to explore in more detail the interaction between growth and potential cancer suppression mechanisms (fig. 6B). Remarkably, we found that this smaller network has an enrichment of cancer pathways such as prostate cancer (hsa05215), breast cancer (hsa05224), pathways in cancer (hsa05200), and transcriptional misregulation in cancer (hsa05202), consistent with the roles of IIS and TGFβS pathways in cell proliferation, growth, and survival in solid tumors (Yuan and Cantley 2008; Wu and Hill 2009). For instance, INS1, PI3KR2, PLAGL2, LEP, and SMAD6 have been reported as not only growth factors, promoting somatic evolution, but also oncogenes, enabling tumor progression (fig. 6B). LEP promotes angiogenesis through VEGF signaling and acts as an autocrine factor in cancer cells promoting proliferation and inhibition of apoptosis (Andò and Catalano 2012). PLAGL2 contributes to cancer by generating loss of cell–cell contact inhibition, maintaining an immature differentiation state in glioblastomas, and inducing proliferation of hematopoietic progenitors in leukemia (Hensen et al. 2002; Zheng et al. 2010; Landrette et al. 2011). PI3K signaling nodes are some of the most common altered targets in solid tumors (Yuan and Cantley 2008). Lastly, SMAD6 potentiates invasion and aggressiveness of cells in breast cancer (De Boeck et al. 2016). These observations suggest that some cancers could arise as a by-product of growth regulatory evolution.
Evolution of a Putative Cancer Resistance Pathway
In rodents, cancer incidence has been reported to be 46% in a wild-caught population of Mus musculus raised in the laboratory (Andervont and Dunn 1962), and 14.4–30% in guinea pigs older than 3 years (Jelínek 2003). If the capybara’s large body size is caused by an increase in cell proliferation, this could potentially lead to an increased risk of cancer. However, in capybaras, only three cases of cancer have been reported to date (Stoffregen et al. 1993; Hamano et al. 2014; Srivorakul et al. 2017), suggesting the possibility of a lower incidence of cancer in capybara relative to other rodents. If so, this pattern would be consistent with empiric analyses of Peto’s Paradox (Abegglen et al. 2015). Thus, we searched for genes and gene families related to cancer resistance in the capybara.
Consistent with previous studies suggesting that telomere shortening coevolves with body mass in rodents (Gorbunova and Seluanov 2009), our analyses of positive selection and unique-capybara residues identified genes involved in cellular senescence (fig. 3B) and telomere maintenance, such as TERF2IP (telomeric repeat-binding factor 2-interacting protein 1) which regulates telomere length in mammals (supplementary fig. S11). Additionally, we found three gene families significantly expanded in the capybara relative to other rodents related to tumor reversion and cancer suppression by the immune system (fig. 4B and C; supplementary fig. S10), namely TPT1 (tumor protein, translationally-controlled 1), MAGEB5 (melanoma antigen family B5), and GZMB (granzyme B). TPT1 has a major role in phenotypic reprogramming of cells, inducing cell proliferation and growth via the mTOR signaling pathway, and plays a role in tumor reversion where cancer cells lose their malignant phenotype (Amson et al. 2013). Type I MAGE genes (e.g., MAGEB5) are expressed in highly proliferating cells such as placenta, tumors, and germ-line cells (van der Bruggen et al. 1991). In normal somatic tissues these genes are deactivated but when cells become neoplastic, MAGE genes are reactivated and the resultant proteins may be recognized by cytotoxic T lymphocytes, triggering a T-cell-mediated tumor suppression response (van der Bruggen et al. 1991). Lastly, GZMB is an important component of the perforin/granzyme-mediated cell-killing response of cytotoxic T lymphocytes via caspase-dependent apoptosis (Russell and Ley 2002). The fact that the capybara displays functional expansion in the T-cell receptor signaling pathway (fig. 4A), and expansion of MAGEB5 and GZMB gene families, suggests that T-cell-mediated tumor suppression response may be a lineage-specific response to reduce the increased cancer risk related to the evolution of a giant body size (supplementary fig. S12).
Discussion
Despite intrinsic constraints on the evolution of large bodies, mammalian species in multiple lineages have achieved dramatic body size changes through accelerated rates of phenotypic evolution (McNeill Alexander 1998; Baker et al. 2015). The evolution of gigantism can therefore shed light on how biological systems can break underlying constraints, and mitigate or overcome the evolutionary effects of tradeoffs on whole-organism performance and survival (Kavanagh 2003; Lailvaux and Husak 2014). The genome of the capybara, the world’s largest rodent, is therefore crucial to addressing these questions. Our analyses revealed insights into the capybara’s particular morphology, offering the first genomic view of the developmental regulators likely associated with the evolution of a large body size (fig. 5). We identified several genes (and gene families) under positive selection (and expanded) belonging to the IIS and TGFβS pathways, involved in cell proliferation, postnatal bone growth, and the development of musculoskeletal structures, which are relevant to the anatomical and developmental modifications required for an increase in overall body size. Our results suggest that gigantism in the capybara could have been driven by a prolonged or faster postnatal bone growth period, providing a possible case of size increase driven by heterochrony consistent with observations in other giant species (e.g., Erickson et al. 2004). Moreover, the IIS pathway has also been linked to rapid and extreme body size evolution in the sunfish (Mola mola), the world’s largest extant bony fish (Pan et al. 2016), and to extreme size differences in dog breeds (Sutter et al. 2007), which could suggest a common genetic and developmental pathway controlling rapid body size evolution through cell proliferation in vertebrates.
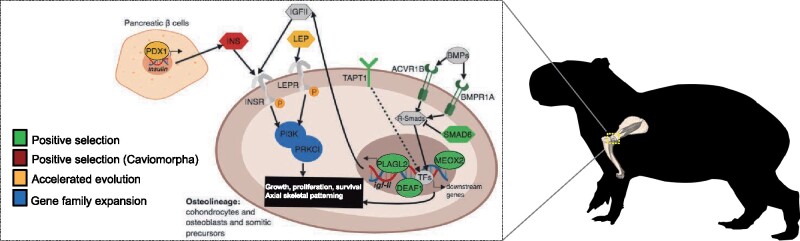
Signaling pathways and mechanisms involved in body size and growth. IIS: PDX1, INS, LEP, IGFII, INSR, LEPR, PI3K, PRKCI, and PLAGL2; TGFβS: BMPs, ACVR1B, BMPR1A, SMAD6, and R-Smads. TAPT1, MEOX2, and DEAF1 function during axial skeletal patterning. Solid arrows indicate known and/or direct interactions; dashed arrows indicate unknown direct/indirect interaction. Figure is designed in BioRender.
Because there is no genome assembly yet available for rock cavies (Kerodon sp.), the closest living relatives to the capybara (supplementary fig. S5; together comprising the subfamily Hydrochoerinae), one caveat of our analysis is that we cannot identify changes specific to the capybara lineage after splitting from Kerodon. Therefore, the genetic changes identified here could correspond to a recent common ancestor of both hydrochoerine genera, but we note that capybaras are still 60 times more massive than rock cavies, and rock cavies are similar in size to guinea pigs. Future comparative analyses including a genome from at least one of the two living species of rock cavies would help further narrow the changes specific to the capybara lineage. Additionally, we note that some studies have shown that genomic scans of positive selection based on branch-site tests and GO enrichment have the potential to be misleading (e.g., Pavlidis et al. 2012; Venkat et al. 2018); however, several genes we identified show aberrant phenotypes in mutant mice related to embryo size, postnatal growth, axial skeletal patterning, and/or limb development according to the Mouse Genome Informatics (MGI) database (http://www.informatics.jax.org, last accessed October 5, 2020). Our results aim to identify potentially interesting candidate genes that could be further experimentally evaluated.
We also found genomic signatures related to the collateral effects of evolving a large body size. For instance, our analyses suggest that the capybara has a lower genome-wide synonymous substitution rate (dS), relative to the median value for the entire Rodentia clade, consistent with a GTE. Also, the capybara has a genome-wide nonsynonymous substitution rate similar to the average for the clade, suggesting an elevated number of fixed slightly deleterious mutations relative to the mutational input (assuming dS as a surrogate for the mutation rate). These results appear to be consistent with the negative correlation between generation time and population size (Chao and Carr 1993), and the accumulation of slightly deleterious mutations caused by a reduction in Ne (Lynch and Gabriel 1990; Lohr and Haag 2015). We must caution, however, that ω values can be overestimated if polymorphic sites are counted as divergence when only one sequence per species is used to compute the substitution rates (Bierne and Eyre-Walker 2004). Thus, future analyses would require explicit population data to better address the evolutionary consequences of a large body size on genome evolution and mutation load.
Finally, cancer imposes a strong constraint on morphological and ontogenetic evolution (Kavanagh 2003), particularly during the evolution of gigantism. The dual nature of growth factors can create a scenario for an intragenomic conflict in large-sized organisms, where somatic evolution leading to gigantism may promote tumorigenic cells (Summers et al. 2002; Wang et al. 2019). Cancers are selfish cell lineages that evolve through somatic mutation and cell-lineage selection (Burt and Trivers 2006). Thus, selection for large body size achieved through greater cell proliferation can favor mutations that also confer cellular autonomy in growth signals enhancing their own probability of replication and transmission, a hallmark of cancer (Hanahan and Weinberg 2000; Summers et al. 2002); in fact, within species the risk of cancer scales positively with body size (Tjalma 1966; Fraumeni 1967; Caulin and Maley 2011). In line with this, our comparative genomic results revealed that the evolution of a giant body size along the hydrochoerine lineage likely involved selection on genes and pathways that are directly linked to cancer (fig. 6B), consistent also with recent findings showing that the development of fast-growing antlers in ruminants involve the expression of genes related to bone cancer (Wang et al. 2019). We hypothesize that the opportunity for selfish cell lineages to arise, incidental to selection for cell proliferation, imposes a selection pressure for cancer surveillance mechanisms, generating a coupled evolution between growth-promoting and tumor-suppression pathways, a plausible underlying process causing Peto’s Paradox and a possible explanation for how giant bodies can evolve in the first place (see also Wang et al. 2019). Therefore, based on our analyses, we propose a model for the evolution of gigantism in the capybara, and the resolution of the conflict: somatic evolution promoted by the IIS and TGFβS pathways through cell proliferation allowed a phyletic increase in size, and the evolution of T-cell-mediated tumor suppression pathway evolved as a mechanism to counteract the increased cancer risk. Future research would be required to functionally confirm these hypotheses.
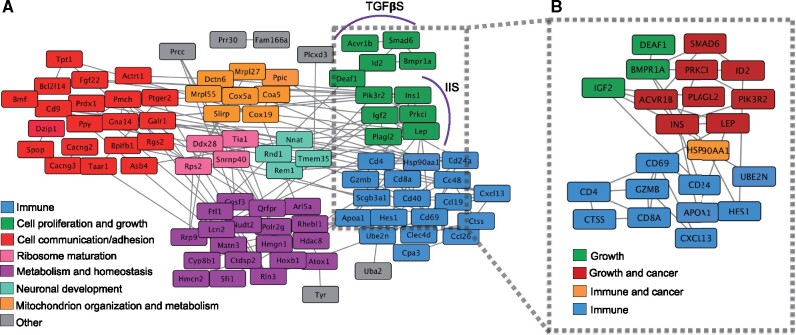
Growth pathways are directly linked to cancer pathways. (A) Gene interaction network of capybara genes. Molecular interactions among 90 genes identified by the intersection of four criteria: lineage-specific family expansions, positive selection, rapid protein evolution, and unique amino acid substitutions at sites otherwise fixed in rodents. Cluster analysis was based on Gene Ontology categories. (B) Intragenomic conflict during the evolution of gigantism. Molecular interactions among 22 major genes involved in growth regulation by the IIS and TGFβS pathways, and T-cell-mediated immune response. Eight of the 11 genes within the growth regulating pathways act also as oncogenes and are involved in known cancer pathways.
Materials and Methods
Ethics Statement
All procedures involving live animals followed protocols approved by the Comité Institucional de Uso y Cuidado de Animales de Laboratorio (CICUAL) of the Universidad de los Andes, approval number C.FUA_14-023, June 5, 2014. Research and field collection of samples was authorized by the Autoridad Nacional de Licencias Ambientales (ANLA) de Colombia under the permiso marco resolución No. 1177 to the Universidad de los Andes.
Capybara Genome Sequencing and Assembly
As part of the 200 Mammalian Genomes project, the SciLifeLab at Uppsala University and the Broad Institute sequenced and assembled a DISCOVAR de novo genome assembly (Weisenfeld et al. 2014) from a sample of a wild-born female H. hydrochaeris from the San Diego Zoo’s Frozen Zoo (frozen sample KB10393), imported from Paraguay. The genome assembly was performed with the DISCOVAR de novo pipeline, generating an assembly spanning 2.734 Gb with a scaffold N50 length of 0.202 Mb (table 1).
The Dovetail Genomics proprietary scaffolding method based on Chicago libraries (Putnam et al. 2016) was used to upgrade the initial DISCOVAR assembly. Dovetail’s novel approach to increasing the contiguity of genome assemblies combines initial short-read assemblies with long-range information generated by in vitro proximity ligation of DNA in chromatin. From the same individual of H. hydrochaeris used to obtain the initial DISCOVAR de novo assembly, 500 ng of high molecular weight gDNA (50 kb mean fragment size) was used as input for the Chicago libraries. The libraries were sequenced on two lanes of an Illumina HiSeq in Rapid Run Mode to produce 316 million 2 × 100 bp paired-end reads, which provided 67× physical coverage (measured in bins of 1–50 kb).
The reads were assembled by Dovetail Genomics using the HiRise Scaffolder pipeline and the DISCOVAR de novo genome assembly as inputs. Shotgun and Chicago library sequences were aligned to the draft input assembly using a modified SNAP read mapper (http://snap.cs.berkeley.edu) to generate an assembly spanning 2.737 Gb, with a contig N50 length of 161.1 kb and an impressive scaffold N50 length of 12.2 Mb, as calculated using the QUAST software (Gurevich et al. 2013).
Assembly Quality and Annotation
Two approaches were employed to evaluate the quality of the assembly: 1) The Core Eukaryotic Genes Mapping Approach (Parra et al. 2007) was used to determine the number of complete core eukaryotic genes recovered, and 2) an analysis of BUSCOs (Simão et al. 2015) was applied as an evolutionary measure of genome completeness, using the vertebrate data set (3,023 genes) as query. Gene content of a well-assembled genome should include a high proportion (≥75%) of both core eukaryotic genes and BUSCOs (supplementary fig. S1, Supplementary Material online).
Putative genes were located in the assembly by homology-based annotation with MAKER v2.31.9 (Cantarel et al. 2007) based on protein evidence from mouse (Mus musculus), rat (Rattus norvegicus), and guinea pig (Cavia porcellus; Ensembl release 85). CD-HIT v4.6.1 (Li et al. 2001) was used to cluster highly homologous protein sequences across the three protein sets and generate a nonredundant protein database (nrPD), which was used to guide gene predictions on the capybara genome. To evaluate the quality of the annotations, the AED score was used as a measure of congruence between each annotation and the homology-based evidence (in this case, protein sequences). When an annotation perfectly matches the overlapping model protein, the AED value is 0 (Yandell and Ence 2012). As a rule of thumb, a genome annotation where 90% of the annotations have an AED less than 0.5 is considered well annotated (Campbell et al. 2014). The capybara genome annotation has 92.5% of its annotations with an AED below 0.5.
PANTHER (Thomas et al. 2003) was used to characterize the functions of the capybara-annotated proteins (supplementary fig. S2, Supplementary Material online). PANTHER is a library of protein families and subfamilies that uses the GO database to assign function to proteins. Following the protocol for large-scale gene function analysis with PANTHER (Mi et al. 2013), the Scoring Tool was used to assign each protein of the capybara genome to a specific protein family (and subfamily) based on a library of hidden Markov models.
Annotation of Repeat Elements
RepeatMasker open-4.0.5 (Smit et al. 2013) was used to identify and classify transposable elements and short tandem repeats by aligning the capybara genome sequences against a reference library of known repeats for rodents, using default parameters. For comparison, NCBI annotation releases for 13 additional rodents were used (fig. 1).
Analysis of Substitution Rate Variation among Rodent Genomes
In order to estimate the mutation load, we used the ratio of the rates of nonsynonymous substitutions over synonymous substitutions (dN/dS or ω) as a proxy. A set of 229 SCOs shared across the 16 rodent genomes (supplementary table S3, Supplementary Material online) was recovered with the software Proteinortho (Lechner et al. 2011). Values of ω were estimated for the set of 229 SCOs, using the program CODEML from the PAML package v4.8 (Yang 2007). Two evolutionary models were evaluated: model 0 with ω held constant over the time-calibrated concatenated likelihood tree, and model 1 with free ω estimated separately for each branch. Likelihood-ratio tests were used to compare the two models, and in each case the model 1 was the preferred one. Only ω values associated with external branches were used as measures of mutation load. Codon-based alignments were performed with MACSE (Ranwez et al. 2011) with default parameters and poorly aligned regions were trimmed with Gblocks v. 0.91 b (Talavera and Castresana 2007). To determine whether the capybara has a higher genome-wide median ω relative to other rodents, a permutation test (1,000 permutations) on each substitution rate (dN, dS, ω) was performed to create a null distribution of the differences of (median capybara − median rodents), and then compared with the observed values.
The correlations between median genome-wide ω versus body mass (and generation time) were evaluated using phylogenetic independent contrasts (Felsenstein 1985) to control for the potentially confounding effects of shared evolutionary history. Values of adult body mass and generation time were obtained from AnAge database (Tacutu et al. 2012). Because for most mammalian species comparable genetic estimates of nuclear Ne were not available, we used body mass as a proxy for Ne. Median genome-wide ω values per species and natural log-transformed values of body mass were used to estimate the impact of the reduction of effective population size on the strength of purifying selection. Assessment of linear model assumptions was performed with the gvlma R package (R Development Core Team 2011).
Gene Family Composition
To search for expanded gene families in the capybara, we performed gene family assignments for each of the 16 rodent genomes (supplementary table S3, Supplementary Material online) using the protocol for large-scale gene function analysis with PANTHER (Mi et al. 2013). Following Simakov et al. (2013), functional repertoires of the genomes were represented in a multidimensional space, where each dimension corresponds to a particular gene family. A PCA was conducted using the prcomp function in R (R Development Core Team 2011) on the count of the number of genes in each gene family as identified by PANTHER. The coordinate of a species’ genome along each dimension represents the number of genes that it contains with the corresponding gene family normalized by the total number of genes in that particular species. PCA based on content and size of gene families has been shown to reflect important evolutionary splits between groups or clades of animals (nonbilaterian and bilaterian: Simakov et al. 2013; deuterostomes and protostomes: Albertin et al. 2015). In rodents, PC1 component separated the capybara from all other rodent genomes and explained 20.14% of variance, whereas PC2 grouped all genomes and explained 11.34% of the variance. An overrepresentation test was conducted on the gene families that fell on both 2.5% tails of the loadings of PC1 and PC2 to determine the gene families that dominate the loadings of each principal component. A Fisher’s exact test was then performed iteratively in R (R Development Core Team 2013) on counts of each PANTHER gene family from the 5% tails of PC1 and PC2 against the complete set of gene families (23,110 families). To be defined as enriched, we assumed a significance level α = 0.05 for each gene family, before a traditional Bonferroni correction for multiple testing.
To conduct a genome-wide screen for gene family expansions, a table with 14,825 shared PANTHER gene families, present in at least 15 of the 16 genomes, was constructed with the counts for genes annotated to those families in the 16 rodent genomes (see above). A Fisher’s exact test was then performed iteratively in R (R Development Core Team 2011) comparing the number of genes found in the capybara in each gene family against the total number of genes in the remaining 15 rodents for a given gene family. To be defined as enriched, a gene family had to have a significant P-value (α < 0.05) after a traditional Bonferroni correction for multiple testing. We calculated a Z-score per gene family per species, where 1) the individual counts of each gene family per species were normalized by the total number of genes in the genome of each species and 2) the normalized counts were standardized within each gene family (across species) with the scale function in R (R Development Core Team 2011) and visualized as a heatmap (fig. 4B, supplementary fig. S8, Supplementary Material online). This Z-score represented the number of standard deviations below or above the mean gene family count for each species.
Positive Selection Analysis Using Codon-Based Models of Evolution
Amino acid sites within a protein may experience different selective pressures and have different underlying ω ratios (Yang and Bielawski 2000). We fitted branch-site models to identify positive selection in a set of 4,452 SCOs obtained using the OrthoVenn software (Wang et al. 2015) on capybara versus four closely related rodents with published whole-genome sequences: naked mole rat, degu, chinchilla, and guinea pig. Codon-based alignments were performed with MACSE (Ranwez et al. 2011) with default parameters and poorly aligned regions were trimmed with Gblocks v. 0.91b (Talavera and Castresana 2007). Downstream analyses of selective pressure variation were done using the Selection Analysis Preparation functions provided in VESPA v1.0β (Webb et al. 2016). We compared the likelihood scores of two branch-site selection models using likelihood-ratio tests as a measure of model fit: 1) model A implemented in CODEML in the PAML package v4.8 (Yang 2007), which attempts to detect positive selection acting on a few sites on specified lineages or “foreground branches” (ω > 1), versus the null model (A null) in which codons can only evolve neutrally (ω = 1) or under purifying selection (0 < ω < 1; Zhang et al. 2005); and 2) an adaptive branch-site random effects model (aBSREL) implemented in the HyPhy package (Smith et al. 2015) (see Supplementary Material online for the comparison between both models).
As maximum likelihood methods to detect positive selection are sensitive to sample size (Anisimova et al. 2002), increasing the possibility of false positives (Zhang 2004), we calculated a second measure of rapid evolution of each gene: ((Capybara, guinea pig), degu) protein trios were used to estimate the difference of the raw p-distance in protein sequence between capybara and degu (pdCD), and the raw p-distance between guinea pig and degu (pdGD). These two distances were used to calculate the “protein distance index” or PDI for each i gene (PDIi = pdCDi − pdGDi) which takes a value of zero if the two p-distances are equal, meaning that the capybara and guinea pig lineages have evolved at equal rates since their divergence from their MRCA. A standardized PDI was calculated by dividing the PDI value by the pdGD to account for different rates of evolution between proteins. A positive value is indicative of accelerated protein evolution in the capybara lineage. We considered genes in the top 5% of the distribution in both dimensions (i.e., the LRs of branch-site models and the standardized PDI statistic) as positively selected in the capybara lineage. LRs from both models (model A and aBSREL) were strongly correlated (Wilcoxon signed-rank test, W = 10,429,750, P-value < 0.001) and resulted in the same set of outlier genes when combined with the PDI statistic (supplementary fig. S13, Supplementary Material online) so only model A results from CODEML were used in further analyses.
For genes exhibiting signatures of lineage-specific positive selection, we conducted a GO enrichment analysis to identify GO categories overrepresented in these genes relative to the 4,452 SCO set. The GO categories for each gene were retrieved with the biomaRt R package (Durinck et al. 2009) using the protein stable IDs of guinea pig orthologs. A Fisher’s exact test was then performed iteratively in R (R Development Core Team 2011) on counts of each Biological Process from the positively selected genes against the full set of orthologs (4,452 genes). To be defined as enriched, a GO category had to have a significant P-value (α < 0.05) after a traditional Bonferroni correction for multiple testing. TreeMap of GO biological process terms that are overrepresented in genes evolving under positive selection in the capybara relative to the mouse was drawn using REVIGO (Supek et al. 2011).
Gene Interaction Network Analyses
We generated a list of 195 candidate genes that showed lineage-specific positive selection, pairwise ω > 1, rapid evolution (top 1%), high concentration of capybara-unique residues (top 5%), and gene-family expansions specific to the capybara. Insulin was included as part of the 195 gene set given that previous analyses showed signatures of adaptive evolution among Caviomorph rodents (Opazo et al. 2005). Of the 195 genes, only 90 genes presented known or predicted interactions with each other according to String Database (Mering et al. 2003). We used this new gene set to perform a network analysis of GO Biological Processes and KEGG pathways on the 90 interacting genes. Networks were constructed based on String DB interactions and plotted with Cytoscape 3.0 (Shannon et al. 2003). GO and KEGG enrichment analyses were performed based on String DB information with a false discovery rate of 0.05.
Supplementary Material
Supplementary data are available at Molecular Biology and Evolution online.
Acknowledgments
This work was supported by a Colciencias grant in Science, Technology & Innovation BIO number 1204-659-44334 (A.J.C.) and a seed grant from the Facultad de Ciencias, Universidad de los Andes (S.H.A., A.J.C.). Genome sequencing and assembly was supported by the 200 Mammals Project at the Broad Institute (NIH Grant 5R01HG008742-02) and Uppsala University (Swedish Research Council). Special thanks to Diane Genereux, Daniel Cadena, and Jeremy Johnson for insightful comments on the manuscript and to Roberto Márquez for support and advice. Eva Murén and Voichita Marinescu generated the sequencing libraries. Juanita Herrera and veterinarian Marlly Guarín helped in drafting and implementing animal care and use protocols. Thanks to IT Management and ExaCore of the Office of the Vice President for Research & Creation at the Universidad de Los Andes for high-performance computing services and technical assistance. Thanks to John Marío González of the Universidad de los Andes Medical School for access and help with flow cytometry. Collecting permits were provided by Colombia’s Autoridad Nacional de Licencias Ambientales (ANLA) to the Universidad de los Andes (Umbrella Permit No. 1177). We thank two anonymous reviewers for suggestions that improved the quality of the manuscript.
Author Contributions
A.J.C., E.K., and K.L.T. conceived genome-sequencing project. O.A.R. provided materials. E.K. and K.L.T. provided the DISCOVAR genome. A.J.C. provided financing. S.H.A. conceived the evolutionary questions addressed here, performed all evolutionary and statistical analyses, and wrote the draft manuscript with A.J.C. All authors revised and approved final version.
Data Availability
All data and statistical analyses that contributed to the results of the study are made publicly available. The genomic sequencing and assembly are available under the NCBI BioProject PRJNA399400; NCBI assembly accession number: PVLA00000000. The gene annotation, basic genome statistics, comparative genomic and phylogenetic analyses, tables with genes and gene families, and code used in this study are available at GitHub (https://github.com/santiagoha18/Capybara_gigantism).