 Heterozygous, Polyploid, Giant Bacterium, Achromatium, Possesses an Identical Functional Inventory Worldwide across Drastically Different Ecosystems
Molecular Biology and Evolution


- Altmetric
Achromatium is large, hyperpolyploid and the only known heterozygous bacterium. Single cells contain approximately 300 different chromosomes with allelic diversity far exceeding that typically harbored by single bacteria genera. Surveying all publicly available sediment sequence archives, we show that Achromatium is common worldwide, spanning temperature, salinity, pH, and depth ranges normally resulting in bacterial speciation. Although saline and freshwater Achromatium spp. appear phylogenetically separated, the genus Achromatium contains a globally identical, complete functional inventory regardless of habitat. Achromatium spp. cells from differing ecosystems (e.g., from freshwater to saline) are, unexpectedly, equally functionally equipped but differ in gene expression patterns by transcribing only relevant genes. We suggest that environmental adaptation occurs by increasing the copy number of relevant genes across the cell’s hundreds of chromosomes, without losing irrelevant ones, thus maintaining the ability to survive in any ecosystem type. The functional versatility of Achromatium and its genomic features reveal alternative genetic and evolutionary mechanisms, expanding our understanding of the role and evolution of polyploidy in bacteria while challenging the bacterial species concept and drivers of bacterial speciation.
Introduction
Bacteria are typically well adapted to their environment (Bleuven and Landry 2016) with different levels of tolerance to changes in ambient conditions (Häusler et al. 2014; Saarinen et al. 2018). Adaption to novel (micro)environments includes changing, removing, or incorporating new genes (Wiedenbeck and Cohan 2011; Hottes et al. 2013; Salcher et al. 2019). Such adjustments are then evolutionary stabilized in the population allowing those bacteria with increased fitness to proliferate (Tomatis et al. 2008; Milner et al. 2019).
Polyploid bacteria, defined as those harboring ten or more copies of their genomes, may be able to practice population-level experimental genomics within an individual cell, that is, experimenting with genomic modifications on some chromosomes while maintaining preestablished functionality on others (Mendell et al. 2008; Oliverio and Katz 2014; Markov and Kaznacheev 2016). Eventually, gene conversion (i.e., asymmetric recombination) stabilizes one allele, likely the one that provides increased fitness (Ludt and Soppa 2019). The clonality of genomes in polyploid bacteria has been rarely discussed. Although some results point toward minor differences (Mendell et al. 2008; Salman-Carvalho et al. 2016), some studies aiming at high-coverage assembly of polyploid bacteria suggest that other bacteria harbor nonidentical chromosomes (Winkel et al. 2016).
Genome comparison studies examining natural populations of single bacterial species revealed contrasting patterns regarding intrapopulation genomic variability. On the one hand, members of the Roseobacter clade, harboring multiple species, show little functional heterogeneity across different habitats likely due to acquisition of genes through lateral gene transfer (Newton et al. 2010). In contrast Prochlorococcus, the smallest but most abundant marine photoautotroph, forms populations consisting of hundreds of genomically different strains (Kashtan et al. 2014). Similarly, the most abundant oceanic heterotroph, Candidatus Pelagibacter sp. (SAR11) (Grote et al. 2012), and the abundant freshwater Actinobacteria of the AC-clade (Ghylin et al. 2014) form as well multiple genomic clades. Nevertheless, none of these population-wise heterogenous cells has intracellular allelic divergence as documented for the genus Achromatium (Ionescu et al. 2017).
Achromatium is a large sulfur-oxidizing bacterium that harbors calcium carbonate bodies in its periplasmatic space (Schorn et al. 2020). It is known mainly from freshwater sediments (Gray et al. 1999; Babenzien et al. 2015), but recently also from saline ones (Mansor et al. 2015; Salman et al. 2015), suggesting that it has a broad environmental distribution. In these sediments, Achromatium spp., occupy the top layer with most cells concentrated in the upper 2 cm at the oxic–anoxic interface (Gray et al. 1999). All known Achromatium cells are polyploid (Salman et al. 2015; Ionescu et al. 2017). Contradicting the definition of classical polyploidy, the multiple chromosomes of Achromatium are not identical (Ionescu et al. 2017) making it the first and as yet only heterozygous bacterium (Ludt and Soppa 2019). Additionally, individual cells of Achromatium harbor genomic diversity characteristic of entire communities (Ionescu et al. 2017). Several species have been named within the genus Achromatium, the freshwater A. oxaliferum (Schewiakoff 1897) and A. minus (Glöckner et al. 1999), and the marine Candidatus A. palustre (Salman et al. 2015). Amino acid and nucleotide identity analyses conducted on single-cell genomes of A. oxaliferum (Ionescu et al. 2017) place these cells outside of the single species boundary. Even more so when comparing Candidatus A. palustre with the three other saline single-cell genomes (Mansor et al. 2015). Last, an overall comparison of all published available genomes places all known Achromatium spp. on the lower boundary of the genus border. Accordingly, in absence of physiological characterization and as our molecular tools for species differentiation are challenged by the complex genomics of Achromatium, we will use in this study Achromatium spp. when discussing the assemblage of potentially different species in this genus, or merely Achromatium when referring to general traits of the genus.
In this study, we aimed to explore the possible eco-evolutionary advantages of extensive “heterozygosity” in members of the genus Achromatium. We used large-scale data mining, meta- and single-cell genomics, and metatranscriptomics to highlight the ubiquitous presence of Achromatium spp. in aquatic sediments without evident ecosystem-based functional differentiation. Subsequently, we present the metabolic potential of the universal Achromatium. With this study, we set up the foundations for future Achromatium-targeted studies that can enhance our data-mining-based results with on-site observations and genetic and physiological analyses.
Results
Sequences of the Achromatium small rRNA subunit (i.e., 16S rRNA gene) and of functional genes were mined from amplicon, metagenomic and metatranscriptomic raw-read libraries from sediments and a few soils sampled worldwide. These data show that Achromatium spp. are ubiquitously present in ecosystems that differ drastically in their physicochemical properties (fig. 1). This includes freshwater lakes, rivers, coastal and deep marine sediments as well as few terrestrial environments for which water presence is not reported.

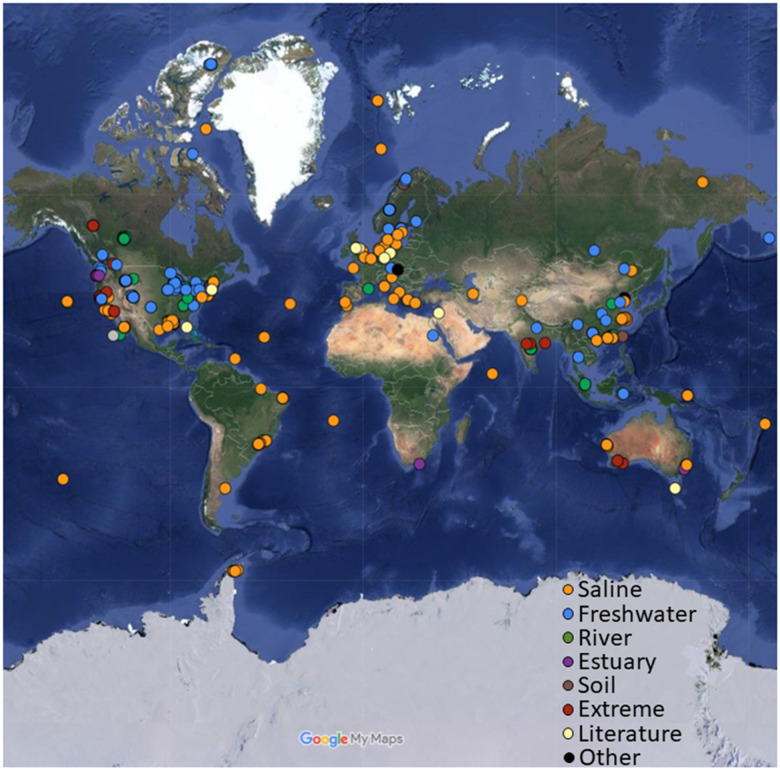
Achromatium spp. are globally present in sediments of inland and oceanic waters as well as in extreme environments, for example, hot springs, hypersaline lakes, the deep ocean, Arctic, and Antarctic ocean samples. The map was generated using manually curated sample metadata and the Google Maps website.
The upper and lower temperature, pH, salinity, and depth values for the ecosystems in which Achromatium spp. were detected (including all sequence libraries surveyed in this study) are detailed in table 1. These data highlight the ability of Achromatium spp. to withstand a wide range of temperatures, pH values, salinity levels, and hydrostatic pressures, though it is likely that in all these ecosystems it inhabits the sediment oxic–anoxic interphase niche.

| Lower Limit | Upper Limit | |
|---|---|---|
| Temperature | 2 °C obs |
42 °C 4 60 °C 2 (101 °C) |
| pH |
4.7 obs (4.2) 3.6 1 | 9.7 1(10.3) |
| Salinity | Freshwater obs | 45 g l−15 |
| Depth | 0 |
2,600 m 9 4,470 m 1 |
a For studies which give a range of values without specifications on the exact sampling site, the more “extreme” value is given in parentheses. Numbers in uppercase show the number of different sequence libraries supporting these data with “obs” referring to direct observation of Achromatium spp. cells.
We obtained 38,296 marine, 19,287 freshwater, 406 estuary 189 river, 104 extreme environments, and 37 soil 16S rRNA gene sequences classified as Achromatium. As these originated from different amplicon or meta-omics studies that did not cover the same region of the gene, we chose the V4 region for further phylogenetic analysis as this was the one with the highest global coverage. To test whether, as expected, different habitats bare a phylogenetic signal (Biller et al. 2015), the sequences, dereplicated per ecosystem type (i.e., marine, freshwater, estuary, river, soil, or extreme), were used to construct a phylogenetic tree (fig. 2 and supplementary fig. S1, Supplementary Material online). Sequences of Achromatium do not exhibit any broad environment-based pattern. Additionally, sequence clusters often consisted of sequences from distant environmental locations, though often of the same broad classification (i.e., freshwater or saline). The presence of ecotypes (Koeppel et al. 2008) was tested on 857 V4 region sequences using the Ecotype Simulation 2 software (V 2.14) (Wood et al. 2020) resulting in a possible 550 ecotypes, of these 378 were singletons. Out of the remaining 172 ecotypes, 76 consisted of sequences from distant environments (i.e., not the same library or study). Nevertheless, mixed freshwater/saline ecotypes as well as clusters in the phylogenetic tree exist but are not common. The complete tree of the 857 sequences used by the Ecotype Simulation 2 software is shown, due to its size, as supplementary data set 1, Supplementary Material online.
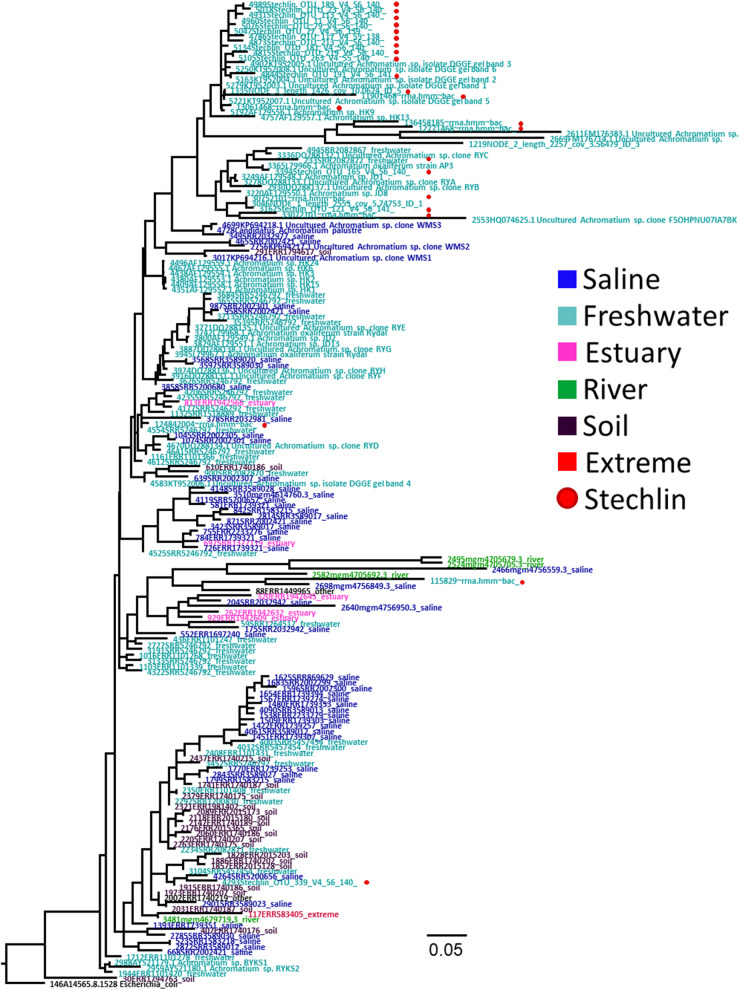
A phylogenetic tree constructed from the V4 region of 184 Achromatium spp. 16S rRNA gene sequences recovered from raw amplicon, metagenome and -transcriptome sequence data deposited in various sequence archives, alongside reference sequences. To reduce the size of the tree, 50 marine and 50 freshwater sequences were randomly chosen out of a larger data set (see supplementary table S1, Supplementary Material online). A similar tree of the V9 region is shown in supplementary figure S1, Supplementary Material online, and the full V4 tree without dereplication or subselection of sequences is shown in supplementary data set 1, Supplementary Material online. The latter was also used by the Ecotype Simulation 2 software in search of Achromatium ecotypes.
Ribosomal RNA genes, though commonly used for phylogeny and ecotype demarcation, do not always harbor sufficient information and therefore may be misleading (Biller et al. 2015). Accordingly, we further inspected six protein genes (fig. 3) of which three are typically regarded as single copy markers and three occur in multiple copies in the published genomes of Achromatium spp. Each protein was inspected separately as Achromatium was not the main target of the mined studies and it was not always possible to retrieve all protein sequences from the raw-read libraries. Furthermore, as single cells of Achromatium spp. contain multiple different copies of each gene (Ionescu et al. 2017), analysis of concatenated protein sequences is impossible as the number of possible combinations to be compared is too large.
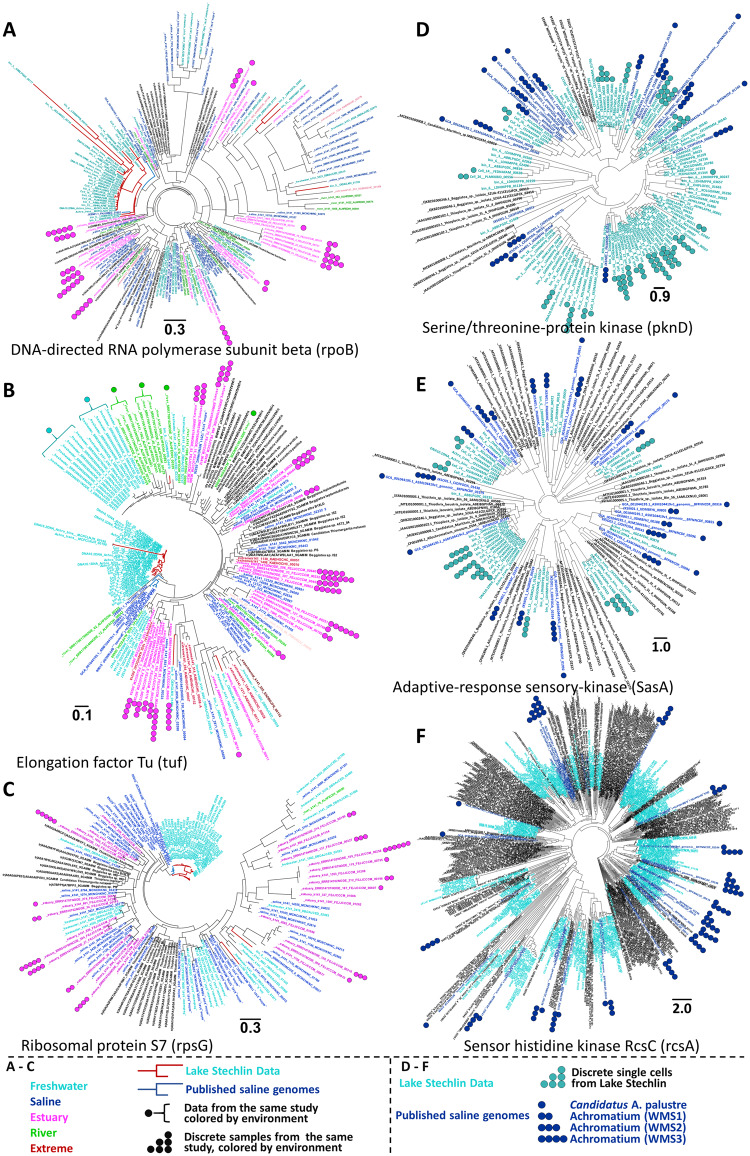
Maximum likelihood trees calculated from the amino acid sequences of six different marker proteins. The protein sequences used in panels A–C are known as typical single copy marker genes. The protein sequences used in panels D–F occur in multiple copies in the published genomes of confirmed saline and freshwater Achromatium. The sequence labels are colored by their general environment with black labels indicating the non-Achromatium Thiotrichaceae. In panels A–C, the branches of known freshwater and saline Achromatium are colored red and blue, respectively. The symbols next to the protein names indicate different protein sequences obtained from the same discrete library (A–C) or from the same single cell (D–F). Identical sources are marked by an identical number of symbols and the symbols are color coded according to the environment. In panel F, freshwater single cells were not marked due to the large number of sequences and the tree density; however, sequences from the same individual cells occur across the tree. Sequences obtained from metagenomic assembly or sequences pooled by environments, are not marked by symbols.
Trees of three proteins, typically regarded as single copy markers (i.e., DNA-directed RNA polymerase subunit beta [RpoB], elongation factor TU [Tuf], and ribosomal protein S7 [Rps7]; fig. 3A–C), partially indicate the existence of ecotypes. In fact, in all three cases most sequences from Lake Stechlin cluster together and, as evident in figure 3B, several sequences of elongation factor TU from discrete freshwater and river studies (see figure caption and Materials and Methods) form distinct clusters. Unlike the data recruited from raw libraries, the sequences obtained from confirmed Achromatium are long, resulting in the close clustering of known saline and freshwater Achromatium. In contrast, estuarine sequences are spread throughout the trees despite being obtained from the same study and same sample. Although clusters of saline sequences are observed through the trees (fig. 3A–C), these were obtained from a pooled assembly of all saline sequence (see Materials and Methods) hence their origin cannot be confirmed.
To further inspect the separation between the saline and freshwater Achromatium, we sought proteins which occur in multiple copies in all the available annotated genomes of confirmed Achromatium spp. Accordingly, three proteins were chosen (fig. 3D–F): serine/threonine protein kinase (PknD), adaptive response sensory kinase (SasA), and sensor histidine kinase (RcsC), all of which could be compared in full or near-full length, though only from published data as they could not be assembled from the sequences mined in this study. The latter proteins highlight the broad diversity of protein sequences of the published freshwater single Achromatium cells (Ionescu et al. 2017), those of the saline Candidatus A. palustre (Salman et al. 2016) and the saline Warm Mineral Springs cells WMS1-3 (Mansor et al. 2015). Remarkably, saline and freshwater sequences form in most cases distinct clusters, despite the broad, rather uniform, distribution of sequences from the different sources across the three different protein trees.
Though our analysis shows that Achromatium spp. are present in diverse ecosystems around the globe, the data recruited on Achromatium spp. from extreme environments are scarce. However, the availability of many freshwater and marine sediment metagenomes and metatranscriptomes permits us to conduct a more in-depth examination of Achromatium on both sides of the salinity barrier.
Proteomic adaptation to salinity is typically reflected in the isoelectric point of proteins (Oren 2013). As such, the distribution of calculated isoelectric points for proteins of a freshwater bacterium tends toward alkaline pH whereas that of marine or halophilic organisms tends toward acidic pH (for a thorough comparison see Cabello-Yeves and Rodriguez-Valera 2019). Such clear separations are obvious, for example, for some members of the Pelagibacteraceae (fig. 4A, full lines). Though not all proteomes in this family have a clear-cut separation (fig. 4A dashed lines), those from marine origin clearly have more acidic proteins than those from freshwater. Other phylogenetically closely related organisms (i.e., same genus) such as Synechococcus or members of the family Beggiatoaceae show less pronounced differences, yet, are generally more inclined toward acidic proteomes (supplementary fig. S2, Supplementary Material online). In contrast, our comparison of all known genomes of Achromatium spp. from freshwater and saline (marine) ecosystems reveals neither major differences between the calculated acidity of their proteomes nor a strong inclination toward acidic proteomes (fig. 4B). Though the proteomes of marine Achromatium spp. have a lower percentage of basic proteins as compared with freshwater ones, the peak of the acidic isoelectric point of freshwater Achromatium spp. is shifted toward a lower pH (fig. 4B). Expanding the latter analysis to all Achromatium data recruited from freshwater, saline, and intermediate (estuaries) ecosystems reflects the same phenomenon where no clear proteomic adaptation is observed with data from estuaries having a lower percentage of basic proteins (fig. 4C). Interestingly, all Achromatium data show a high number of proteins with a neutral isoelectric point (fig. 4B and C).
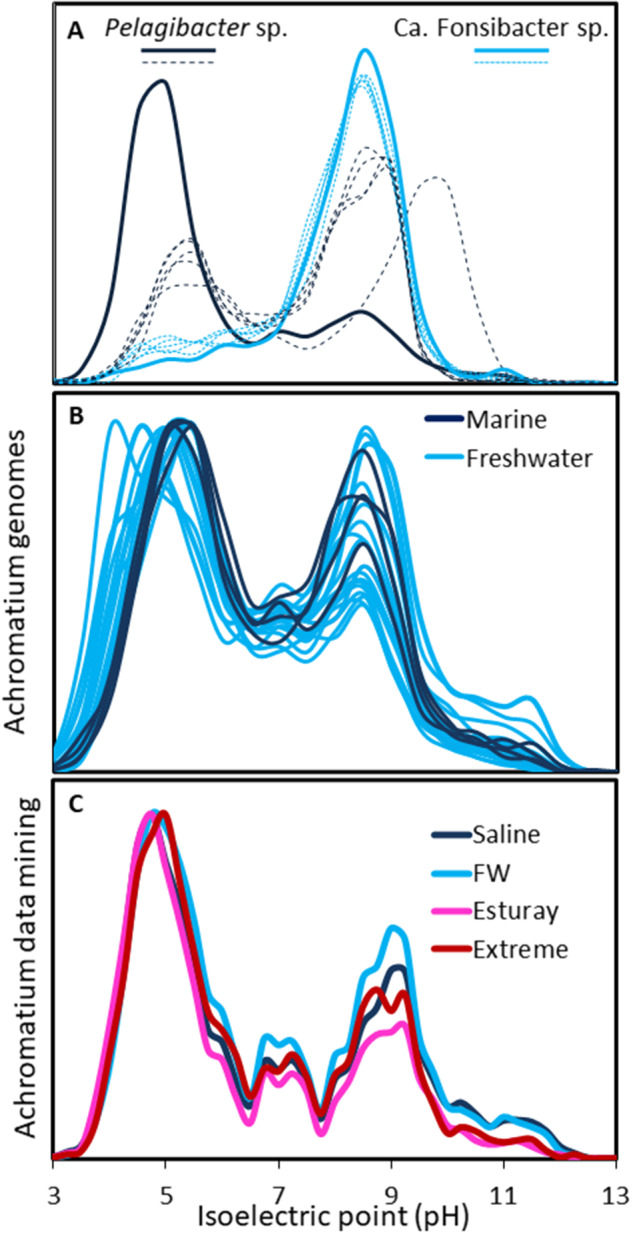
Isoelectric point histograms of Pelagibacteraceae species from marine and freshwater ecosystems (A), the published freshwater and marine Achromatium spp. genomes (B), and functionally recruited Achromatium data from metagenome and metatranscriptomic data (C). The proteomes shown in panel A are from the following genomes: GCA_009693745.1, GCA_009922365.1, GCA_009921875.1, GCA_012064375.1, GCA_012064425, GCA_000238815.2, GCA_001321855.1, GCA_000012345.1, GCA_000372905, GCA_002101295, GCA_012276695.
Using the published genomic data from freshwater and marine Achromatium spp., we compared the metabolic functions of the two, typically evolutionary separated, ecosystems (supplementary fig. S3, supplementary data set 2, Supplementary Material online). This comparison suggests that genomes from each ecosystem harbor several unique functions though most functions overlap between freshwater and marine Achromatium genomes. Nevertheless, the available genomic information is very limited, with a strong bias toward freshwater from where numerous existing single-cell partial genomes and metagenomes (Ionescu et al. 2017) exist, although from one single environment. In contrast, data from the marine ecosystems consist of only four partial single-cell genomes (Mansor et al. 2015; Salman et al. 2016). Therefore, we used the entire available genomic data to recruit gene sequences of Achromatium spp. from publicly available metagenomes and metatranscriptomes. Sequences for which a probability of 70% or higher that the mapping to a known Achromatium sequence is correct were kept for further analysis. Given that average amino acid identity between Achromatium spp. from the same and different environments is as low as 65% and 55%, respectively (Ionescu et al. 2017), a match probability of 70% and higher is to be considered a high confidence match. Nevertheless, the per-gene average and median match probabilities of the high-quality matches (i.e., those above 70%) were 95% and 96%, respectively (see supplementary fig. S4, Supplementary Material online, for data distribution). Functional genes of Achromatium spp. were obtained from 704 sediment metagenomic studies. Ecosystem-type-based comparison (saline vs. freshwater) of functions indicates that none of the functions is unique to either of the two types (fig. 5). Clustering of the samples is a result of both coverage and environment with the former explaining approximately 28% of the variability and the latter approximately 15%, as shown by Permanova analysis (P = 0.001 for both). Clustering of the genes (clusters numbered 1–8) based on their presence/absence in the metagenomic samples (supplementary data set 3, Supplementary Material online) did not reveal any functional differences between ecosystem-types and is therefore reported more in detail in the Supplementary Material online.
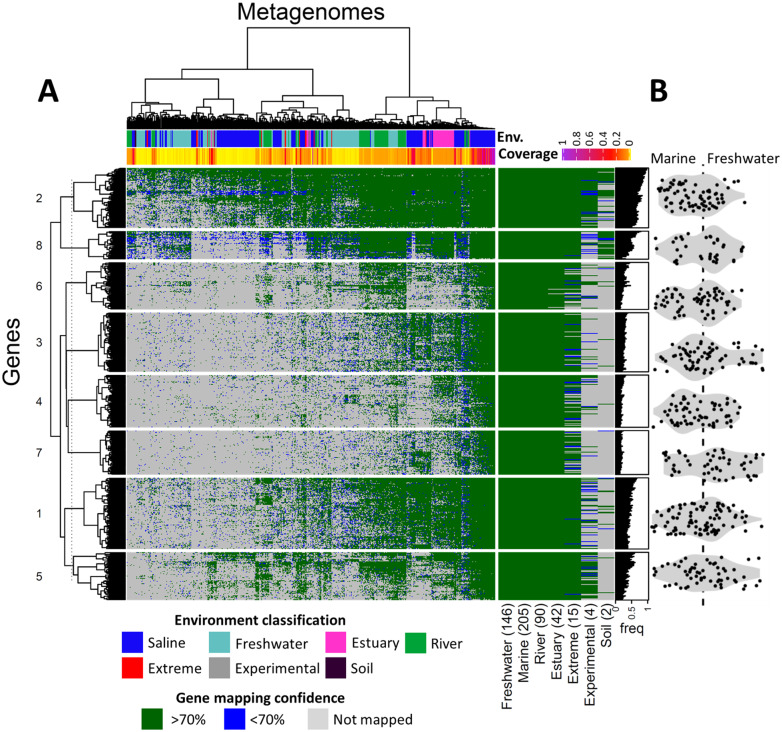
Functional potential of Achromatium spp. from different sediment ecosystems as analyzed by mapping of raw sequence data to all the annotated genes of published Achromatium spp. genomes (A). When sequences from a study mapped positively to multiple alleles of an Achromatium gene, the mapping with the higher score was retained for presentation purposes. Green color shows a probability of 70% or higher that the mapping to a known Achromatium sequence is correct. Blue shows a lower probability, whereas gray indicates that the function was not detected in the sample. Given that average amino acid identity between Achromatium spp. from the same and different environments is as low as 65% and 55%, respectively (Ionescu et al. 2017), a match probability of 70% and higher is to be considered a high confidence match. Nevertheless, the per-gene average and median match probabilities of the high-quality matches (i.e., those above 70%) were 95% and 96%, respectively (see supplementary fig. S4, Supplementary Material online, for data distribution). Functions were clustered based on presence–absence in the samples revealing some genes are more common than others. Clustering information is given in supplementary data set 3, Supplementary Material online. Functional profiles for overall freshwater and marine samples fully overlap with samples from estuaries, extreme environments (hot springs, hypersaline lakes, and soda lakes), and experiments containing less data. The latter are data resulting from bioreactor experiments carried out with marine sediment (see supplementary data set 4, Supplementary Material online). The per-sample sum of the fold-coverage for each known Achromatium protein, as calculated by the BBMAP mapping program, was used as a proxy for Achromatium sequence coverage in the sample. The ratio between a gene’s frequency in freshwater and marine ecosystems is presented for each cluster in a form of a violin boxplot (B). The 6-fold coverage difference between marine and freshwater (marine > freshwater) was accounted for in panel B by multiplying the freshwater gene presence frequency by the difference in median functional richness between the two ecosystem types (=1.23; see Materials and Methods and supplementary fig. S5, Supplementary Material online).
To test whether Achromatium spp. express genes differentially across various ecosystem types despite their globally identical functional potential (fig. 5), we compared our transcriptomic data of Achromatium from Lake Stechlin with similar data recruited from public sediment metatranscriptomes (fig. 6). Unlike for the metagenomic data, the samples, clustered according to gene coverage, generally group according to the different ecosystem types, separating freshwater from marine ones, with few exceptions. Nevertheless, similarly to the functional clustering of the metagenomic data, the gene clustering resulted in 11 groups that did not reveal any clear functional differences between Achromatium spp. from the different ecosystem types. Clusters number 4 and 11 (fig. 6), consisting mostly of genes involved in metabolism, signal processing, and genetic information processing, are expressed across both marine and freshwater ecosystems, though to a higher extent in freshwater. Cluster 6 is also expressed across all ecosystems. However, a higher expression is observed in two marine and a freshwater subset. This cluster contains the dissimilatory sulfite reductase and the adenylyl sulfate reductase, both typically involved in sulfur reduction and assimilation. Nevertheless, these enzymes are also found in sulfide oxidizers and function in reverse oxidizing intracellular sulfur, including in the closest known phylogenetic relative to Achromatium, Allochromatium vinosum (Dahl et al. 2005). Cluster 7 is expressed preferentially in the same subset of freshwater samples as cluster 6 (fig. 6). It contains among others a sulfur transferase, another type of enzyme known to be involved in sulfur oxidation (Wang et al. 2019). Cluster 2 contains the largest number of genes most of which are involved in the central metabolism of the cell (fig. 5). This cluster is mostly detected in our Achromatium-targeted metatranscriptomes and in a data set of marine-sediment bioreactor experiments. It is likely that a higher expression of other genes combined with a relatively low sequencing depth of Achromatium spp. in most studies led to the detection of these house-hold genes in these few high-coverage data sets.
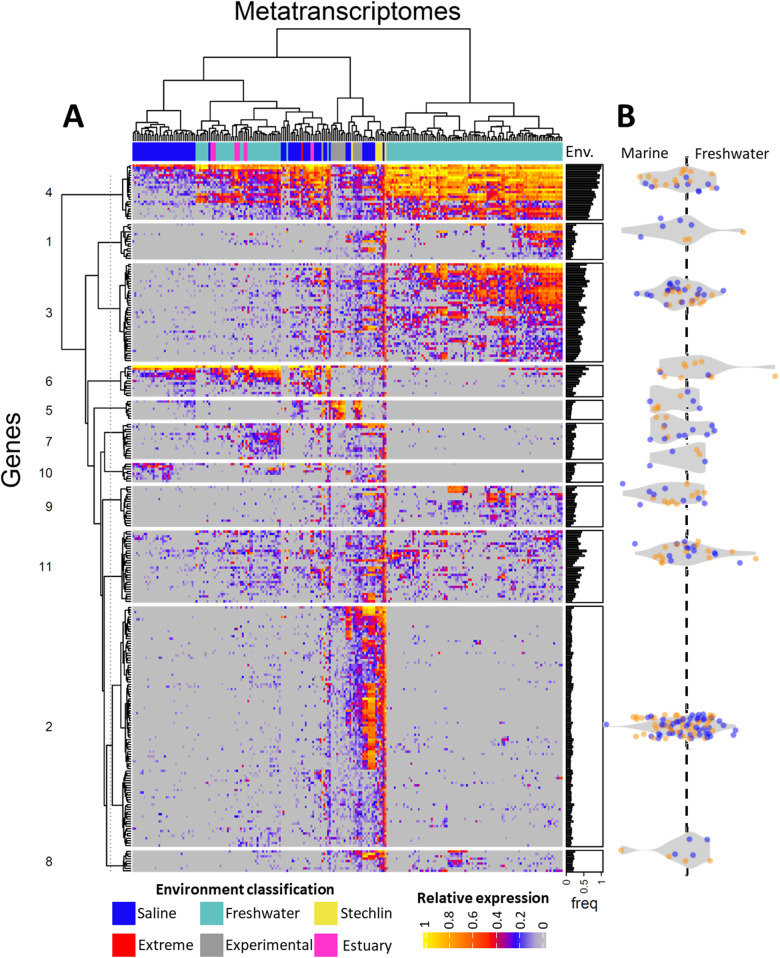
Analysis of approximately 300 publicly available sediment metatranscriptomes mapped to the functional genes of all known Achromatium spp. and excluding ribosomal RNA and ribosomal proteins (A). To account for difference in sequencing depths and Achromatium spp. cell abundance per sample, data were log-transformed and normalized per sample to range between 0 and 1. The ratio between a gene’s average nonzero expression in freshwater and marine ecosystems is presented for each cluster in a form of a violin boxplot (B) where symbols are colored according to the ecosystem type in which the gene was more frequently recovered in the metagenomes (i.e., fig. 4B). Thus, genes in orange and blue were more frequent in the freshwater and marine metagenomes, respectively. Zero values were omitted from the averaged expression to accommodate for coverage differences between studies.
Each gene in the transcriptome was analyzed for its preferential expression in freshwater or marine ecosystems (fig. 6B). This analysis reveals two main features of Achromatium. First, although some genes appear to be preferentially expressed in one of the two ecosystem types, the shape and location of the violin boxplots across the marine/freshwater axis reveal that on average, most gene clusters are similarly expressed in both ecosystem types. Second, some genes found in higher frequency in either freshwater or marine ecosystems in the metagenomic data (fig. 5) are preferentially expressed in the opposite ecosystem type. Both features point to the globally uniform functional potential of Achromatium spp., suggesting that preferential expression of genes is driven by local environmental factors (e.g., available electron donors and nutrients). The clustering of freshwater samples together with marine ones may be related to increased salinity in these waters due to drying out. Alternatively, it may be driven by other factors which result in an overall similar expression pattern regardless of salinity.
Achromatium sequences were also found in thermal springs (table 1). Therefore, as the GC content of bacteria was found not to be correlated with their optimal growth temperature (Hurst and Merchant 2001), we analyzed the known Achromatium spp. genomes for proteomic adaptations typical to thermophilic bacteria. We focused on two main characteristics of thermophilic bacteria that distinguish them from mesophiles: first, a strong positive correlation (R = 0:83 with P < 0:001) between the relative abundance of Glutamate (Glu) and that of the pooled abundances of Lysine (Lys) and Arginine (Arg) (Tekaia et al. 2002); second, a high ratio in the proteome between charged and polar amino acids (Kumar and Nussinov 2001; Suhre and Claverie 2003). To minimize the effect of incomplete protein assemblies, we focused on proteins larger than 150 amino acids (340 ± 202). Interestingly, the calculated Achromatium proteome has a low ratio of charged versus polar amino acids but a significant correlation between the abundance of Glu and that of Lys + Arg (R = 0.5) (supplementary fig. S6, Supplementary Material online). The correlation of the latter two improved with the length of the analyzed proteins, maximizing at R = 0.76. When the amino acid frequencies of the Achromatium proteome were compared with those typical for aquatic and terrestrial bacteria (supplementary fig. S6, Supplementary Material online), no common pattern emerged. Achromatium showed a slightly higher abundance of leucine (Leu), proline (Pro), methionine (Met), and isoleucine (Ile) and a much lower abundance of glycine (Gly), glutamine (Gln), glutamate (Glu), serine (Ser), asparagine (Asn), and aspartate (Asp) than other bacteria. Additionally, the amino acid frequency pattern of Achromatium was also not indicative of nitrogen or carbon limitation when compared with the model suggested by Hellweger et al. (2018).
Using the available genomic data and the functional overlap between Achromatium spp. from different ecosystem types, we propose a general functional model for the Achromatium cell, regardless of the ecosystem in which it lives (fig. 7). The model, based on KEGG modules and pathways, shows potential metabolic functions and highlights whether these could be confirmed with metatranscriptome data from Lake Stechlin. A full metabolic analysis of Achromatium, however, is beyond the scope of this study. Therefore, here, we bring forth only a few selected functions. The entire list of detected functions by the different means of annotation is provided in supplementary data set 3, Supplementary Material online, alongside information on confirmed expression and clustering data matching the metagenome (fig. 4 and supplementary fig. S7, Supplementary Material online) and -transcriptome (fig. 5 and supplementary fig. S8, Supplementary Material online) data. Over 25% of the proteins were assigned to a function involved in genetic information processing, both in the overall genomic data and in the metatranscriptome data from Lake Stechlin. Achromatium likely harbors three out of the six known pathways for carbon fixation, the Calvin cycle, reductive TCA, and reverse Acetyl CoA with calculated KEGG module completion levels in the genomes of 100%, 90%, and 43% confirmed by completion in the transcriptomics of 81%, 90%, and 28%, respectively. Achromatium misses a key gene for the classical reductive TCA pathway, the ATP-citrate lyase; however, it harbors and expresses 2-oxoglutarate carboxylase, an alternative gene that allows the process to be carried out (Aoshima and Igarashi 2006). Achromatium also possesses the ability to obtain carbon heterotrophically as suggested by the presence of genes for sugar metabolism and degradation of fatty acid and amino acids. Achromatium can potentially fix N2 into NH3 and lacks known transporters for nitrate or nitrite. As expected from a sulfur oxidizing bacterium, Achromatium can oxidize H2S to sulfate via the sulfate quinone reductase genes and possesses the sox genes to utilize thiosulfate. Yet, the thiosulfate-binding protein of the sulfate transporter could not be identified in the genomic data. Additionally, Achromatium possesses and expresses the sulfite reductases dsrA and dsrB genes possibly used as well in sulfide oxidation (Dahl et al. 2005). Elemental sulfur is evidently an intermediate as sulfur globules are typically seen in the cells, but the genes involved in the formation of sulfur globule envelopes (Pattaragulwanit et al. 1998) could not be identified in any of the published Achromatium spp. genome (Schorn et al. 2020). As previously suggested, Achromatium harbors the V-type ATPase (Salman et al. 2016) alongside the F-type ATPase.
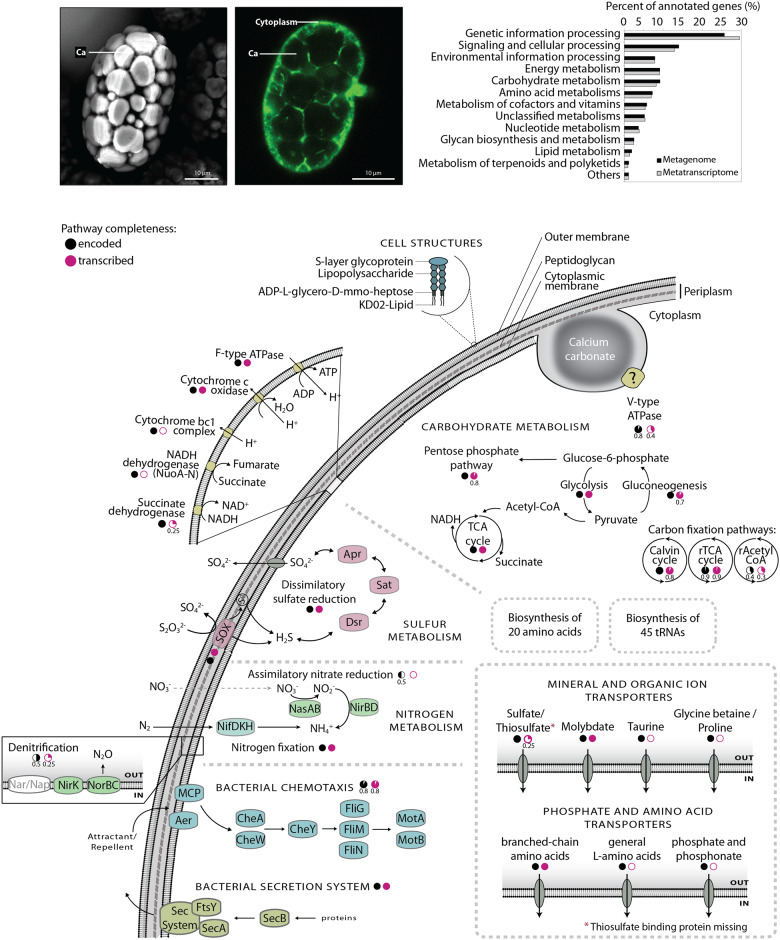
Main structural and functional characteristics of the universal Achromatium cell as deduced from KEGG modules and pathways as well as Pathway Tools analysis. The photomicrographs depict the general cell structure, where green color highlights the narrow cytoplasmic space in between the Ca crystals. The fraction of genes annotated to different KEGG categories is shown as bar chart for both the genomic and transcriptomic data. Black and magenta pie-charts underneath pathways represent completeness in the published Achromatium spp. genomes, and the transcriptomes obtained in this study, respectively. For incomplete pathways, the fraction present in the data is shown underneath the relevant circle. Pathways absent from the transcriptome are marked with an empty circle.
Discussion
Most bacteria, in contrast to Eukaryotes, are known to streamline their genomes, minimizing over time the presence of genes that provide no advantage to their fitness (Lynch 2006; Koonin 2009; Bobay and Ochman 2017). Similarly, bacteria reduce the amount of noncoding DNA in their genome maintaining a relatively stable ratio of genome size to noncoding nucleotides (Giovannoni et al. 2005; Batut et al. 2014). Last, bacteria have developed effective mechanisms to avoid accumulation of deleterious mutations via Müller’s ratchet (Markov and Kaznacheev 2016) with gene conversion being the most common one (Ludt and Soppa 2019). Examples of genomic streamlining can be seen in genome reduction of symbiotic organisms (Boscaro et al. 2013), streamlining in oligotrophic environments (Giovannoni et al. 2005; Swan et al. 2013), or when transferring into such an environment (Salcher et al. 2019). Genomic adaptation can also be seen, for example, in homologous organisms when crossing the freshwater/salt barrier both in the genome (Zaremba-Niedzwiedzka et al. 2013; Tsementzi et al. 2019), the proteome (Cabello-Yeves et al. 2018), and metabolism (Walsh et al. 2013) as is the case of Pelagibacterium sp. (SAR11) and Candidatus Fonsibacter sp. (LD12) (fig. 4A).
Achromatium, A Polyploid Bacterium with Approximately 300 Chromosomes, Challenges Our Understanding of General and Genomic Bacterial Evolution
The unprecedented degree of allelic divergence of Achromatium (Ionescu et al. 2017) covers all genes including those typically used as single cell markers. Recently, bacteria in the candidate phylum Rokubacteria (Becraft et al. 2017) have been found to also harbor large genetic heterogeneity between single cells. However, whether like in the case of Achromatium these belong to a single genus or they are functionally and phylogenetically diverging throughout this novel phylum is not yet known. Unlike previously hypothesized for polyploid bacteria, the chromosomes of Achromatium are not just replica of the same genome (Ionescu et al. 2017), rendering Achromatium the only known naturally heterozygous bacterium (Ludt and Soppa 2019). To explain this striking intracellular genomic variability, we previously proposed an evolutionary model for Achromatium (supplementary fig. S9, Supplementary Material online) that provided mechanistic hypotheses explaining the means by which such diversity can be generated (Ionescu et al. 2017). Two mechanisms were suggested to contribute to the generation of the large intracellular genetic diversity: 1) Mobile genomic elements (transposons) which are abundant in Achromatium cells contribute to genomic rearrangements resulting in inconsistent gene synteny and point mutations at insertion sites; and 2) calcium carbonate cavities fill most of the cell volume, restricting the cytoplasmic volume to thin tubes or sheets between them (Schorn et al. 2020). This causes spatial segregation of the chromosomes and the formation of genomic clusters which are possibly stabilized via gene conversion, as occurs in other polyploid prokaryotes (Soppa 2011; Ludt and Soppa 2019). However, due to the physical isolation of these clusters one from the other, different alleles may be fixed in each cluster. Upon cellular division, it was hypothesized that genomic clusters found in proximity to the division plane may be shuffled, with gene conversion resulting in the stabilization of new alleles and new gene synteny. This would result in two daughter cells that differ from each other, and from the mother cell. Both daughter cells still harbor genomic clusters that allow for continuous functionality alongside novel combinations enabling genetic experimentation, a trait that has been suggested as a benefit of bacterial polyploidy (Oliverio and Katz 2014; Markov and Kaznacheev 2016).
Here, we complement our theoretical reflections with large-scale data analyses to provide a better understanding of this unique eco-evolutionary phenomenon. Thus, we strive to understand the evolutionary changes Achromatium spp. underwent to prevail in ecosystems characterized by phyisicochemical parameters different enough to drive speciation rather than being occupied by a single species.
Members of the Genus Achromatium Are Abundant in Aquatic Sediments and Are Globally Distributed
Earlier studies have already shown Achromatium sp. to occur in contrasting freshwater ecosystems, for example, oligotrophic Lake Stechlin and acidic bog lake Grosse Fuchskuhle (Glöckner et al. 1999), hinting toward a high metabolic versatility. Recently, it was also established that Achromatium is not present exclusively in freshwater but also in saline ecosystems (Mansor et al. 2015; Salman et al. 2015). These findings prompted us to conduct an extensive search for Achromatium 16S rRNA genes in all available amplicon, metagenome and -transcriptome raw-read libraries obtained from aquatic sediments. The results of this search, summarized in figure 1, demonstrate that Achromatium spp. cells occur in almost all tested freshwater and marine samples including several unexpected ecosystem types, such as hot-springs, hydrothermal vents, soda, and hypersaline lakes. Surprisingly, Achromatium spp. were also found in a few samples of soils from nonaquatic ecosystems, such as forests. Accordingly, Achromatium bridges a broad range of parameters selecting for specialized bacteria, such as temperatures favoring psychrophiles and thermophiles (<4–>60 °C), alkaliphiles and acidophiles (pH <4–>9.5), shallow-water organisms to piezophiles (0–>3,000 m depth), and marine and freshwater bacteria. These, extremely different, environmental parameters require special functional and genomic adaptations and accordingly drive speciation, that is, the evolution of two or more species from a single common ancestor. Such is the case for example with freshwater and marine Synechococcus (Dvořák et al. 2014; Sánchez-Baracaldo et al. 2019), Rhodobacteraceae (Simon et al. 2017), and Pelagibacteraceae (Zaremba-Niedzwiedzka et al. 2013; Cabello-Yeves and Rodriguez-Valera 2019). Therefore, our findings raise the question whether various ecotypes can be distinguished genomically.
Achromatium spp. Display a Partial Ecotypic Phylogenetic Signal
Two approaches were used to investigate whether despite its large intracellular genetic diversity, Achromatium spp. diverged into distinguishable ecotypes. First, the presented data, mined from public read archives, were used to reconstruct the phylogeny of Achromatium spp. based on the 16S rRNA gene. As most of the data originate from short read libraries, we used extracted sequences of the 16S rRNA gene variable regions for this purpose. Second, we reconstructed the phylogeny using a series of proteins. A phylogenetic tree of the V4 region (fig. 2), producing sequences from the largest number of different ecosystem types, reveals that there is no clear-cut division of the tree between sequences originating from different environments (e.g., saline, freshwater or soil). This is in contrast to what is known from other organisms which occur in different ecosystems such as marine and freshwater Pelagibacteraceae (Cabello-Yeves et al. 2018) or even in different ecological niches within the same ecosystem (Ahlgren and Rocap 2012). Achromatium spp. stand out also from other large bacteria which occur in contrasting ecosystems and cluster phylogenetically accordingly (Salman et al. 2011; Teske and Salman 2014). Furthermore, clusters of sequences from a similar environment type (e.g., freshwater) consisted of sequences from geographically distant samples. As the 16S rRNA gene does not encode for a functional protein, it is unlikely that an environmental driver led to the convergence of these sequences. Given that already in 22 single cells from one environment (Lake Stechlin, Germany), over 170 sequence variants were found (Ionescu et al. 2017) it is more likely that the 16S rRNA gene cannot fully reflect the diversity or phylogeny of members of the Achromatium genus.
As an alternative approach to the 16S rRNA gene analysis, phylogenies of six different proteins were calculated. Of these proteins, three are regarded as single copy marker genes and three occur in multiple copies in the genomes of both saline and freshwater confirmed Achromatium spp. indicating multiple and divergent copies of “single copy” marker genes (see Ionescu et al. 2017). Interestingly, though, in the case of the three proteins tested here, among them RpoB (DNA-directed RNA polymerase, subunit beta) which was suggested as a good phylogenetic marker (Ogier et al. 2019), most sequences from Lake Stechlin clustered together, suggesting an ecotype structure (fig. 3A–C). A similar ecotype clustering was obtained for a series of freshwater and river Tuf (elongation factor TU) proteins assembled from individual raw-read libraries sequenced as part of a single study (fig. 3B). As a low number of sequences was available for these proteins for the published saline Achromatium genomes and no gene could be assembled from individual saline raw-read libraries, it is difficult to assess whether an ecotype structure occurs in saline environments as well. Although it appears that known saline and freshwater Achromatium spp. form separate coherent clusters, the identified freshwater cluster is likely an artifact due to both sequence sets being longer than those obtained from the assemblies of raw-read libraries.
For all three cases (fig. 3A–C), sequences assembled from individual raw-read estuaries libraries stand out in their distribution across the trees. It is, however, not possible to determine from the available data the underlying reasons for this distribution. On the one hand, it may be that individual samples represent mixed freshwater–saline communities of multiple ecotypes. On the other hand, it may be that the fluctuating estuary environment prevents the formation of strong ecotypes structures.
To further investigate the clustering of freshwater and saline Achromatium spp., we made use of three kinase proteins which were all available in multiple copies per cell in all published Achromatium spp. genomes (fig. 3D–F). Although these proteins were detected in the raw-read libraries, longer sequences could not be assembled and were therefore not included in the calculation of these trees. Both saline and freshwater sequences display a broad diversity, spreading rather uniformly across the phylogenetic trees. In cases of the three kinase proteins as well as of the V4 (fig. 2) and V9 (supplementary fig. S1, Supplementary Material online) regions of the 16S rRNA gene, we observed an overall lack of a governing pattern. However, unlike the 16S where the trees were derived from short regions (<150 nt) the kinase trees were calculated from sequences consisting of over 500 amino acids and are therefore likely to correctly express the diversity of these proteins. Although other Thiotrichaceae reference genomes harbor several divergent copies of these genes, these are not as numerous and diverse as observed for Achromatium spp.
Despite the lack of a general pattern, in all cases (i.e., 16S rRNA trees, “single copy” marker genes, and multiple copy genes) freshwater and saline sequences cluster, almost exclusively, separately. This suggests that genes of Achromatium spp. from saline and freshwater environments continued to evolve and diverge separately following the separation of species from these two environments. The lack of a general pattern in the 16S rRNA gene and the multicopy protein trees is in line with our understanding of the evolution of Achromatium and its genomes as suggested in Ionescu et al. (2017) and discussed above. Accordingly, upon the separation of the saline and freshwater lineages, individual gene copies may have continued to evolve and diverge within the proposed organization of chromosomal clusters. As a consequence, genes from both saline and freshwater Achromatium spp. (as well as other potential ecotypes) display a broad diversity but cluster close to their parallel, ancestor gene from which they have diverged.
Freshwater Achromatium spp. Have Proteomic Adaptation to Salinity
The freshwater/saline barrier is considered difficult to cross with not many bacteria being able to move back and forth between the two types of aquatic systems (Walsh et al. 2013) for evolutionary significant periods of time (Bizic-Ionescu and Ionescu 2016). Bacteria inhabiting saline ecosystems evolved two main mechanisms to combat the higher osmotic pressure: The first, namely “Salt in” employs elevated intracellular concentration of ions (typically potassium instead of sodium) to match the external salt concentration and the second, “Salt out,” is more common at low to moderate salinities such as marine ecosystems. It employs elevated concentrations of small organic solutes such as glycine betaine, ectoine, and trehalose, to account for the external salt concentration. The “Salt in” strategy necessitates an adapted proteome with an overall acidic isoelectric point (Oren 2013) which can function at high intracellular salt concentration. Although the “Salt out” has no such requirements, most organisms inhabiting saline systems have adapted an acidic proteome or show an increased number of proteins with a low pH isoelectric point (Oren 2013; Cabello-Yeves and Rodriguez-Valera 2019).
We compared the predicted distribution of isoelectric points for all Achromatium proteins from genomes obtained from freshwater and saline systems and observed minimal difference between them (fig. 2). A similar feature is observed when comparing the proteome assembled from the data mined from marine and freshwater sequence archives. In contrast, this analysis shows that both freshwater and marine Achromatium spp. proteomes have a similar abundance of proteins with acidic and basic isoelectric points suggesting that the cell maintains a permanent “readiness” for both freshwater and saline environments regardless of where they are. Interestingly, a similar pattern was observed in the proteome of other large bacteria from the family Beggiatoaceae (Beggiatoa spp. SS and PS) (Mußmann et al. 2007) obtained from the brackish water of the Baltic Sea (supplementary fig. S2, Supplementary Material online), and Candidatus Marithrix (Salman-Carvalho et al. 2016). The presence of osmolyte transport and synthesis systems in Achromatium spp. cells from all ecosystem types, alongside sodium pumps and potassium channels, further shows that the cells are constantly prepared for higher or fluctuating salinities. As Achromatium spp. cells were observed in sediments close to lake shores, it may be that these same adaptations help the cells survive increased salinities of drying freshwater environments.
Achromatium Is Not an Extremophile but May Tolerate Extreme Conditions
Current literature places Achromatium spp. in environments with moderate to low temperatures, neutrophilic to slightly basic environments, and salinity up to that of seawater. In contrast, our survey shows that Achromatium spp. is present also in more extreme environments with temperatures exceeding 60 °C, pH reaching as low as 3.2 and salinity reaching 45 g l−1 (table 1). We find it unlikely that Achromatium spp. cells were transferred to these environments via different dispersal vectors, as the amount of data recovered suggest an active community rather than a few scarce cells. Nevertheless, it is important to state that to date, Achromatium cells were not visually confirmed in these environments.
Achromatium spp. have been mostly reported from neutral or alkaline environments with pH values above 7 (Head et al. 2000; Mansor et al. 2015), with one exception of the acidic Lake Grosse Fuchskuhle with a pH range (at the time of the study) of 4.2–4.7 (Glöckner et al. 1999). Our data survey shows the pH limits of Achromatium to be broader, ranging between 3.2 and 9.7. Multiple adaptations have been documented for bacteria enabling them to live in acidic environments (Mirete et al. 2017; Guan and Liu 2020) most of which revolve around structural adaptation of membranes to reduce proton permeability or mechanisms to increase proton export. As acid may damage macromolecules, some acid-tolerant microorganisms make additional use of chaperones (proteins that typically assist with the conformational folding or unfolding other proteins) to protect and repair such macromolecules. Of those, the Achromatium pangenome contains the acid-stress protecting periplasmic chaperons DegP and SurA (Hong et al. 2012). Additionally, Achromatium harbors both V- and F-type ATPases which in case of acid stress can dissipate part of the proton gradient. Bacteria in acidic environments can also make use of buffering molecules, such as lysine, histidine, and arginine (Mirete et al. 2017). It was previously proposed (Yang et al. 2019) that the calcium carbonate crystals in the periplasmatic space of Achromatium spp. may buffer the acidification effect of sulfide oxidation. In a similar manner, these crystals may provide a buffering mechanism in case of excess of protons in a low pH environment.
Elevated temperatures affect the bacterial membrane as well as the structure and stability of macromolecules, such as proteins and nucleic acids. Accordingly, thermophiles, microorganisms with a preference to life at high temperatures, have acquired several adaptations resulting in improved thermostability of their membrane and protein structures (Kumar and Nussinov 2001). These changes come on top of efficient activity of chaperons and chaperonins (Richter et al. 2010). Nevertheless, thermotolerance, the ability to withstand temperatures higher than the organism’s typical environment can be acquired (Trent et al. 1994), Achromatium spp. does not bare a clear thermophilic signature in the amino acid composition of its proteins. Therefore, it is likely that on a global scale it is not adapted to life at high temperatures with those populations found in thermal environments either relying on chaperone-based heat shock response or having locally adapted their proteomes. The latter, however, cannot be tested using the current data set due to the limited number of samples recruited from extreme environments.
Achromatium spp. Cells Possess a Full, Identical, Functional Repertoire across Different Ecosystem Types
Gene gain and loss upon transition between ecosystem types is a common phenomenon (Bleuven and Landry 2016; Mende et al. 2017; Milner et al. 2019; Salcher et al. 2019). Our global comparison of the functional inventory of Achromatium spp. shows that all functions identified so far in the published saline (Mansor et al. 2015; Salman et al. 2016) and freshwater (Ionescu et al. 2017) genomes are present in all ecosystem types (fig. 5). A similar trend could already be observed when comparing the published genomes themselves (supplementary fig. S2, Supplementary Material online); however, several freshwater functions could not be detected in the marine genomes. This is likely an issue of coverage and data availability, given the genomic complexity of Achromatium, the sequencing depth necessary to properly assemble approximately 300, mostly different, chromosomes and the sole availability of four partial single-cell genomes from saline ecosystems. In contrast, data from freshwater systems include a large metagenome, six single cells (Ionescu et al. 2017), and several more cells using Oxford NanoPore Technology (this study). Accordingly, the recovered unique functions (gene annotations) from the saline Achromatium spp. genomes account individually for 17–41% and combined for 53% of the unique functions annotated from freshwater data. These numbers are, however, in par with the fractions obtained from individual bins (40 ± 10%) and single cells (42 ± 3%) of freshwater Achromatium spp. from Lake Stechlin, highlighting the need for extensive sequencing depth to cover the full functional potential of Achromatium cells.
Gene detection frequency differs between saline, freshwater as well as other ecosystem types (fig. 5B) despite the globally complete functional inventory of Achromatium spp. We attribute these differences to a mechanism allowing Achromatium to adapt to literally any environment. We hypothesize that, with time, genes more beneficial to the specific ecosystem type will occur in increasing numbers across the multiple chromosomes of Achromatium spp. similarly to accumulation of beneficial gene duplications (Serres et al. 2009), whereas those of no immediate benefit will be “archived.” The extreme polyploidy of Achromatium cells and the hypothesized compartmentalization (supplementary fig. S9, Supplementary Material online; Ionescu et al. 2017) may allow Achromatium to conserve functions of no immediate benefit and at the same time maintain fitness in a given environment. This is in line with the already proposed advantage of bacterial polyploidy where these organisms can conduct “genetic experiments” while maintaining functionality (Mendell et al. 2008; Van de Peer et al. 2017). This is in addition to harboring extensive allelic divergence which likely allows Achromatium to fine-tune their response to environmental changes, as observed in other organisms (Mock et al. 2017).
Achromatium spp. Express Genes Out of Their Global Pool Based on the Environment and Immediate Needs
Different expression patterns of Achromatium genes are observed in different ecosystem types, regardless of sequencing depth. This is not surprising, as organisms do not express all their genetic repertoire under all environmental conditions (Christie-Oleza et al. 2012). However, when comparing the averaged expression of functions in freshwater versus those in saline systems, it becomes evident that functions detected preferentially in metagenomes from one ecosystem type can be more expressed in another. This further supports the presence of a global Achromatium functional-inventory, from which required functions can be turned on if needed, despite having been, or en route to being archived.
How Widespread Can Be the Evolutionary Adaptation Strategy Employed by Achromatium spp.?
Having the genetic potential to survive under drastically different environmental conditions represents an ideal strategy to become a superbacterium. Nevertheless, Achromatium spp. are the first organisms which seem to use such a strategy. In contrast, as discussed above, many bacteria, particularly in nutrient limited environments, show evidence of genome streamlining and optimization (Swan et al. 2013; Salcher et al. 2019). The architecture and size of bacterial genomes are expected to be governed by the balance between the benefit of gaining a new function via adaptive acquisition and purifying selection (Sela et al. 2016). Here, we hypothesize that the polyploidy of Achromatium, coupled with its proposed compartmentalized structure (Ionescu et al. 2017), is responsible for the accumulations of functions which result in a globally identical metabolic potential. Thereafter, the purifying selection is possibly acting only on some of the chromosomal clusters removing from them genes which are rarely used and thus poorly maintained from deleterious mutations. This may result in the proposed environment-specific adaptation in gene copy number. In general, the rate of deletion appears to be slightly higher than the rate of acquisition (Sela et al. 2016) and such a continuous acquisition may not function in any haploid organism. Additionally, although polyploid bacteria are more common than previously thought (Oliverio and Katz 2014), most of them occur in noncompartmentalized cells, and thus the fixation of new genes across all chromosomes is likely to be more difficult (Li 2019). The reason why we have not yet discovered more of such superbacteria could be related to the peculiar cellular features of Achromatium. According to the evolutionary adaptation strategy that we propose for Achromatium, cells would need to be polyploid and possess a pseudomulticellular structure. Therefore, it will be interesting to compare the genomes of other large polyploid bacteria, particularly those of multicellular filamentous ones that inhabit distinct and different habitats.
Conclusions
We demonstrate a worldwide distribution of Achromatium spp., the only known heterozygous bacterium, across a broad range of ecosystem types. We show that Achromatium spp. accumulate functions resulting in a globally identical functional potential despite an apparent phylogentic separation between saline and freshwater cells. This is in parallel to the previously documented allelic divergence. Accordingly, although even two daughter cells may differ in genomic sequence content and synteny—one from the other and from the mother cell, they harbor an identical functionality. We further propose that lowering the copy numbers of temporarily unnecessary genes in Achromatium spp. will not cause immediate functional loss. Hence, even if only a few copies of those genes will be maintained, the related functions can be recalled in case of need. The presence of Achromatium spp. across a broad range of ecosystem types with drastically different characteristics suggests that the expectedly high costs of generating, maintaining, and regulating multiple, heterozygous full sets of genes regardless of the immediate environment are paying off, providing Achromatium with the necessary adaptive power to survive anywhere. The, typical, localization of Achromatium in the organic matter and nutrient-rich upper cm of sediments is likely a major factor in permitting such an expensive lifestyle. Similarly to the extreme allelic divergence (Ionescu et al. 2017), Achromatium challenges our understanding of genomic evolution in general and particularly that of polyploid organisms. In light of a plethora of large, polyploid bacteria (Ionescu and Bizic 2020), an urgent question that remains open is whether these, or other bacteria, share some or all of these newly discovered features.
Materials and Methods
Collection of Achromatium Cells
Achromatium cells were freshly collected from the shores of Lake Stechlin, NE Germany from the sediment surface at water depth of approximately 1 m. To obtain clean cells, collected sediments were sequentially passed through a series of mashes with pore sizes of 180, 90, and 55 µm and collected in a large Petri dish. Subsequently, the filtrate was further cleaned under a binocular using a slow rotation movement which further separates Achromatium cells from fine sediments due to their different sedimentation properties. Sediment debris was removed and Achromatium cells were repeatedly cleaned using either RNA fixation buffer (see below) or lake water filtered through 0.22-µm-diameter syringe filters. To remove epibionts, cleaned cells were washed for 30 min in 100 mM NaHCO3 buffer (Ionescu et al. 2017), a procedure which detaches the matrix of extracellular polymeric substances surrounding the Achromatium cells. These cells were further washed in buffer, sterile lake water and subsequently Milli-Q water prior to being directly processed for nucleic acid extraction. For single-cell amplification, individual cells were collected with a thin glass pipette and sequentially cleaned and transferred using lake water filtered through a 0.1-µm pore size filter which was further autoclaved.
RNA Fixation
The need to manually enrich the Achromatium cells from the environment while preventing the degradation of cellular RNA or the expression of genes related to stress response created several difficulties. Typical buffers as RNAlater, commercially available or lab-made using a saturated solution of ammonium sulfate, have low pH (<6) and a high salinity. The latter results in floating cells which cannot be separated from fine sediment using the sedimentation technique described above. Furthermore, the low pH leads to the rapid dissolution of the calcium carbonate bodies of Achromatium cells, leaving the cells invisible in the liquid. Consequently, based on the work by Lykidis et al. (2007) we used a modified Zinc-based buffer for the immediate fixation of cells. The final working recipe was as follows: 1% ZnCl2, 1% Zn(CF3COO)2, 0.05% Ca (CH3COO)2, 0.1 M Tris-HCl pH 8.0, 90 mM EDTA (ethylenediaminetetraacetic acid), adjusted with NaOH to pH 8.0. The increased EDTA concentration prevented the salting out of the Zn at the high pH. Sediment collected for RNA worked was directly collected into the buffer, which was also used for all subsequent cleaning steps, except the removal of epibionts, as detailed above.
RNA Extraction
RNA was extracted from collected cells using a phenol/chloroform procedure adapted from Nercessian et al. (2005) followed by DNA removal using the Turbo DNA fee kit (Thermo Fisher) as suggested in the manufacturer instructions. The cleaned RNA was stored in RNAstable tubes (Sigma) and sent for further processing to Mr. DNA (Molecular Research LP), Shallowater, TX.
RNA Sequencing
The RNA samples were resuspended in 25 µl of nuclease free water. RNA samples were cleaned using RNeasy PowerClean Pro Cleanup Kit (Qiagen). The concentration of RNA was determined using the Qubit RNA Assay Kit (Life Technologies). Whole transcriptome amplification was performed by using the QuantiTect Whole Transcriptome kit (Qiagen) followed by library preparation using KAPA HyperPlus Kits (Roche) following the manufacturer’s user guide. The concentration of double-strand cDNA was evaluated (table 1) using the Qubit dsDNA HS Assay Kit (Life Technologies). For six DNA samples, libraries were prepared using KAPA HyperPlus Kits (Roche); 25 ng DNA was used to prepare the libraries. Protocol starts with enzymatic fragmentation to produce dsDNA fragments followed by end repair and A-tailing to produce end-repaired, 5′-phosphorylated, 3′-dA-tailed dsDNA fragments. In adapter ligation step, dsDNA adapters are ligated to 3′-dA-tailed molecules. Final step is library amplification, which employs high fidelity, low-bias polymerase chain reaction to amplify library fragments carrying appropriate adapter sequences on both ends. Following the library preparation, the final concentration of all the libraries was measured using the Qubit dsDNA HS Assay Kit (Life Technologies), and the average library size was determined using the Agilent 2100 Bioanalyzer (Agilent Technologies). The libraries were then pooled in equimolar ratios of 2 nM, and 8 pM of the library pool was clustered using the cBot (Illumina) and sequenced paired end for 125 cycles using the HiSeq 2500 system (Illumina). The data are available at the Short Read Archive (SRA) under project number PRJNA633541.
DNA Nanopore Sequencing
Nanopore sequencing was conducted to improve the genome recovery of Achromatium from Lake Stechlin, as an addition to the data obtained in Ionescu et al. (2017). To obtain the DNA concentrations necessary for NanoPore sequencing, single Achromatium cells were obtained as previously described (Ionescu et al. 2017) and amplified using the Repli-G kit (Qiagen, Hilden, Germany) following the manufacturer instructions. Libraries for NanoPore sequencing were then prepared using the LSK-108 Kit following the manufacturer protocol, while excluding the size filtration. The prepared libraries were loaded on MIN107 R9 cells.
To incorporate the obtained reads into the previous assembly avoiding strand inversions incorporated by the phi29 polymerase in longer reads, the NanoPore reads were fragmented using the fastaslider.pl script from the Enveomics toolkit (Rodriguez-R and Konstantinidis 2016) into 250-nt-long single-end reads. These reads were then coassembled with the previous data using SPAdes assembler (Bankevich et al. 2012). However, no longer contigs than previously reported nor new functionality was obtained as a result from this assembly. The data are available at the SRA under project number PRJNA633773.
Bioinformatic Procedures
Functional Annotation
To generate a comprehensive functional database for Achromatium, several tools were used. Prokka (Seemann 2014) was run with the most recent updates on all Achromatium available data from freshwater (Ionescu et al. 2017) and saline (Mansor et al. 2015; Salman et al. 2016) ecosystems. The generated GenBank files were subsequently used to generate metabolic models using Pathway Tools (v.23) (Karp et al. 2015, 2019). These models were generated for the different bins of Achromatium spp. obtained from Lake Stechlin (Ionescu et al. 2017), for the genomes obtained from saline ecosystems (Mansor et al. 2015; Salman et al. 2016), as well as for a set of all unique Achromatium predicted genes.
The complete set of predicted Achromatium proteins was further annotated using the KEGG database using BlastKoala (Kanehisa et al. 2016), and KEGG module completeness was assessed using a custom script (available at: https://github.com/lucaz88/R_script/blob/master/_KM_reconstruction.R Last accessed 06 Nov 2020).
Last, the complete set of Achromatium proteins was annotated using the dbCAN2 (Zhang et al. 2018) and CAZy (Cantarel et al. 2009) databases.
RNAseq Analysis
The RNAseq data were mapped against all available Achromatium genomic data to generate an Achromatium sequences pool, and subsequently against a pooled reference database consisting of all Achromatium annotated sequences from freshwater (Ionescu et al. 2017) and saline (Mansor et al. 2015; Salman et al. 2016) ecosystems using the BBmap tool (JGI, sourceforge.net/projects/bbmap/). Given all known Achromatium genomes contain multiple alleles for each function, for purpose of downstream analyses, the best mapping quality (mapq) per function was recorded from the resulting SAM files as well as the matching sequence coverage from the statistics file generated by the software.
rRNA Data Mining and Processing
To obtain novel Achromatium spp. 16S rRNA sequences, we first used the IMNGS online service (Lagkouvardos et al. 2016) to recruit data from raw-read amplicon libraries. Several runs of ten query sequences (limit per run at the time) were submitted to the service using Achromatium spp., 16S rRNA available in the NCBI database as well as sequences generated in our previous work (Ionescu et al. 2017). Given the large variability between different Achromatium spp. sequences (Ionescu et al. 2017), a similarity threshold of 90% was set for the search. The raw amplicon library of the obtained results was subsequently obtained and locally searched for Achromatium spp. sequences using PhyloFlash (https://github.com/HRGV/phyloFlash Last accessed 06 Nov 2020) (Gruber-Vodicka et al. 2019). Sequences annotated as Achromatium were retained for further analysis. A list of the used studies is provided in supplementary data set 3, Supplementary Material online.
Additional 16S rRNA sequences were obtained from publicly available sediment metagenomes and metatranscriptomes deposited on the MG-RAST server or in the SRA. These data were downloaded and locally analyzed using PhyloFlash (https://github.com/HRGV/phyloFlash Last accessed 06 Nov 2020) (Gruber-Vodicka et al. 2019). Sequences annotated as Achromatium were retained for further analysis. A list of the used studies is provided in supplementary data set 3, Supplementary Material online.
The user-provided metadata were obtained from the repositories and used to classify the ecosystem type from where the sequence was obtained and to place the site on a global map in case relevant sequences were obtained. In cases where the ecosystem type was not properly reported, data were obtained from the matching publication if available or by using the sequence coordinates in Google Map.
Sequences were pooled according to their ecosystem type (saline, freshwater, extreme, river, estuary, other) and dereplicated. As amplicon, metagenomic and metatranscriptomic sequences do not necessarily overlap, V-Xtractor (Hartmann et al. 2010) was used to extract the V1–V9 variable regions of the 16S rRNA. The variable region sequences extracted from the environmental sequence pools were further dereplicated. Finally, random subsets of 50 sequences from freshwater and saline systems (mostly marine) were generated for phylogenetic tree reconstruction using the Fasttree 2 (Price et al. 2010) software with the GTR (general time reversible) model and gamma correction.
Metagenomic and Metatranscriptomic Public Data Processing
The downloaded data (MG-RAST and SRA, see above) were mapped against a pooled reference database consisting of all Achromatium annotated sequences from freshwater (Ionescu et al. 2017) and saline (Mansor et al. 2015; Salman et al. 2016) environments using the BBmap tool (JGI, sourceforge.net/projects/bbmap/). Given Achromatium genomes contain multiple alleles for each function, for downstream analyses the best mapping quality (mapq) per function from the resulting SAM files and the matching sequence coverage from the statistics file generated by the software were recorded for each study.
The list of raw-read libraries used in this study and their available metadata is available as supplementary data set 4, Supplementary Material online.
Heatmaps were plotted using the R packages ggplot2 (Wickham 2016) and ComplexHeatmap (Gu et al. 2016).
Protein Tree Calculation
To calculate the protein trees presented in figure 3, several sets of proteins were recruited. 1) Relevant proteins from the annotated and published freshwater and saline genomes. 2) To obtain a matching set of proteins from the metagenomic data, sequences that were previously mapped to the known Achromatium pangenome were assembled separately per sample and per environment type (i.e., saline, freshwater, etc.). Individual samples were assembled using the SPADES assembler (Bankevich et al. 2012) and the pooled sequences were assembled using MEGAHIT (Li et al. 2015) due to the extensive memory requirements. The assemblies were annotated using Prokka (Seemann 2014) and all protein sequences of interest were extracted. 3) Additional reference sequences were obtained by downloading all available Thiotrichaceae sequences from the Uniprot online database (Bateman et al. 2017). The kinase proteins (fig. 3D–F) did not result in any matches; therefore, the genomes of several representative Thiotrichaceae bacteria were locally annotated using Prokka (Seemann 2014) and the relevant proteins, now identified, were extracted. A minimal sequence length of 110 and 500 amino acids was used for the trees in figure 3A–C and D–F, respectively. The sequence data were aligned using MUSCLE (Edgar 2004) and maximum likelihood trees were calculated using FastTree2 (Price et al. 2010).
Isoelectric Point Calculation
Isoelectric point was calculated using the standalone version of the isoelectric point calculator (Kozlowski 2016). Data for genomes available in the precalculated database Proteome-PI (Kozlowski 2017) were obtained there. Proteins were predicted from the recruited metagenomic data using Prodigal (Hyatt et al. 2010) and their isoelectric point calculated using the standalone version of the isoelectric point calculator (Kozlowski 2016) taking the values calculated their “peptide” algorithm.
Acknowledgments
This work was supported by the German Federal Ministry of Education and Research (BMBF) through the BIBS (Bridging in Biodiversity Science; Funding No. 01LC1501G) project. M.B. was funded through DFG Project BI 1987/2-1. The publication of this article was funded by the Open Access Fund of the Leibniz Association. We thank Mr Justin Stranz for his assistance.
Data Availability
The sequence data generated in this study are available at the Short Read Archive under project numbers PRJNA633541 and PRJNA633773.