 The Genomic Basis of Rapid Adaptation to Antibiotic Combination Therapy in Pseudomonas aeruginosa
Molecular Biology and Evolution


- Altmetric
Combination therapy is a common antibiotic treatment strategy that aims at minimizing the risk of resistance evolution in several infectious diseases. Nonetheless, evidence supporting its efficacy against the nosocomial opportunistic pathogen Pseudomonas aeruginosa remains elusive. Identification of the possible evolutionary paths to resistance in multidrug environments can help to explain treatment outcome. For this purpose, we here performed whole-genome sequencing of 127 previously evolved populations of P. aeruginosa adapted to sublethal doses of distinct antibiotic combinations and corresponding single-drug treatments, and experimentally characterized several of the identified variants. We found that alterations in the regulation of efflux pumps are the most favored mechanism of resistance, regardless of the environment. Unexpectedly, we repeatedly identified intergenic variants in the adapted populations, often with no additional mutations and usually associated with genes involved in efflux pump expression, possibly indicating a regulatory function of the intergenic regions. The experimental analysis of these variants demonstrated that the intergenic changes caused similar increases in resistance against single and multidrug treatments as those seen for efflux regulatory gene mutants. Surprisingly, we could find no substantial fitness costs for a majority of these variants, most likely enhancing their competitiveness toward sensitive cells, even in antibiotic-free environments. We conclude that the regulation of efflux is a central target of antibiotic-mediated selection in P. aeruginosa and that, importantly, changes in intergenic regions may represent a usually neglected alternative process underlying bacterial resistance evolution, which clearly deserves further attention in the future.
Introduction
The rise of antibiotic resistance evolution represents one of the most urgent challenges of our time (Davies and Davies 2010; Bush et al. 2011). Finding the best way to use antibiotics such that the evolution of resistance is minimized, has become a fundamental challenge for physicians and evolutionary biologists alike. Over the last decade, a large body of evidence has accumulated showing that evolutionary principles need to be considered to effectively address the antibiotic resistance crisis (Jansen et al. 2013; Pál et al. 2015; Baym, Stone, et al. 2016; MacLean and Millan 2019; Roemhild and Schulenburg 2019). The simultaneous use of two or more antibiotics (i.e., combination therapy) has long been advocated as an evolutionary-based strategy that limits the spread of resistance while rapidly clearing the infection (Beardmore et al. 2017; Tepekule et al. 2017; Uecker and Bonhoeffer 2017). In fact, drug combinations are successfully used for the treatment of HIV (Martin et al. 2008), Mycobacterium tuberculosis (Gumbo et al. 2014; Makarov et al. 2014), malaria (Douglas et al. 2010), and some cancer types (Laverdière et al. 1997; Jain 2001; Bozic et al. 2013). Despite its effectiveness in such cases, implementation in other infectious diseases like those caused by the opportunistic human pathogen Pseudomonas aeruginosa remains elusive and controversial (Chamot et al. 2003; Tamma et al. 2012).
To enhance our understanding of the potency of combination therapy, we previously used evolution experiments under laboratory conditions for a systematic analysis of the efficacy of antibiotic combinations against P. aeruginosa PA14 (Barbosa et al. 2018). We found that synergistic combinations consistently favor bacterial clearance, whereas the potential of evolved collateral sensitivity between the combined drugs significantly reduces the rate of adaptation (Barbosa et al. 2018). Similar evolution experiments were performed for other pathogens and combined with genomic analysis of surviving populations to identify the likely targets of antibiotic selection (Hegreness et al. 2008; Michel et al. 2008; Toprak et al. 2012; Imamovic and Sommer 2013; Lázár et al. 2013; Kim et al. 2014; Munck et al. 2014; Evgrafov et al. 2015; Roemhild et al. 2015; Baym, Lieberman, et al. 2016; Barbosa et al. 2017, 2018; Yen and Papin 2017; Dean et al. 2020). For example, for Staphylococcus aureus and Escherichia coli, this approach revealed that the mutational profiles of populations adapted to multidrug environments (either deploying drugs sequentially or simultaneously) often differ from those selected under single-drug treatments (Kim et al. 2014; Munck et al. 2014). In addition to variation in single-nucleotide polymorphisms (SNPs), E. coli can also respond rapidly to combination therapy by increasing the copy number of a genome region with the acrB efflux operon (Pena-Miller et al. 2013; Laehnemann et al. 2014). Revealing such evolutionary mechanisms remains critical to better comprehend which exact processes facilitate or hamper rapid drug resistance evolution.
To date, surprisingly little is known on the genetic mechanisms underlying evolutionary adaptation to antibiotic combinations in P. aeruginosa. So far, whole-genome sequencing was used to characterize the mutations underlying experimental evolution of P. aeruginosa to single-drugs or sequential-drug treatments (Yen and Papin 2017; Roemhild et al. 2018; Barbosa et al. 2019). These studies revealed the central role of efflux regulation during adaptation to antimicrobials, regardless of the treatment strategy of the evolution experiment, including a single switch between two drugs (Yen and Papin 2017), random and regular sequences of three antibiotics exploiting negative hysteresis (Roemhild et al. 2018), and single switches of two drugs exploiting collateral sensitivity effects (Barbosa et al. 2019). However, a systematic analysis of genomic changes underlying P. aeruginosa adaptation to simultaneously applied antibiotics is not yet available.
Here, we evaluated genomic data from 127 experimentally evolved populations, obtained previously after they were subjected to either combination or corresponding single-drug treatments (Barbosa et al. 2018). We used the genomic data to examine which functional targets were selected among the different treatments and whether independent replicate populations from the same treatment evolved in parallel. We further assessed how selected variants in intergenic regions and adjacent coding genes contribute to the adaptive potential of P. aeruginosa and whether specific variants lead to evolutionary trade-offs in other environments.
Results
To better understand the underlying mechanism of adaptation to monotherapies and drug combinations, we performed whole-genome resequencing of 118 previously experimentally evolved populations, and also the PA14 ancestor, from which the experiment was initiated, as well as eight controls adapted to minimal media only (Barbosa et al. 2018). We removed the identified variants in the evolved controls from all other sequenced populations. We focused on selected populations surviving a regimen of exposure to constant subinhibitory single-drug concentrations (initially inhibiting ∼75% of normal growth) or multidrug treatments with distinct levels of inhibition depending on the interaction profile of the combined drugs (fig. 1). The selected populations covered eight single-drug treatments from distinct classes and functional targets, and eight combinations with different interaction profiles (fig. 1). The evolution experiments were run over 5 days with 12-h transfer intervals, resulting in ∼120 generations (for more details, see Barbosa et al. 2018).

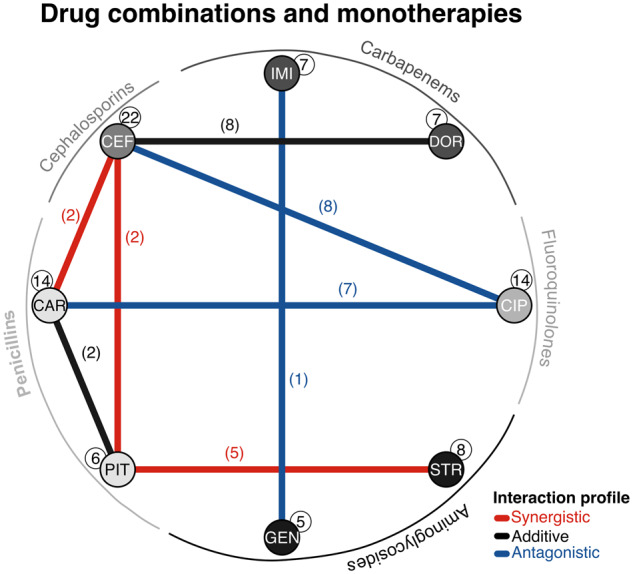
Antibiotics and combinations used in this study. Drug interaction network. The nodes correspond to one of eight monotherapies used in this study spanning five different drug classes (see outer ring). The links denote the eight combinations evaluated, with their color indicating the interaction profile of the combined drugs (synergistic, additive, or antagonistic). Numbers in parentheses or white circles highlight the number of populations considered for each environment. Abbreviations: CIP, ciprofloxacin; DOR, doripenem; IMI, imipenem; CEF, cefsulodin; CAR, carbenicillin; PIT, piperacillin+tazobactam; GEN, gentamicin; STR, streptomycin.
We found a total of 153 variants in 38 sites with an average of one to two variants per population, irrespective of the environment (fig. 2A). About 61% of the variants were found at frequencies of 70% or higher (variants ≥70% vs. all other variants, χ2 = 8, df = 1, P = 0.005; fig. 2B). Nonsynonymous and frameshift variants were the most common variant types across the sequenced populations (fig. 2C). Moreover, 84% of the variants were observed in coding regions (intergenic vs. all other variant types, χ2 = 69.3, df = 1, P < 0.0001), and of these, only a single synonymous variant was identified (fig. 2C). Altogether, most variants are nonsilent, thus suggesting their contribution to adaptation in single and multidrug environments following rapid genetic sweeps in each population.
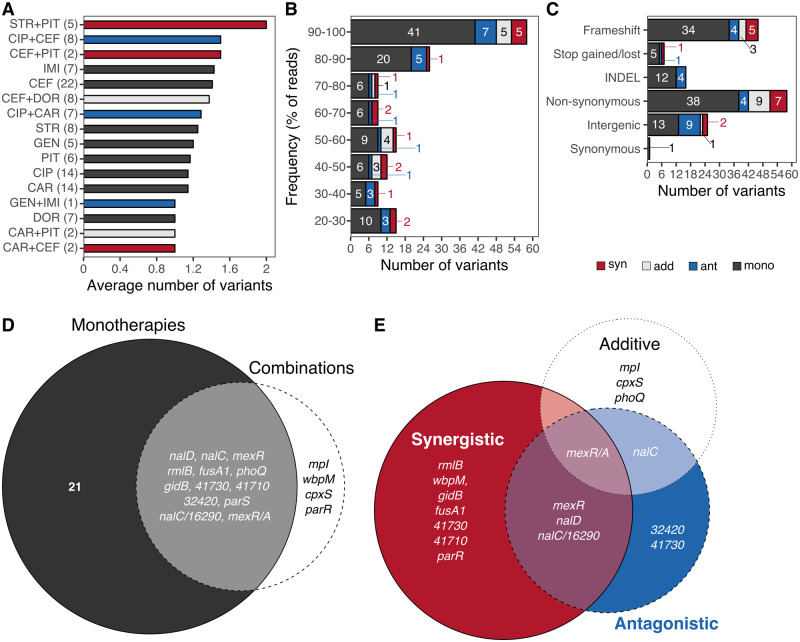
High prevalence of specific variants under sustained subinhibitory antibiotic environments. The average number of genes with substitutions per antibiotic or combination is shown in (A). For each treatment, the number of sequenced populations is indicated in brackets. (B) Number of observed variants by treatment at different frequency levels based on the percentage of reads (proportion of reads with the variant relative to all reads for the respective position). (C) Number of variants per variant type grouped by treatment. Numbers embedded within the bars in panels (B) and (C) indicate the number of variants for each group and treatment. Drug interaction type of the selected combinations is indicated in blue (antagonistic), red (synergistic), and light gray (additive), whereas single-drug treatments are highlighted in dark gray in all panels of this figure except panel (D). Each Venn diagram illustrates the mutational overlap at the gene level between (D) monotherapies and combinations, and (E) between combinations with distinct interaction profile. The size of each circle is scaled to the number of genes relative to each experiment. Abbreviations: CIP, ciprofloxacin; DOR, doripenem; IMI, imipenem; CEF, cefsulodin; CAR, carbenicillin; PIT, piperacillin+tazobactam; GEN, gentamicin; STR, streptomycin.
Variants in Efflux Regulatory Systems Are Pervasive in All Evaluated Environments
Variants in genes involved in the regulation of efflux (nfxB, mexR, nalC, or nalD) or within intergenic regions adjacent to efflux regulators (mexR/A or nalC/16290-armR) were most commonly affected across treatment types and experimental units, including the combinations with distinct interaction profiles (fig. 2D and E, and see functional category [I] in fig. 3). We evaluated the shared mutations among antibiotic monotherapies from different classes (fig. 1 and supplementary fig. S1, Supplementary Material online). We found that penicillins, cephalosporins, and fluoroquinolones commonly have variants in genes involved in efflux regulation or within associated intergenic regions, whereas carbapenems and aminoglycosides rather share variants in two-component regulatory systems (supplementary fig. S1, Supplementary Material online). Similarly, we examined the mutational overlap between combinations of β-lactams with other β-lactams and found that variants in efflux regulators are pervasive among these antibiotic pairs (supplementary fig. S2A, Supplementary Material online). There was no variant shared by all combination types, but the majority of variants, both shared among some of the combinations and unique to each of them, were observed in genes involved in the regulation of efflux (supplementary fig. S2A, Supplementary Material online). Similarly, shared genes among combinations of β-lactams with antibiotics from other classes were predominantly associated to the regulation of efflux, particularly among fluoroquinolones with cephalosporins, or penicillins, and aminoglycosides with penicillins (supplementary fig. S2B, Supplementary Material online).
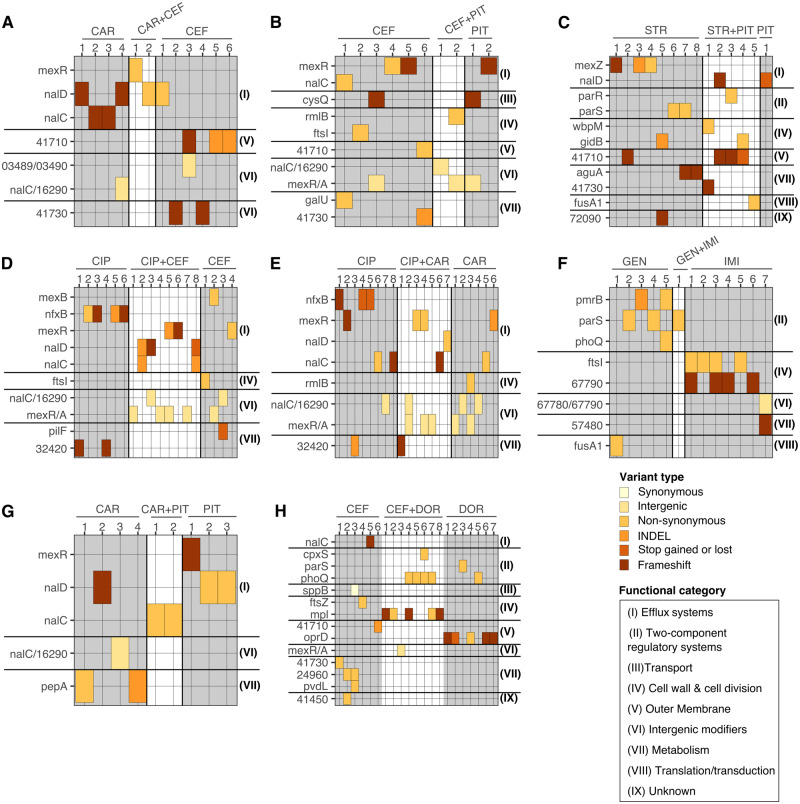
Efflux regulation and two-component regulatory systems are the main targets of selection across treatments. (A–H) show different experimental units, always consisting of a particular combination treatment (highlighted on white background) and the corresponding monotherapies (highlighted on gray background) and including up to eight independent replicates (numbers, horizontal axis). Variant genes and their functional category are given on the left and right sides, respectively. Functional information (see legend in bottom right) was inferred from a combined analysis using DAVID, the Pseudomonas database, BACTOME, and publications. The observed variant types are indicated by the different colors (see legend in bottom right). Abbreviations: CIP, ciprofloxacin; DOR, doripenem; IMI, imipenem; CEF, cefsulodin; CAR, carbenicillin; PIT, piperacillin+tazobactam; GEN, gentamicin; STR, streptomycin.
We next compared the combination treatments with their corresponding monotherapies. In most cases, at least one of the adapted populations from the multidrug environment shared a variant affecting efflux regulation with at least one of the adapted populations from either (or both) of the corresponding single-drug treatments (fig. 3). In CAR+PIT (fig. 3I), the populations adapted to the combination did not share a variant in efflux regulation with those adapted to the corresponding single-drug treatments, but they all had a variant in a regulator of the same efflux pump, MexAB-OprM. This is perhaps unsurprising, as variants in efflux regulators are generally associated to multidrug resistance, since a single pump can extrude several compounds (Poole 2001; Piddock 2006; Li et al. 2015). Notable exceptions to this are GEN+IMI (fig. 3F) and CEF+DOR (fig. 3H), for which we observed variants affecting alternative resistance mechanisms, mainly in two-component regulatory systems.
Interestingly, mexR, nalC, and nalD, which are all part of the complex regulatory system of the MexAB-OprM efflux pump, were the most commonly affected genes. Mutations in these genes have been typically associated to increases in resistance against the β-lactams and, to a lesser degree, fluoroquinolones (Evans et al. 2001; Cao et al. 2004; Sobel et al. 2005). Moreover, variants in such genes were also readily observed in experimentally evolved resistant P. aeruginosa adapted to diverse treatment strategies (Barbosa et al. 2017, 2019; Yen and Papin 2017; Roemhild et al. 2018), as well as in clinical isolates obtained from cystic fibrosis patients (Tueffers et al. 2019) or other clinical sources (Hornischer et al. 2019). This emphasizes the high prevalence of this resistance mechanism and suggests that through such variants P. aeruginosa can consistently evolve resistance and spread under different levels of selection in both the laboratory and the clinic.
Other Mechanisms of Resistance
Several combination treatments and corresponding monotherapies showed changes in genes encoding two-component regulatory systems (figs. 2D and E and 3; supplementary table S1, Supplementary Material online). These systems are known to affect antibiotic resistance indirectly, for example, by influencing modifications of membrane permeability or physiological states that interfere with drug uptake (McPhee et al. 2003; Guest and Raivio 2016). In detail, we found variants in pmrB, phoQ, and parS genes, which have been associated repeatedly with increased resistance against a variety of antibiotics in P. aeruginosa and Acinetobacter baumanii (McPhee et al. 2003; Muller et al. 2011; Salazar et al. 2016; Barbosa et al. 2017; Gerson et al. 2019). We also found variants in cpxS, a gene recently shown to contribute to the evolutionary response toward negative hysteresis in P. aeruginosa (Roemhild et al. 2018).
Most other variants affect genes implicated in distinct cellular processes, including cell wall synthesis, cell division, and membrane permeability (fig. 3 and supplementary table S1, Supplementary Material online). They include genes such as ftsI, mpl, and rmlB, which are involved in peptidoglycan synthesis, the main target of the β-lactam drugs. Mutations in such genes are associated with resistance against the β-lactams by tampering the interaction between the drugs and their targets, or by activation of the SOS response (Miller et al. 2004; Tsutsumi et al. 2013). We also found variants in oprD, a porin associated to carbapenem uptake and resistance (Farra et al. 2008; Rodríguez-Martínez et al. 2009).
Some of the variants exclusively observed among populations adapted to combinations with the same interaction profile were associated with the functional target of either of the drug components. For instance, we found mutations in fusA1 and wbpM in a population adapted to the synergistic combination STR+PIT (fig. 3C) that typically translate into increased resistance against aminoglycosides and β-lactams, respectively (Dötsch et al. 2009; Bolard et al. 2017). Similarly, we found variants in mpI, a gene associated with resistance against β-lactams (Miller et al. 2004; Tsutsumi et al. 2013), in the additive combination CEF+DOR (fig. 3H). Such variants can then complement, stabilize, or increase resistance against one of the component drugs in the combination, thereby increasing the fitness of P. aeruginosa in these multidrug environments. In contrast, many of the genes exclusively found in populations adapted to the monotherapies stand out for mediating resistance against only specific drug classes. Examples of these include nfxB, which is an efflux regulator predominantly associated with fluoroquinolone resistance; pmrB, a common two-component regulatory system linked to resistance against aminoglycosides; and, ftsI, which codes for a penicillin-binding protein 3 involved in β-lactam resistance (McPhee et al. 2003; Jeannot et al. 2008; An et al. 2015; Barbosa et al. 2017). Only few genes were exclusively found in populations from combination treatments and included the two-component regulatory systems of cpxS and parR, and the cell wall-associated genes mpI and wbpM (fig. 2D and E).
Parallel Evolution at the Gene Level in Efflux Regulatory Systems
Efflux regulators governing the expression of the MexAB-OprM pumps were the most common targets of adaptive evolution (mexR, nalC, and nalD; fig. 2D and E). These genes were altered in 12–14 populations (∼10% of all populations) coming from at least six different treatments (∼40% of the considered treatments), suggesting that parallel evolution at the gene level was common (supplementary fig. S3, Supplementary Material online). Yet, at the nucleotide or variant level, evolution seems to be less reproducible as different SNPs and SVs were found for each of the affected genes (supplementary fig. S3, Supplementary Material online). For example, the 12 populations from six different treatments with variants in nalC showed 11 different SNPs or SVs within the gene (supplementary fig. S3, Supplementary Material online). An important exception was the variants in intergenic regions: A unique SNP in the mexR/A intergenic region was consistently identified in 14 populations, whereas two different SNPs in the nalC/16290 intergenic region were found in nine populations (supplementary fig. S3, Supplementary Material online). Among the other genes, the two-component regulatory systems phoQ and parS also stand out since only one to two variant types were identified in 12 different populations (supplementary fig. S3, Supplementary Material online). Taken together, our results indicate that parallel evolution is prevalent at the gene level under these conditions in P. aeruginosa, and that for certain genes evolution can be highly repeatable at the SNP level.
Variants in Intergenic Regions and Efflux Regulators Lead to Increases in Resistance
We identified intergenic regions as potentially important targets of selection in monotherapies and combinations. However, even though specific intergenic variants arose repeatedly in independent populations, it is still possible that they are not adaptive but have been fixed by chance. To test the adaptive potential of these variants, we first selected populations for subsequent analysis that had a particular variant with high levels of parallel evolution in either the mexR/A or nalC/16290-armR intergenic regions (table 1). For comparison, we also selected populations having a single variant in either of the corresponding efflux regulatory genes (mexR or nalC; table 1). All of the selected populations did not show additional variants, and hence were suited to evaluate the phenotypic effect of only the particular variant. We further examined the direct sequence neighborhood of the variants for the presence of putative functional elements, taking into consideration the well-characterized promoter regions and binding sites of mexR/A (Evans et al. 2001) and nalC/16290-armR (Daigle et al. 2007; Starr et al. 2012). Finally, we tested experimentally to what extent these variants cause a change in sensitivity against the relevant antibiotic monotherapies or combinations.

| Population ID | Selective Environment | Treatment Type | Affected Genomic Region |
|---|---|---|---|
| A11 | CAR+CEF | Combination | mexR |
| D14 | CIP+CAR | Combination | mexR |
| B16 | CIP+CEF | Combination | mexR |
| B25 | CEF | Monotherapy | mexR |
| C22 | PIT | Monotherapy | mexR |
| E22 | PIT | Monotherapy | mexR |
| H13 | CEF+DOR | Combination | mexR/A (intergenic) |
| D16 | CIP+CAR | Combination | mexR/A (intergenic) |
| B14 | CIP+CEF | Combination | mexR/A (intergenic) |
| D21 | CAR | Monotherapy | mexR/A (intergenic) |
| E11 | CAR+PIT | Combination | nalC |
| E12 | CAR+PIT | Combination | nalC |
| D17 | CIP+CAR | Combination | nalC |
| A02 | CAR | Monotherapy | nalC |
| A03 | CAR | Monotherapy | nalC |
| D25 | CAR | Monotherapy | nalC |
| H07 | CEF | Monotherapy | nalC |
| D06 | CIP | Monotherapy | nalC |
| C12 | CEF+PIT | Combination | nalC/16290-armR (intergenic) |
| D22 | CAR | Monotherapy | nalC/16290-armR (intergenic) |
| E03 | CAR | Monotherapy | nalC/16290-armR (intergenic) |
| D07 | CIP | Monotherapy | nalC/16290-armR (intergenic) |
a All of the selected and listed populations only had a single variant in the indicated gene, but nowhere else in the genome. For additional details on the specific variants, see supplementary table S1, Supplementary Material online.
The mexR/A intergenic region contains three active promoters and two binding sites of MexR (fig. 4A): One promoter affects mexR (PmexR), whereas the other two are linked to mexA (P1mexA and P2mexA). MexR’s binding sites are located in between PmexR and P2mexA (fig. 4A). Even though both mexA promoters are functional, P2mexA is more active. Yet, the less active, more proximal, promoter P1mexA has been associated to increased levels of resistance against antibiotics in some clinical strains (Evans et al. 2001). Importantly, the variant that we found within the intergenic region corresponded to a C->T substitution, which occurred 3 bp downstream of the −35 box of P1mexA. Thus, the variant may interfere with the regular transcription of the efflux component MexA, independently of MexR. Furthermore, the intergenic region in between nalC and PA14_16290-armR has two promoters proximal to the PA14_16290-armR genes: PnalC and P16290-armR (fig. 4B). NalC’s binding sites are located closely to both of the promoters and include an inverted repetitive region (Starr et al. 2012). The identified variant within this region is located directly at the −10 box of the PnalC and substitutes an A for a G (fig. 4B). This could potentially limit the normal transcription of nalC, which controls the expression of ArmR, an antirepressor of MexR (Wilke et al. 2008).
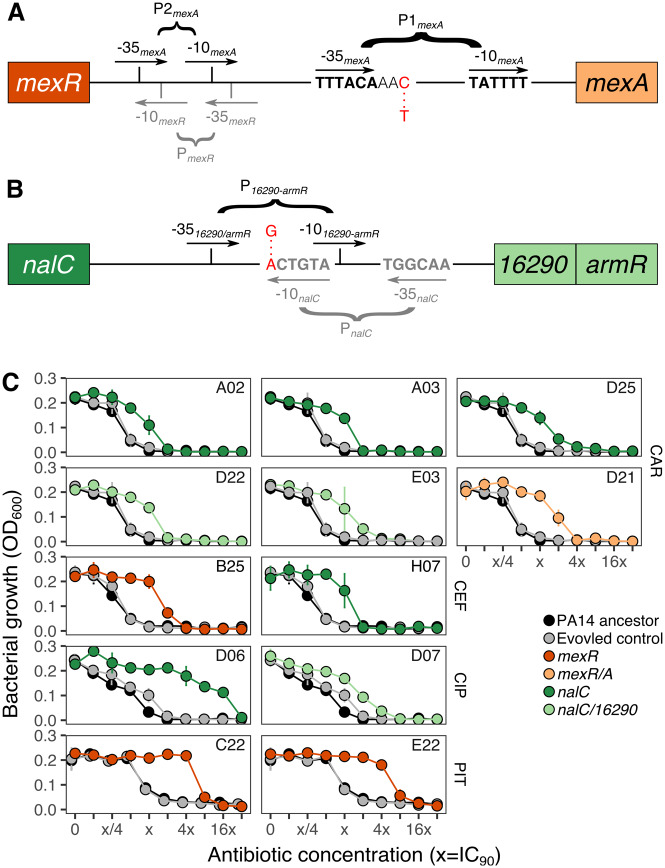
Intergenic variants of efflux pump and/or their regulatory genes lead to changes in resistance in monotherapy treatments. Illustration of the identified intergenic variants within (A) mexR/A and (B) nalC/16290-armR. The variants are highlighted in red letters, whereas promoters are given in black or gray for the genes upstream and downstream of the intergenic regions. The mexR/A intergenic region includes three promoters: PmexR (gray), and two active promoters for mexA, P1mexA and P2mexA (black). We found a C->T substitution two bases downstream of the −35 site of P1mexA. Two promoters are found in the intergenic region of nalC/16290-armR, influencing expression of either of the two genes. We found an A->G substitution directly at the −10 site of PnalC which also overlaps with the −10 site of P16290-armR. For details, see supplementary table S1, Supplementary Material online. The schematics were adapted from Evans et al. (2001) and Starr et al. (2012), respectively. Dose–response curves (C) show bacterial growth (measured as OD600) after 12 h of incubation at 37 °C in several concentrations following a 2-fold increase of the IC90 (the concentration inhibiting 90% or more of growth) of CAR, CEF, CIP, and PIT (from top to bottom). Twelve populations having a single variant in either the coding efflux regulators mexR or nalC (dark orange or dark green circles, respectively), or their corresponding intergenic regions (light orange or light green circles, respectively) were evaluated. The PA14 ancestor (black circles and solid line) and a randomly selected evolved control (gray circles and solid lines) were measured in parallel. All of the populations shown in (C) have no additional variants, and thus, any change in resistance is associated with the identified variant. The lab ID of each population is embedded within each panel; see table 1 for more details. Abbreviations: CIP, ciprofloxacin; CEF, cefsulodin; CAR, carbenicillin; PIT, piperacillin+tazobactam.
We found 12 populations with a single variant in nalC, mexR, or within their intergenic regions adapted to four different monotherapies (table 1). We then assessed to what extent the single genomic change would lead to a change in resistance against the antibiotic toward which they were selected during experimental evolution (fig. 4C). One of these populations had a single variant in the intergenic region of mexR/A and was adapted to CAR (Population D21; fig. 4C). This single variant was sufficient to cause a 4× increase in resistance against this drug, relative to the PA14 ancestor (i.e., 4× of the concentration inhibiting >90% of growth, IC90; fig. 4C). Three additional populations with a single variant in mexR had a 4× and 16× increase in resistance against CEF and PIT, respectively (B25, C22, and E22; fig. 4C). We also identified three populations with a single variant in the nalC/16290-armR intergenic region adapted to the CAR and CIP monotherapies (D22, E03, and D07; fig. 4C). These populations showed resistance increases of 2–8× of the IC90 of CAR, and 8× of that of CIP relative to the PA14 ancestor (fig. 4C). We additionally tested five populations adapted to CAR, CEF, and CIP (A02, A03, D25, H07, and D06; fig. 4C), each with a single variant in nalC. They all showed an increase in resistance between 2× and 8× for CAR, 2× against CEF, and 32× against CIP.
We identified ten additional populations, which adapted to various antibiotic combinations and also only had a single variant in their genomes: either in an efflux regulator or within the corresponding intergenic region (table 1). We evaluated the growth characteristics of these variants in a grid of concentrations of the two drugs (i.e., checkerboards), toward which they were selected during the evolution experiment, and compared the result with that of the PA14 ancestor and a randomly chosen evolved control from one of the drug-free treatments (fig. 5). In general, almost all considered variants caused increased growth against the tested combinations, irrespective of the location of the variant (intergenic vs. coding; fig. 5). In detail, two populations with mexR variants were isolated from combination treatments of CIP+CAR and CIP+CEF (D14 and B16; fig. 5A and B), whereas three populations with mexR/A intergenic variants came from three combination treatments (D16, B14, and H13; fig. 5A, B, and E). Both types of variants led to an increase in growth across the checkerboard compared with those of the PA14 ancestor and the evolved control (fig. 5). We further characterized three populations with a single nalC variant from combination treatments of CIP+CAR and CAR+PIT (D17, E11, and E12; fig. 5A and C), and one population from the CEF+PIT treatment with an intergenic variant in nalC/16290-armR (fig. 5 and supplementary table S2, Supplementary Material online). As above, these variants similarly increased growth across the checkerboards, irrespective of the location of the variant.
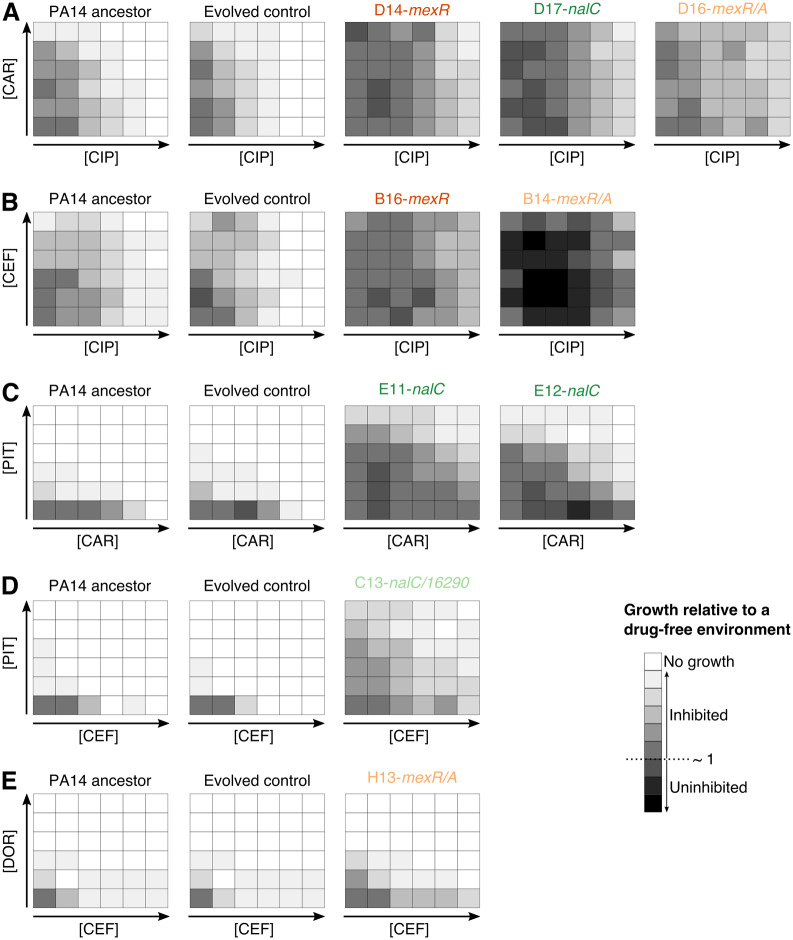
Intergenic variants increase resistance against multidrug treatments in Pseudomonas aeruginosa. Checkerboards (A–E) of selected populations against CIP+CAR (A), CIP+CEF (B), CAR+PIT (C), CEF+PIT (D), and CEF+DOR (E). Each panel shows growth after 12 h of incubation at 37 °C across a grid of increasing concentrations of two drugs (i.e., checkerboards). The bottom-left corner in each checkerboard represents the no-drug treatment, whereas the bottom right and the top left corners show the IC90 of each drug for the ancestral PA14 strain. White indicates no growth, whereas darker shades highlight growth and black uninhibited growth. The lab ID of the selected populations is indicated on top of each panel and those with variants in the coding genes mexR and nalC are highlighted in dark orange or green, respectively. The population with variants within intergenic regions of mexR or nalC are, respectively, indicated in light orange or green. Abbreviations: CIP, ciprofloxacin; DOR, doripenem; CEF, cefsulodin; CAR, carbenicillin; PIT, piperacillin+tazobactam.
Our checkerboard analysis was designed to assess whether the populations with a single variant showed a general increase in resistance against the drug combination, but not whether there may have been a change in interaction type in the evolved variants. Interestingly, however, a few evolved populations may appear to show a modulated resistance distribution across the checkerboard, possibly indicating a change in interaction type (e.g., possibly populations E11 or C13, fig. 5C and D). The presence of such changes in resistant variants is unusual and not well understood; it implies that bacterial genetic changes alter the exact mode of action of the two combined drugs, as previously evaluated in E. coli, Enterococcus faecalis, and other bacteria and explored with the help of mathematical models (Chait et al. 2007; Wood et al. 2014; Kavčič et al. 2020), thus clearly deserving further attention in P. aeruginosa.
Taken together, we conclude that variants in both of the identified intergenic regions—nalC/16290-armR and mexR/A—were sufficient to cause a similar increase in resistance against distinct monotherapies and combinations as those observed in coding regions, thus highlighting the adaptive potential of intergenic variants in P. aeruginosa.
Adaptation to Sublethal Drug Levels Does Not Lead to Evolutionary Trade-Offs
Adaptation to a given environment can lead to an evolutionary trade-off, whereby the organism is less fit when the environment changes (Kussell 2013). This effect has been suggested to be of importance in the context of drug-resistant microbes, as they have been shown to be less adapted to drug-free environments relative to their ancestral sensitive cells (Melnyk et al. 2015). By exploiting this property, adaptive cancer therapy advocates for the inclusion of periods with no treatment to enhance competition between sensitive and resistant cancerous cells (Enriquez-Navas et al. 2016). To test whether adaptation to sublethal doses of antibiotic monotherapies and combinations can lead to similar evolutionary trade-offs in our model pathogen, we grew all the sequenced populations in minimal media without any drugs for 20 h and measured the maximal growth rate for each population as previously explained (Roemhild et al. 2018).
The distribution of growth rates for the sequenced populations ranged between 0.6 and 1.1 relative to the ancestor PA14, with a mean and median close to 1 (fig. 6A). Within this range, 20% of the populations had relative growth rates <0.9, 47% had a value between 0.9 and 1, and 33% had values >1, reflecting that the majority of the populations had a similar growth rate to that of the ancestor PA14 (fig. 6A). We found a significant difference in relative growth rate among the different interaction types and the monotherapies (fig. 6B; Kruskal–Wallis, χ2 = 9.7, df = 3, P = 0.02). This effect was mainly driven by the high prevalence of populations in antagonistic combinations with relative growth rates close to one, whereas other treatments displayed a wider distribution (fig. 6B). Indeed, antagonistic combinations were significantly different to the monotherapies and additive combinations (supplementary table S2, Supplementary Material online). In sum, our data indicate that adaptation to sublethal doses of antibiotics, either in single or in multidrug treatments, does not affect growth rates under the examined drug-free environments, and thus does not seem to involve a general evolutionary trade-off, particularly when using antagonistic combinations. These findings appear to contrast with a previous study where P. aeruginosa was experimentally evolved to high levels of resistance against several single drugs (Barbosa et al. 2017). In this case, fitness costs in antibiotic-free environments were readily observed, but resistance levels were typically higher than those obtained here (>40 times higher, relative to a PA14 ancestor). We conclude that increasing drug concentrations (previous work) and continuous sublethal drug doses (this study) produce distinct selective environments that either leads or does not lead to a fitness trade-off during resistance evolution, respectively.
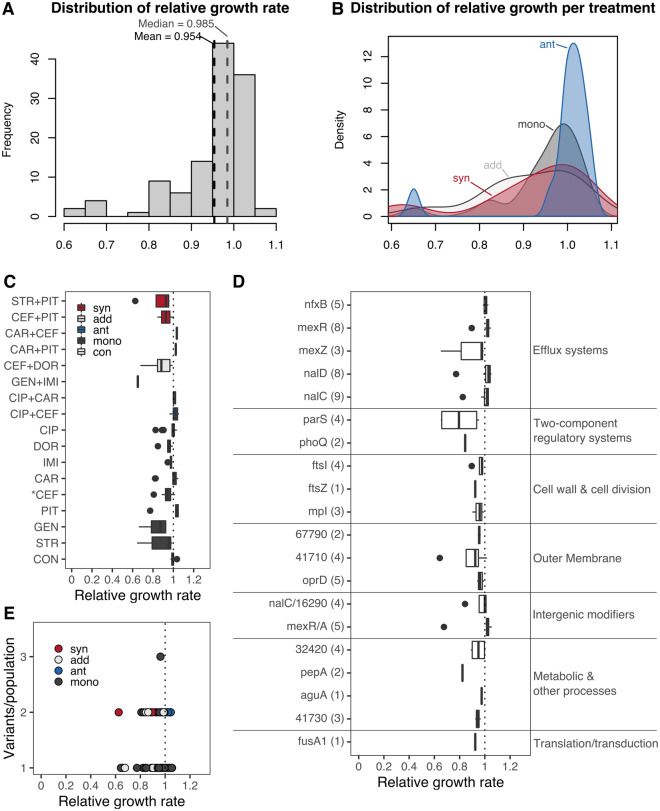
Sublethal levels of selection do not lead to growth reductions in other environments. The growth rate of each evolved population was measured under antibiotic-free conditions and compared with that of the PA14 ancestor. All populations were grown for 20 h with continuous optical density measures taken every 30 min. A sliding window approach was used to calculate the maximum growth rate for three colonies per population, each replicated six times. (A) The distribution of relative growth rates for all populations, with mean and median values highlighted by the black and gray-dotted vertical lines, respectively. (B) Kernel distributions of relative growth rate by treatment type; synergistic (syn, red), antagonistic (ant, blue), additive (add, light gray), and monotherapies (mono, dark gray). The average relative growth rate of each population grouped by treatment is shown in (C). The dotted line highlights the point of equality to the ancestor; values <1 indicate lower growth rates, whereas values above higher growth rates. Drug interaction type of the selected combinations is indicated in blue (antagonistic), red (synergistic), and light gray (additive), single-drug treatments are highlighted in dark gray, and the evolved controls are shown in white. Treatments significantly different from 1 after a Wilcoxon sum rank test and subsequent correction for multiple testing using FDR are indicated with an asterisk (see supplementary table S4, Supplementary Material online). (D) We selected populations with a single genomic variant and calculated the relative growth rate per gene. The number of populations with a variant in a given gene is indicated in brackets (Y axis). Genes are grouped by their functional information (right side) as inferred previously. No gene variant led to a significant gain or loss in fitness after a Wilcoxon sum rank test and subsequent correction for multiple testing using FDR (see supplementary table S5, Supplementary Material online). (E) Relationship between the number of variants observed in each population and their relative growth rate. Each point represents a population, and the color highlights the treatment type as indicated above. No significant correlation was observed for these variables (ρs = −0.08, P = 0.376). Abbreviations: CIP, ciprofloxacin; DOR, doripenem; IMI, imipenem; CEF, cefsulodin; CAR, carbenicillin; PIT, piperacillin+tazobactam; GEN, gentamicin; STR, streptomycin.
We next evaluated whether specific treatments led to stronger growth deficits in drug-free environments. We found a single treatment leading to significantly lower growth than the PA14 ancestor (P = 0.005): the CEF monotherapy (fig. 6C and supplementary table S3, Supplementary Material online). Three other monotherapies (STR, IMI, and DOR) and the CEF+DOR combination showed a statistical trend (P < 0.1) toward lower relative growth rates (supplementary table S3, Supplementary Material online), possibly indicating that some monotherapies more often lead to an evolutionary trade-off than drug combinations. Given that this tendency could be the result of variants arising in genes directly associated to the drug target, we asked if the observed relative growth rates were associated to particular genes. To analyze this hypothesis, we selected populations having a single variant in a given gene and determined whether they had a significant effect on relative growth rates. At the gene level, we found no particular gene leading to statistically significant alterations in fitness when grown in drug-free environments (fig. 6D and supplementary table S4, Supplementary Material online). However, we found functional groups of genes to be significantly different among each other (Kruskal–Wallis, χ2 = 29.1, df = 6, P < 0.001). Among the different functional groups, genes associated with efflux systems led to significantly (P < 0.05) higher relative growth rates than genes associated with two-component regulatory systems, membrane stability, and metabolism (fig. 6D andsupplementary table S5, Supplementary Material online). We additionally found a trend (P < 0.1) showing lower relative growth rates in two-component regulatory genes than variants in intergenic regions (fig. 6D andsupplementary table S5, Supplementary Material online). Finally, we determined whether there is an association between the obtained relative growth rates with the number of variants in each of the evolved populations. Yet, the obtained fitness reductions were not a consequence of the number of accumulated variants as we found no significant correlation between these two variables (fig. 6E). In sum, our data suggest that adaptation to sublethal doses of most monotherapies and combinations does not strongly affect growth rate and thus does not incur an evolutionary trade-off in the examined drug-free environment.
To further assess this observation, we performed competition experiments between eight selected populations and a fluorescently labeled PA14dTomato reference strain in minimal media with and without antibiotics (fig. 7). The included evolved populations only had a single variant in either the coding or the intergenic region of efflux pump regulatory genes and half of them were from single-drug treatments and the other half from combination treatments of the previous evolution experiment. The competition experiments revealed a significant effect of the environment on fitness (no drug vs. with drug treatments; supplementary tables S6 and S7, Supplementary Material online). In detail, under no-drug conditions, we found no significant difference in competitive fitness between either of the populations and PA14dTomato (fig. 7 left panel and supplementary table S7, Supplementary Material online). In contrast, the previously evolved populations showed significantly higher competitive fitness over PA14dTomato in the presence of the relevant antibiotics (fig. 7 right panel and supplementary table S7, Supplementary Material online). Taken together, these results strongly suggest that adaptation to sublethal doses of single and combined antibiotics does not incur major competitive fitness costs in an environment without antibiotics, consistent with the above observations. These results were obtained irrespective of whether the relevant antibiotic environment consisted of a monotherapy or the combination of drugs and also irrespective of whether the tested populations had a single variant in the coding regions of efflux regulators (nalC or mexA) or in an associated intergenic region (mexR/A or nalC/16290-armR). It is important to note that potential costs of adaptation may still be present, but may then only be expressed under specific environmental conditions, which could for example include the gut of a human host or an intensive care unit within a hospital.
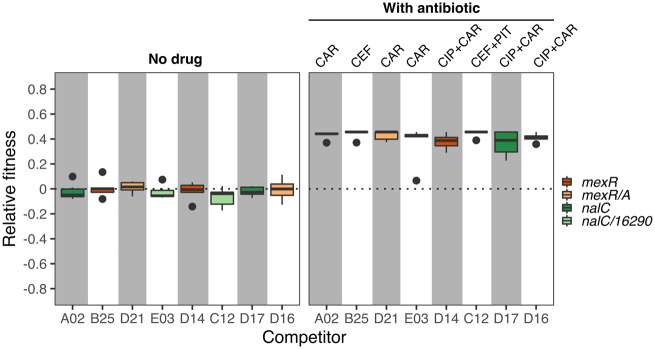
Sublethal levels of antibiotic selection do not lead to a loss of competitive fitness. We competed eight selected populations against a dTomato labeled PA14 (PA14dTomato). After 12 h of growth at 37 °C, we quantified the proportion of CFUs of each competitor relative to PA14dTomato. We then calculated a standardized relative fitness value (Y axis) by subtracting from each competitor the average proportion of the nonlabeled PA14 ancestor relative to the PA14dTomato reference strain for each environment, as obtained from the control competition treatment, which was run in parallel to the other competition experiments. A value of zero thus indicates an identical standardized relative fitness to the experimental control. The left panel shows the standardized relative fitness in minimal medium without drugs, and the right panel the standardized relative fitness in the presence of the relevant antibiotic treatment, which each competitor experienced during the previous experimental evolution (indicated at the top of the figure). The included populations had a single variant in either the coding efflux regulators mexR or nalC (dark orange or dark green boxes, respectively), or their corresponding intergenic regions (light orange or light green boxes, respectively). For a statistical analysis, see supplementary tables S6 and S7, Supplementary Material online. Abbreviations: CIP, ciprofloxacin; CEF, cefsulodin; CAR, carbenicillin; PIT, piperacillin+tazobactam.
Discussion
Our study provides a comprehensive analysis of the genomic changes underlying experimental resistance evolution against antibiotic combinations in the opportunistic human pathogen P. aeruginosa. We found that the regulation of efflux pumps is P. aeruginosa’s main mechanism of resistance against sublethal doses of single and combined drugs. Unexpectedly, our experimental analysis of the variants demonstrated that single changes in intergenic regions of efflux regulators lead to similar increases in drug resistance than the changes in the adjacent coding genes. In several cases, the evolved populations had no additional variants, thus highlighting that intergenic variants in this context are adaptive. Furthermore, the identified variants in both intergenic and coding regions of efflux systems are not associated with reduced competitive fitness and thus evolutionary trade-offs in drug-free environments. The higher potency of combination treatments over monotherapies is often (explicitly or implicitly) assumed to rely on both a lower likelihood of resistance to emerge and also a comparatively higher adaptation cost of such resistance against two drugs simultaneously. In contrast, our data highlight that apparently cost-free resistance against the combination readily emerges and spreads. This finding may imply that the commonly used combination treatments do not impose the intended very high selective constraints that impede or prevent resistance.
Our results revealed a strong level of evolutionary parallelism at the gene level, whereby efflux regulation was repeatedly identified as the favored resistance mechanism across monotherapies, synergistic, antagonistic, and additive combinations alike. This pattern may suggest that the selective constraints imposed by these distinct treatment types do not vary. This interpretation, however, is in stark contrast with the phenotypic outcomes of the different evolution treatments (fig. 8; see also Barbosa et al. 2018). In detail, the different treatment types significantly differed in the resulting effects on population extinction and adaptation rates. For instance, two of the three considered synergistic combinations led to high levels of population extinction and fast rates of adaptation, whereas the third synergistic combination had fewer extinction events and a slower rate of adaptation (fig. 7). Yet, in all three cases, the surviving populations had variants in either mexR, nalC, nalD, or the mexR/A and nalC/16290-armR intergenic regions, which are all involved in the regulation of the MexAB-OprM and can extrude several β-lactam drugs (Muller et al. 2011). This could explain why adaptation was fast in the combinations of two β-lactam drugs (CEF+PIT and CAR+CEF), since a single variant can confer simultaneous resistance to both antibiotics. However, if a single mutation is sufficient, then why did these combinations lead to high levels of extinction? A previous study in methicillin-resistant Staphylococcus aureus (MRSA), showed that synergistic combinations of β-lactams can suppress the evolution of resistance via allosteric interactions between the exact drugs’ target (Gonzales et al. 2015). Such incompatibilities could then drive populations into undesired evolutionary paths where population size is too drastically reduced to permit emergence of one of the few favorable mutations, ultimately leading to population extinction.
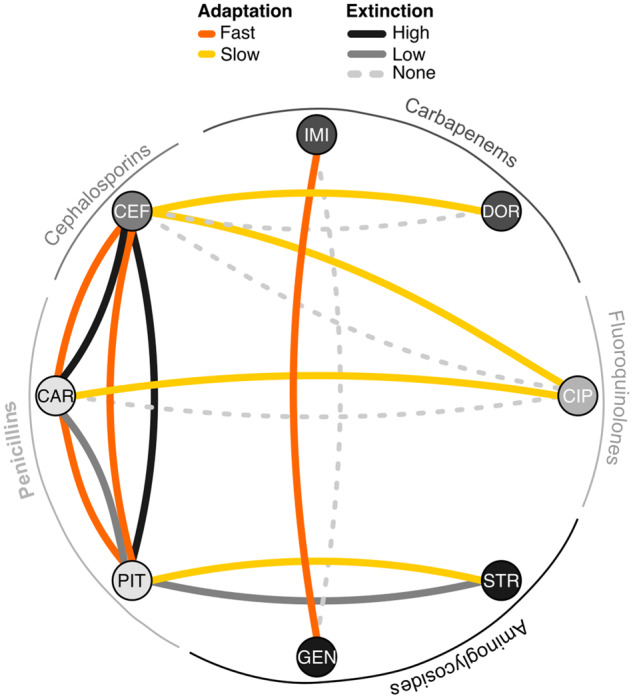
Evolutionary network of drug combinations. For each pair of nodes, there are two links: One highlighting the rate of adaptation of surviving populations adapted to the corresponding combinations, indicating fast or slow adaptation (orange or yellow lines, respectively). The second link shows the level of extinction observed in each combination: none (light gray-dashed line), low (solid gray lines), or high (solid black lines). This qualitative categorization is based on the antibiotic combination efficacy (ACE) networks generated previously by Barbosa et al. (2018). Abbreviations: CIP, ciprofloxacin; DOR, doripenem; IMI, imipenem; CEF, cefsulodin; CAR, carbenicillin; PIT, piperacillin+tazobactam; GEN, gentamicin; STR, streptomycin.
In the slowly adapting populations in the synergistic combination STR+PIT, the situation appears to be different. We have previously shown that mutations in the efflux regulator mexZ confers resistance to STR, but concomitantly leads to enhanced sensitivity to PIT (Barbosa et al. 2017). Similarly, variants in mexR facilitate resistance to the β-lactams but also promote hypersensitivity to several aminoglycosides (Barbosa et al. 2017). Such variants were indeed seen in the monotherapies, but not among the combinations, which showed additional mutations in genes such as fusA1, wbpM, and parR, which have been associated with resistance against either β-lactams or aminoglycosides (fig. 3). Thus, reciprocal collateral sensitivity, unidirectional resistance mediated by variants in nalD (conferring resistance only against the β-lactams), and the requirement of additional stabilizing mutations could have jointly accounted for the observed slow adaptation rates and low levels of extinction. Likewise, the presence of CIP in some of the antagonistic combinations is likely to have produced unidirectional collateral effects (Barbosa et al. 2017) that can similarly slow down adaptation to these environments despite the presence of variants in efflux regulators of the MexAB-OprM pump that can extrude both β-lactams and CIP (figs. 4C and 5). Altogether our results emphasize that the genetic mechanisms of resistance in P. aeruginosa are not necessarily determined by the interaction characteristics of the combined drugs (i.e., synergistic vs. antagonism vs. additive), but rather by the specific properties of the used drugs and the potential for evolved collateral sensitivity between those drugs.
Our work revealed a high potential effect of intergenic variants on resistance evolution. In particular, we found several cases in which the surviving populations had a single variant in intergenic regions that caused a significant increase in drug resistance. This finding is unexpected, because such variants, as well as nonsynonymous mutations, have been traditionally thought to be stochastic and usually neutral. However, a recent study with P. aeruginosa PAO1 showed that intergenic variants are common during adaptation and beneficial by changing the transcriptional activity of essential genes associated to several cellular functions, including host interactions, metabolism, and antibiotic susceptibility (Khademi et al. 2019). Similar results were found in another study evaluating the distribution of fitness effects of nonsynonymous variants in P. fluorescens (Lebeuf-Taylor et al. 2019). Here, we now demonstrated that intergenic variants can lead to similar levels of resistance as variants in adjacent coding genes, thus emphasizing that variants in these regions can have an adaptive effect. A future analysis of the role of such variants in clinical strains would be of importance, particularly as we also showed that these intergenic variants do not have a strong effect on growth rates and competitive fitness in the absence of antibiotics. Thus, these changes could mediate resistance without incurring any fitness costs, potentially reducing the loss of resistance mutations during drug-free periods.
Diverse host-specific effects, and pharmacokinetic and dynamic differences between drugs can lead to imperfect penetration (and thus lower, unintended concentrations) of antibiotics (Müller et al. 2004). In the context of antibiotic combinations, imperfect penetration can lead to periods of monotherapy or to sanctuaries where bacteria experience low drug concentrations and rapidly evolve resistance in a step-wise manner (Moreno-Gamez et al. 2015). Our experimental conditions approximate such situations in vitro as constant sublethal concentrations were used. Indeed, we found seemingly cost-free variants in efflux regulators leading to resistance increases between 2× and 16× of the IC90 of the PA14 ancestor in both single and multidrug environments, thus enabling P. aeruginosa to increase resistance while sustaining competitiveness with sensitive cells. Such an evolutionary advantage represents a highly unwanted outcome, and thus calls for further investigation into alternatives that would limit adaptation by means of alteration of efflux pumps. Recent studies advocate for the use of antimicrobial combinations that include efflux pump inhibitors, in analogy to the joint application of β-lactam drugs and β-lactamase inhibitors (Lomovskaya et al. 2001; Baym, Stone, et al. 2016; Idowu et al. 2019; Mitchell et al. 2019; Sy et al. 2019). The pervasiveness of variants in efflux regulators that we found in this study further supports these ideas.
Conclusion
Based on a systematic evaluation of the genomic underpinnings of resistance evolution in sublethal multidrug environments, we conclude that efflux regulation is the favored mechanism of resistance in P. aeruginosa. The evolutionary paths toward efflux-based resistance are selectively advantageous, because it appears to lack any adaptation costs, resulting in high competitiveness toward drug-sensitive variants, even in the absence of antibiotics. The contribution of such cost-free resistance variants to the spread of antibiotic resistance among clinical pathogens is largely unknown and clearly requires further research.
Materials and Methods
Selection of Populations
We characterized a total of 127 populations of P. aeruginosa, which we previously obtained from an evolution experiment using sublethal doses of single drugs (monotherapies) or combinations (Barbosa et al. 2018). Of these, 83 were adapted to eight monotherapies, 35 survived eight different antibiotic combinations and eight were adapted to drug-free M9 minimal medium. We used the P. aeruginosa PA14 ancestor from which the experiment was started as a reference and control in subsequent experiments as well. We selected the populations in order to cover monotherapies with antibiotics from different classes as well as combinations of the three main interaction types (i.e., synergistic, antagonistic, or additive interactions; fig. 1). The number of populations per treatment varies depending on the total number of populations that survived the experimental treatment. We thawed all populations in fresh minimal M9 medium supplemented with 2% glucose, 1% casamino acids, and the respective concentration of the antibiotic treatment they were selected on. We incubated all populations under continuous shaking for 16–20 h at 37 °C. We extracted DNA from the grown cultures using the DNeasy Blood & Tissue Kit (Qiagen, Hilden, Germany) according to manufacturer’s recommendations for Gram-negative bacteria. High-quality DNA from all 127 populations was sent to the Competence Center for Genomic Analysis (CCGA) Kiel for whole-genome sequencing using the Illumina HiSeq paired-end technology (Bentley et al. 2008). The included material encompassed a set of combination treatments and the corresponding monotherapies with distinct properties (e.g., synergistic, antagonistic, or additive combinations; Barbosa et al. 2018), but not all possible combinations, which could have been produced from the considered monotherapies. For this reason, our general analysis of genomic adaptations focuses on a qualitative comparison of differences among treatment types (combinations vs. monotherapies) or among combinations with distinct properties (synergistic, additive, or antagonistic).
Genomic Analysis
We modified our analysis pipeline encoded in serial bash scripts used previously for the genomic analysis of experimentally evolved P. aeruginosa PA14 populations (Barbosa et al. 2017). Briefly, we trimmed reads and filtered for quality using Trimmomatic (Bolger et al. 2014). We then mapped the obtained reads to the published P. aeruginosa_UCBPP_PA14_uid57977 reference genome (ftp://ftp.ncbi.nih.gov/genomes/Bacteria/Pseudomonas_aeruginosa_UCBPP_PA14_uid57977, last accessed February 2020), using bowtie2 and samtools (Li et al. 2009; Langmead and Salzberg 2012). We used IGV (Integrated genome viewer, Broad Institute; www.broadinstitute.org/software/igv/, last accessed February 2020) to visually inspect for low-quality areas. We removed duplicate regions for SNP and SV calling using MarkDuplicates in Picardtools (Broad Institute, Picard Toolkit 2019). To call SNPs and small indels above a threshold frequency of 0.1 and base quality >20, we employed both frequentist and heuristic methods using, respectively, SNVer and VarScan (Wei et al. 2011; Koboldt et al. 2012). To identify larger indels and other SVs, we used Pindel and CNVnator (Ye et al. 2009; Abyzov et al. 2011). The resulting output files were filtered for duplicates, ancestral variants, and variants found in the evolved controls. We subsequently combined the approaches in snpEff (Cingolani et al. 2012), the Pseudomonas database (Winsor et al. 2016), and Bactome (Hornischer et al. 2019) for the functional annotation of variants. Further statistical and visualization analysis were performed in the R platform (R Core Team). All the genomic data can be accessed on the NCBI-SRA database with the accession number PRJNA542819.
Dose–Response Curves
We selected some of the sequenced populations, the PA14 ancestor, and a randomly chosen evolved control adapted to M9 minimal medium for further phenotypic analysis using dose–response curves against several drugs, as described before (Barbosa et al. 2017, 2018). Briefly, we grew the populations overnight (ON) in M9 minimal medium supplemented with 2% glucose and 1% casamino acids, diluted the cells 50× in fresh medium, and incubated them for 3 h at 37 °C. We then assessed growth by measuring optical density (OD600) and adjusted cultures to a final OD of 0.07 up to 0.085 (approximately equivalent to 106 CFU/ml). To measure growth in the presence of the different antibiotics, we added the bacteria to fully randomized 96-microtiter plates containing nine 2-fold increases of the concentration required to inhibit growth of the PA14 ancestor by 90% (IC90), plus a no drug control. We included three technical replicates for each concentration and additionally six wells without drugs or bacteria. We evaluated all populations in parallel by combining three populations per plate, resulting in a total of five plates for the 13 selected populations. We then incubated the plates with constant shaking for 12 h at 37 °C. At the end of the growth cycle, we measured bacterial growth (OD600) using a BioTek plate reader.
Checkerboards
To measure resistance in combination environments, we applied a checkerboard approach for selected evolved populations, the PA14 ancestor, and a randomly chosen, evolved control, as previously described (Barbosa et al. 2018). Briefly, we considered five concentrations of each antibiotic in a pair, including a no-drug control, and distributed them randomly across a 96-microtiter plate in duplicate. We cultivated the selected populations as described above for the dose–response curves. On each plate, we included two populations, with one always corresponding to the PA14 ancestor, and the other to an evolved population. We evaluated each plate in triplicate. To assess growth, we took OD600 measurements in a BioTek plate reader after 12 h of incubation at 37 °C with constant shaking.
Maximum Growth Rate
We calculated maximum exponential growth rates of the evolved populations, the PA14 ancestor, and eight evolved controls adapted to M9 medium from growth curves in drug-free media, using a sliding window approach, as described previously (Roemhild et al. 2018). We diluted ON cultures 50× from early stationary phase into 96-microtiter plates incubated at 37 °C with continuous shaking inside a BioTek plate reader for 20 h (100 µl total volume). We determined growth by using OD600 data obtained every 30 min during the whole incubation period. Finally, we calculated the maximum growth rate from log-transformed OD data using sliding windows of 1 h and calculating the slope at each interval within the window.
Competition Experiments
Eight selected populations from the evolution experiments were competed against a fluorescently labeled variant of the ancestral PA14. This PA14 reference strain contained a chromosomally integrated dTomato gene (PA14dTomato), generated using the miniTn7 method (Choi and Schweizer 2006). For this test, we focused on a selection of the previously characterized evolved populations that carried only a single mutation—either in a coding or in an intergenic regions, thus allowing us to assess the importance of intergenic variants for adaptation. We considered two general conditions: minimal medium without any drugs, and minimal medium with the particular antibiotic treatment, which the selected populations previously experienced during experimental evolution. This design allowed us to assess competitive fitness under the relevant selective conditions of the previous evolution experiment and also under related conditions, consisting of exactly the same medium without the antibiotics. For the competition experiments, all populations were grown as previously described, and then mixed at a 1:1 ratio with PA14dTomato to initiate competitions. Each competition was replicated six times. After 12 h of growth at 37 °C, each replicate was serially diluted, plated onto LB agar, and grown for 24 h at 37 °C, followed by quantification of labeled versus unlabeled CFUs under a fluorescence dissecting microscope (Leica M205FA microscope). To determine fitness differences, we calculated the proportion of nonfluorescent CFUs relative to the total number of CFUs per replicate. As a control, we also competed in parallel and using exactly the same conditions as above, the nonlabeled PA14 ancestor from the previous evolution experiments against the labeled PA14dTomato. We then used the average of the resulting PA14/PA14dTomato ratios to standardize all other ratios, in order to adjust for any potential growth difference in the labeled strain.
Acknowledgments
We would like to thank the Schulenburg group for discussions and feedback and G. Hemmrich-Stanisak and M. Vollstedt from the Institute of Clinical Molecular Biology in Kiel for support of genome sequencing. We acknowledge financial support from the German Science Foundation (DFG) via individual grant SCHU 1415/12 (to H.S.) and Germany’s Excellence Strategy—EXC 22167-39088401 (Excellence Cluster Precision Medicine in chronic Inflammation; H.S., P.R.). The research was further funded through the Leibniz Science Campus Evolutionary Medicine of the Lung (EvoLUNG; H.S., C.B.), the International Max-Planck-Research School for Evolutionary Biology (scholarship to C.B.), and the Max-Planck Society (fellowship to H.S.).
Data Availability
All genomic data are available from the NCBI-SRA database under the accession number PRJNA542819. All phenotypic data are provided in supplementary data file, Supplementary Material online.