 Recapitulating Evolutionary Divergence in a Single Cis-Regulatory Element Is Sufficient to Cause Expression Changes of the Lens Gene Tdrd7
Molecular Biology and Evolution


- Altmetric
Mutations in cis-regulatory elements play important roles for phenotypic changes during evolution. Eye degeneration in the blind mole rat (BMR; Nannospalax galili) and other subterranean mammals is significantly associated with widespread divergence of eye regulatory elements, but the effect of these regulatory mutations on eye development and function has not been explored. Here, we investigate the effect of mutations observed in the BMR sequence of a conserved noncoding element upstream of Tdrd7, a pleiotropic gene required for lens development and spermatogenesis. We first show that this conserved element is a transcriptional repressor in lens cells and that the BMR sequence partially lost repressor activity. Next, we recapitulated evolutionary changes in this element by precisely replacing the endogenous regulatory element in a mouse line by the orthologous BMR sequence with CRISPR–Cas9. Strikingly, this repressor replacement caused a more than 2-fold upregulation of Tdrd7 in the developing lens; however, increased mRNA level does not result in a corresponding increase in TDRD7 protein nor an obvious lens phenotype, possibly explained by buffering at the posttranscriptional level. Our results are consistent with eye degeneration in subterranean mammals having a polygenic basis where many small-effect mutations in different eye-regulatory elements collectively contribute to phenotypic differences.
Introduction
Colonization of new habitats, such as the underground environment, is often linked to morphological, physiological, and behavioral adaptations that confer advantages in the new habitat. Among mammals, the naked mole rat, blind mole rat (BMR), star-nosed mole, and cape golden mole comprise four distinct lineages that have independently evolved adaptations to live in such constantly dark (or poorly illuminated) environments. One of the most striking adaptations of these subterranean mammals is the reduction or loss of the visual system, evident by the presence of a degenerated lens and retina, as well as a reduction of the visual-processing area of the brain (Sweet 1909; Sanyal et al. 1990; Cooper et al. 1993a, 1993b; Catania 1999; Hetling et al. 2005; Nevo 2007; Němec et al. 2008).
Genetically, the degeneration of the visual system is related to mutations in eye-related genes. Previous studies that investigated the genomes of subterranean mammals showed that many genes involved in eye development and function are diverged or lost in these species (Kim et al. 2011; Emerling and Springer 2014; Fang, Nevo, et al. 2014; Fang, Seim, et al. 2014; Prudent et al. 2016; Sharma and Hiller 2020). Naturally occurring or laboratory-induced gene-inactivating mutations in some of these genes in humans or mice cause malformation of eye structures and impaired vision (Hansen et al. 2007; Abd El-Aziz et al. 2008; Makiyama et al. 2014; Emerling et al. 2017; Moore et al. 2018), suggesting that the gene losses observed in subterranean mammals contributed to the evolution of degenerated eyes.
In addition to the widespread loss of genes, recent studies discovered divergence in many eye regulatory elements (Partha et al. 2017; Langer et al. 2018; Roscito et al. 2018; Langer and Hiller 2019). In particular, genome-wide analysis of conserved noncoding elements (CNEs) revealed that CNEs with preferential sequence divergence in subterranean mammals are significantly associated with eye-related genes and significantly overlap regulatory elements that are active in developing and adult eyes of mice or humans (Roscito et al. 2018). Sequence divergence in these CNEs also resulted in a large-scale divergence of binding sites of eye-related transcription factors (TFs) (Langer et al. 2018; Roscito et al. 2018; Langer and Hiller 2019). Together, this suggests that widespread divergence in both genes and in cis-regulatory elements may have contributed to the degeneration of eye structures in subterranean mammals, leading to a greatly impaired visual system.
In protein-coding genes, premature stop codon, frameshift, or other reading frame-inactivating mutations can be considered as equivalent if they result in a nonfunctional protein. This makes it possible to use phenotypes observed in mouse knockout lines or human individuals with inactivated genes to infer the effect of evolutionary gene losses, even though the identity of the underlying inactivating mutations is different. In contrast to genes, where inactivating mutations are often predictable, the effects of mutations in cis-regulatory elements are less clear and mostly unexplored. In particular, it is hard to predict how, and to what extent, mutations in regulatory elements affect its activity and how such activity changes in turn affect the expression of its target gene. Consequently, to understand the effect of mutations in a regulatory element in vivo, it is necessary to precisely recapitulate the naturally occurring mutations on a model organism and quantify the consequences at the molecular and morphological level. Considering the importance of cis-regulatory changes for morphological evolution (Wray 2007; Carroll 2008), characterizing the effect of naturally occurring mutations in regulatory elements in vivo is crucial to understand the evolution of phenotypic traits.
To explore the effect of regulatory divergence on eye degeneration in subterranean mammals, we focused on a lens regulatory element near Tdrd7 (tudor domain-containing 7), a gene essential for lens development and spermatogenesis. We used CRISPR–Cas9 to precisely replace the mouse sequence of this regulatory element by the BMR sequence and characterized the molecular and morphological effects of the mutations observed in the BMR on lens development and function.
Results
Divergence in a Lens Regulatory Element Near Tdrd7
In previous studies, we used two comparative genomics approaches to identify and associate sequence and TF-binding site divergence in CNEs to the vision-impaired phenotype of the subterranean BMR, naked mole rat, cape golden mole, and star-nosed mole (Langer et al. 2018; Roscito et al. 2018). Both screens detected significantly higher sequence and binding site divergence in subterranean mammals in a locus that comprises two CNEs located 97 bp from each other (fig. 1A and B). These CNEs are part of a larger 339 bp region that evolves under constraint according to GERP++ (Davydov et al. 2010). Higher sequence divergence is evident in the star-nosed mole, cape golden mole and, most prominently, in the BMR (Nannospalax galili), which exhibits a 197 bp deletion (fig. 1A and B).

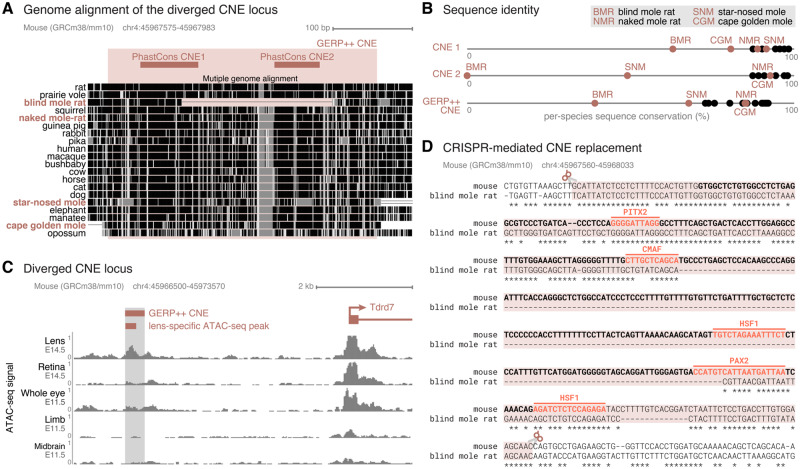
Divergence in a lens regulatory element near Tdrd7 in subterranean mammals. (A) Multiple genome alignment, showing the two diverged CNEs detected with PhastCons and the larger CNE detected with GERP++ that encompasses both PhastCons CNEs. In the multiple genome alignment, aligning sequence is visualized by black and gray boxes. The darker the color of the box, the higher is the sequence similarity in the alignment. The subterranean vision-impaired species are highlighted in red. (B) Sequence divergence plot of the conserved elements shown in (A). The x-axis shows the percent identity between the CNE sequence of a species and the reconstructed placental mammal ancestor. Subterranean mammals are represented by red dots, all other mammals by black dots. The star-nosed mole, cape golden mole and, most prominently, the BMR exhibit more diverged CNE(s) compared with other mammals. (C) Overview of the larger genomic context, showing the GERP++ CNE, the Tdrd7 gene located ∼4.5 kb downstream and ATAC-seq signal tracks of different developing mouse tissues. The CNE overlaps an ATAC-seq peak observed in lens of E14.5 mice. (D) Alignment between mouse and BMR sequence encompassing the GERP++ CNE. The mouse CNE sequence is in bold. The sequence highlighted by the red box corresponds to the genomic mouse sequence that was replaced by the orthologous BMR sequence with CRISPR–Cas9. Predicted TF-binding motifs are highlighted in the mouse sequence.
In mouse, this larger CNE overlaps many epigenetic marks derived from embryonic and adult mouse eye tissues (fig. 1C). In particular, we observe ChIP-seq peaks for eye TFs such as OTX2, CRX, and NRL (Corbo et al. 2010; Hao et al. 2012; Samuel et al. 2014). In addition, the mouse sequence has predicted binding sites for TFs relevant for eye development, such as PITX2, CMAF, HSF1, and PAX2, three of those sites overlapping the large BMR deletion (fig. 1D). Furthermore, this region overlaps ATAC-seq and DNAseI hypersensitivity peaks in adult eye tissues (Encode Project Consortium 2012; Mo et al. 2016; Zhao et al. 2019) as well as a prominent lens-specific ATAC-seq peak in developing mouse lens (Roscito et al. 2018) (fig. 1C). Together, this indicates that the CNE may function as a regulatory element in lens tissue.
This CNE is located ∼4.5 kb upstream of the conserved transcription start site of Tdrd7 (fig. 1C), a gene that is highly expressed in lens and testis (Hosokawa et al. 2007; Lachke et al. 2011; Tanaka et al. 2011). The encoded TDRD7 protein is a component of cytoplasmic ribonucleoprotein granules that are involved in the posttranscriptional control of genes critical for lens development and spermatogenesis (Lachke et al. 2011; Tanaka et al. 2011). Mouse studies showed that knock-down or loss-of-function mutations in Tdrd7 lead to lens malformation, cataracts, and glaucoma (Lachke et al. 2011). In addition, male Tdrd7 knockout mice are sterile due to an arrest in spermatogenesis (Tanaka et al. 2011). Human individuals carrying TDRD7 loss-of-function mutations also exhibit cataracts and azoospermia (Lachke et al. 2011; Tan et al. 2019). Thus, Tdrd7 is essential for normal lens development and function and spermatogenesis. Importantly, in contrast to divergence of the CNE sequence, Tdrd7 is intact in all subterranean mammals, including the BMR, likely because of its pleiotropic role in lens development and fertility.
The close proximity to a gene required for normal lens development, and the overlap with several epigenetic marks identified in different eye tissues suggest that the genomic locus containing the diverged CNE may function as a regulatory element controlling Tdrd7 expression. Our observation that this CNE is highly diverged in a subterranean mammal with degenerated lenses makes this CNE a promising candidate to test whether the naturally occurring mutations have an effect on Tdrd7 expression and normal development or function of the lens. Furthermore, there is no other CNE that is diverged in subterranean mammals and overlaps epigenomic marks from eye tissues in a 500 kb window around the Tdrd7 promoter.
The Tdrd7 CNE Acts as a Transcriptional Repressor in Mouse Lens Cells
We first tested the mouse and BMR sequences for regulatory activity, using an in vitro dual luciferase reporter gene assay in a lens cell line. We cloned both sequences in the same genomic orientation with respect to the Tdrd7 promoter into a firefly luciferase vector, cotransfected this vector with a control renilla luciferase vector into lens cells, and measured firefly luciferase expression driven by the mouse and BMR sequences. This experiment revealed that the mouse sequence is indeed a regulatory element (fig. 2). Interestingly, the mouse sequence acts as a repressor element, as firefly luciferase expression was significantly below the expression obtained with a control vector that does not contain any sequence insert upstream of the promoter. The expression driven by the BMR sequence was also lower than the control vector expression, but was significantly higher than the mouse sequence. This observation suggests that sequence changes, including the larger deletion observed in the BMR sequence, result in a partial release of repressor activity.
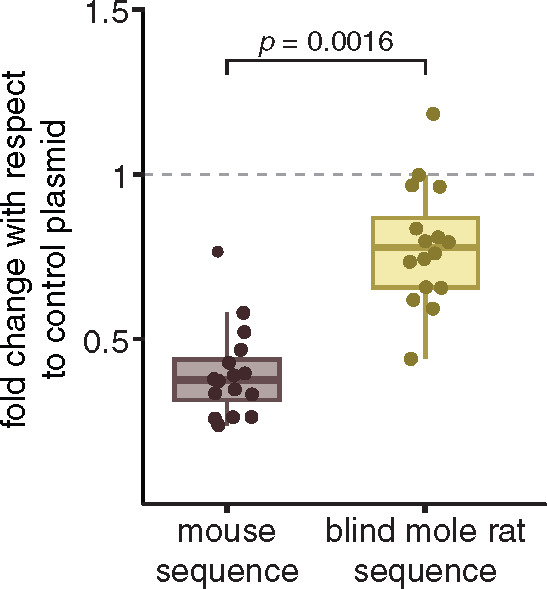
Partial loss of repressor activity of the BMR CNE sequence. In vitro dual luciferase assay shows that the BMR sequence (yellow) of the Tdrd7 CNE exhibits a significantly weaker repressor activity than the mouse sequence (purple). Expression values correspond to the fold change with respect to the control plasmid that lacks any sequence insert upstream of the promoter. The P value was computed with a two-sided Wilcoxon rank sum test.
Recapitulating Evolutionary Changes in This Lens Regulatory Element in Mouse
The observed partial loss of repressor activity of the BMR sequence predicts that replacing the mouse genomic sequence of this regulatory element by the BMR sequence may result in an upregulation of Tdrd7. To test this in vivo, we created a transgenic mouse line (referred hereafter as BMRrepr mice) in which we recapitulated the naturally occurring BMR mutations in this repressor element. To this end, we used CRISPR–Cas9 to precisely replace the 410-bp endogenous mouse sequence encompassing the lens regulatory element with the orthologous BMR sequence (fig. 1D). Compared with the luciferase assay, this approach allows us to assess the effect of the BMR mutations in the full genomic context with the native Tdrd7 promoter. We used C57BL/6J mice because the N strain already carries a mutation in the photoreceptor Crb1 gene, resulting in retinal degeneration (Mattapallil et al. 2012). BMRrepr mice were born at normal Mendelian ratios, were viable and showed no obvious phenotype. In particular, BMRrepr mice showed no abnormality in sperm quality compared with wild-type mice (supplementary table 1, Supplementary Material online) and exhibited normal fertility (supplementary table 2, Supplementary Material online), suggesting that this repressor element does not affect spermatogenesis and reproduction. In the following, we used the BMRrepr mouse line to quantify the molecular and morphological effects of evolutionary divergence in this lens regulatory element.
Tdrd7 Is Upregulated in the Developing Lens of BMRrepr Mice
To validate the partial loss of lens repressor activity of the BMR sequence in vivo and to test whether the observed repressor activity difference affects Tdrd7 expression in the lens, we used RT-qPCR to compare the expression of Tdrd7 in wild-type and homozygous BMRrepr mice at three different time points, embryonic day 14.5 (E14.5), postnatal day 1 (P1), and 3 months (adult). Since Tdrd7 has an additional role in spermatogenesis, we also quantified its expression in the testis and ovaries at the same time points.
We found that Tdrd7 is consistently and significantly upregulated in the lens of E14.5 and P1 BMRrepr mice in comparison with wild-type mice (fig. 3A). No differences in Tdrd7 expression were observed in adult lens. We also observed a small but marginally significant downregulation of Tdrd7 in adult but not developing testes, and a marginally significant upregulation in developing ovaries (fig. 3B). Despite Tdrd7 expression changes in reproductive organs, increased Tdrd7 expression is consistently observed in developing lenses of male and female mice, and the magnitude of Tdrd7 upregulation is substantially higher in the lens compared with the magnitude of Tdrd7 expression differences in testis and ovary (fig. 3A and B). Furthermore, the absolute expression level in ovaries of wild-type and BMRrepr mice is substantially lower than in the lens (fig. 3C and D). Together with the ATAC-seq data and luciferase reporter assays, this suggests that the major function of the regulatory element is to suppress Tdrd7 expression in the developing lens.
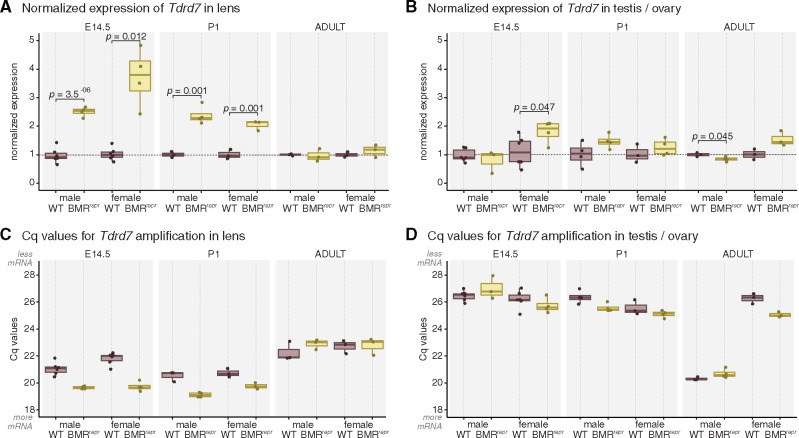
Tdrd7 is upregulated in developing lens of BMRrepr mice. (A, B) Comparison of Tdrd7 expression in developing and adult lens (A) and reproductive organs (B) of wild-type (purple) and BMRrepr mice (yellow) with RT-qPCR. The strongest difference is a more than 2-fold upregulation of Tdrd7 in developing lens of BMRrepr mice. Expression values were normalized by the housekeeping gene Rpl13a and by the levels of wild-type mice. Each data point is a biological replicate. P values were computed with a two-sided t-test. (C, D) Comparison of Cq values indicate that Tdrd7 mRNA is more abundant in the lens and adult testis than in the developing testis or ovary.
BMRrepr Mice Have No Obvious Lens Phenotype
Knock-down and loss-of-function mutations in Tdrd7 have been shown to impair normal lens morphology and function (Lachke et al. 2011; Tanaka et al. 2011), but the morphological effects of overexpression of Tdrd7 have not yet been investigated. Therefore, we analyzed whether the observed increase in Tdrd7 expression in the developing lens of homozygous BMRrepr mice affects lens function and morphology.
We first investigated whether lenses of adult BMRrepr mice exhibit signs of cataracts, a clouding of parts of the lens caused by aggregation of lens proteins (Remington 2012). To this end, we carefully dissected lenses of wild-type and BMRrepr mice, imaged them under darkfield illumination and quantified opaque cataract aggregates in the core of the lens, which is the only place where we observed such aggregates (fig. 4A). As shown in figure 4B, we found that BMRrepr mice have a slightly higher number of cataract aggregates compared with wild-type mice (average 6.06 vs. 4.47; Wilcoxon two-sided rank test P value of 0.18). The size of cataract aggregates is slightly lower in BMRrepr compared with wild-type mice (average 14.2 µm vs. 15.5 µm; Wilcoxon two-sided rank test P value of 0.33). To test whether the subtle difference in cataract aggregate number is augmented in older BMRrepr mice, we analyzed individuals older than 1.5 years, but found no increase (fig. 4B).
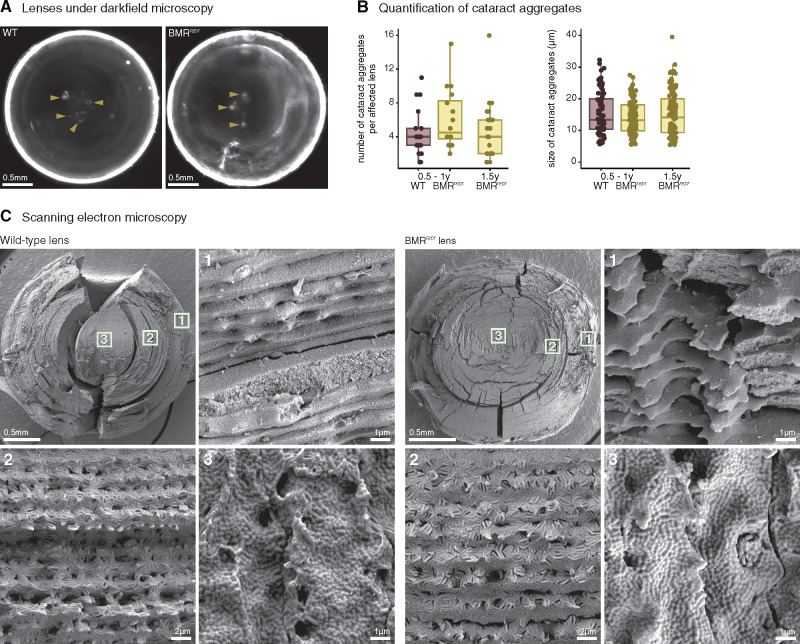
BMRrepr mice do not show an obvious lens phenotype. (A) Lenses of wild-type and BMRrepr mice viewed under darkfield illumination exemplify cataract aggregates (yellow arrowheads) in the center. (B) Quantification of the number and size of cataract aggregates in age-matched (0.5–1 year old) wild-type (purple) and BMRrepr (yellow) mice shows that BMRrepr mice have a slightly higher number of similarly sized cataract aggregates (differences are not statistically significant). We additionally analyzed 24 lenses of 1.5-year-old BMRrepr mice and these showed no increase in number or size of cataract aggregates compared with younger BMRrepr mice. (C) Comparison of lens fibers in 2-year-old wild-type and BMRrepr mice with scanning electron microscopy shows no obvious morphological differences. Different areas of the lens, highlighted by boxes with numbers 1–3 at the top left most image, are represented in closer detail in the remaining images.
Next, we investigated whether lens fibers of BMRrepr mice exhibit structural changes compared with those of wild-type mice. The lens is composed of multiple concentric layers of tightly connected fibers. The fiber membranes have numerous and complex interdigitations and cell–cell junctions, resulting in a rigidly structured epithelium that is important for lens function by minimizing the spacing between fibers and, thus, minimizing light scattering (Remington 2012). We used scanning electron microscopy to image the morphology of the lens fibers of adult mice and compared the outer, median, and inner layers of the lenses. As shown in figure 4C, there is no obvious difference in shape or fiber arrangement between wild-type and BMRrepr mice.
Together, these analyses show that the substantial increase in Tdrd7 expression in the developing lens of BMRrepr does not result in a clearly detectable lens phenotype.
Upregulation of Tdrd7 Does Not Result in an Increased TDRD7 Protein Content
Given the lack of an obvious lens-related phenotype, we investigated whether the significantly increased Tdrd7 mRNA levels in the lens of BMRrepr mice lead to an increase in TDRD7 protein levels. To this end, we used mass spectrometry to precisely quantify the absolute amount of TDRD7 in the lens of wild-type and homozygous BMRrepr mice at E14.5 and P1, the two time points where Tdrd7 mRNA expression is significantly increased. Surprisingly, we observed a similar amount of TDRD7 protein in the lens of wild-type and BMRrepr mice (fig. 5). This indicates that differences in Tdrd7 expression are effectively buffered at the protein level by a currently unknown mechanism. The absence of significantly different protein levels provides an explanation of why the embryonic misregulation of Tdrd7 in the lens of BMRrepr mice does not result in a detectable lens phenotype.
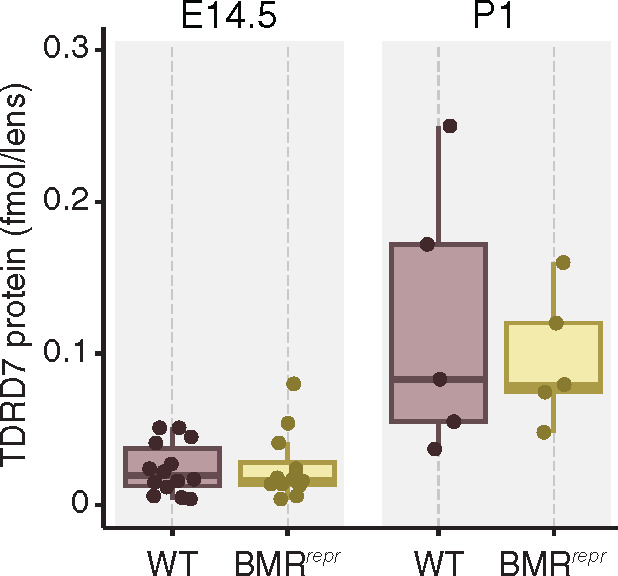
Tdrd7 expression differences in BMRrepr mice are buffered at the protein level. Absolute quantification of TDRD7 protein in the lenses of E14.5 and P1 wild-type (purple) and BMRrepr mice (yellow) shows a similar TDRD7 protein content.
Discussion
Comparative genome analysis has revealed many associations between particular traits and genomic changes in particular genes or regulatory elements. Understanding the contribution of mutations in such genes or regulatory elements to the evolution of a trait requires an experimentally tractable system, such as the mouse, where specific mutations can be introduced and their effects quantified. Gene knockout studies in mice contributed to our understanding of the functional role of many genes naturally lost in a variety of mammalian species (Meredith et al. 2009; Gaudry et al. 2017; Meyer et al. 2018; Sharma, Hecker, et al. 2018; Sharma and Hiller 2018; Sharma, Lehmann, et al. 2018; Hecker et al. 2019; Huelsmann et al. 2019). However, the effect of other, much more frequent genomic changes, such as amino-acid changing mutations in protein-coding sequences and sequence changes in regulatory elements has rarely been explored.
Here, we experimentally investigated the effects of prominent mutations in a lens regulatory element that were observed in the BMR, a burrowing mammal with greatly reduced eyes. To this end, we used CRISPR–Cas9 to precisely replace the mouse sequence of this regulatory element by the BMR sequence. Consistent with our in vitro results showing that the BMR sequence exhibits a partial loss of repressor activity in lens cells, we found that BMRrepr mice exhibit an upregulation of the Tdrd7 gene in the developing lens. This indicates that a transcriptional repressor element plays a role in controlling Tdrd7 expression in the developing lens in mice, which reveals an unknown aspect of Tdrd7 regulation. As the repressor element exhibits sequence conservation in most other mammals, this repressing activity may be conserved in other mammals.
Strikingly, we found that replacing the sequence of this single regulatory element is sufficient to cause a more than 2-fold increase in expression, which reveals that this repressor element has a major effect on Tdrd7 expression. This result contrasts previous findings that perturbations of individual regulatory elements generally have no measurable or only a small effect on gene expression (Ahituv et al. 2007; Cretekos et al. 2008; Capellini et al. 2017; Osterwalder et al. 2018; Sarro et al. 2018; Thompson et al. 2018; Fulco et al. 2019). Previously observed robustness at the transcriptional level can be attributed to functional redundancy, whereby multiple regulatory elements control the expression of a gene and a substantial change in gene expression can only be achieved by perturbations of multiple elements (Osterwalder et al. 2018). Importantly, whereas expression robustness of other genes may be achieved at the transcriptional level, our observations that the large increase in Tdrd7 mRNA does not lead to a corresponding increase in protein raises the possibility that robustness of TDRD7 protein expression is instead achieved at the posttranscriptional level. Buffering mechanisms at the protein level are quite frequent, especially for proteins that are part of protein complexes (Stingele et al. 2012). Which mechanisms confer posttranscriptional buffering of increased Tdrd7 mRNA levels are currently unknown and remain to be investigated.
The absence of increased TDRD7 protein levels in the lens likely explains why BMRrepr mice do not exhibit an obvious lens phenotype. Nevertheless, it is possible that these animals exhibit more subtle phenotypes for which it is hard to detect significant differences with a limited number of individuals. For example, we observed that BMRrepr mice exhibit slightly more cataract aggregates in the lens; however, many more individuals would be needed to assess whether this subtle difference is consistently observed (a power analysis indicates that one would need to analyze at least 63 lenses of wild-type and of BMRrepr mice to achieve statistically significant result). In addition, more pronounced phenotypes may not be expressed under the constant conditions of the artificial laboratory environment. In contrast, in the wild, where environmental fluctuations occur, pathogens exist, and food and mating partners are limited, both subtle as well as condition-dependent phenotypes would be subjected to natural selection over longer periods of time.
Although perturbations or deletions of single regulatory elements can result in drastic (Chan et al. 2010; Kvon et al. 2016; Gonen et al. 2018) or subtle phenotypic changes (Cretekos et al. 2008; Capellini et al. 2017; Thompson et al. 2018), they most often do not result in a detectable phenotype (Ahituv et al. 2007; Frankel et al. 2010; Osterwalder et al. 2018; Sarro et al. 2018). However, mutations in several regulatory elements can collectively account for phenotypic differences. For example, most mutations associated with complex traits and diseases are located in noncoding, presumably regulatory, genomic regions (Zhang and Lupski 2015; Guo et al. 2017). Individually, most of these mutations have a small effect, but collectively they can explain a large portion of the heritability of complex traits (International Schizophrenia Consortium et al. 2009; Yang et al. 2010; Fuchsberger et al. 2016; Castro et al. 2019). Similarly, our study showed that perturbing a single lens repressor element in a model organism leads to a molecular phenotype (gene expression change), but does not result in a detectable organismal phenotype, likely because the entire genetic machinery required for functional eyes is intact in mice. However, we have previously shown that numerous components of the genetic “eye-making” machinery are highly diverged in the BMR and other subterranean mammals, as these species lost several eye-related genes and exhibit divergence in hundreds of eye regulatory elements (Langer et al. 2018; Roscito et al. 2018; Langer and Hiller 2019). This has several, not mutually exclusive implications. First, due to relaxation of constraint, mutations in the Tdrd7 lens repressor may have occurred (or were only permitted) after eye degeneration had reached an advanced state in the BMR lineage. Under this possibility, these mutations were not primarily involved in eye phenotypes, but are a consequence of eye degeneration. A second possibility is that these mutations made a (potentially small) contribution to eye degeneration in the subterranean BMR lineage, but if this trait has a polygenic basis, one would need to recapitulate perturbations in several regulatory elements, in addition to the Tdrd7 lens repressor, to recapitulate BMR eye phenotypes.
In the BMR Tdrd7 gene locus, the CNE overlapping the lens repressor exhibits the strongest divergence signature. Nevertheless, additional mutations likely occurred (before or after the repressor element mutations) in this locus during BMR evolution, some of which may have also altered Tdrd7 expression. As expression of a gene is determined by the collective input of its regulatory elements, we cannot infer which effect the regulatory mutations investigated here have on Tdrd7 expression in the embryonic lens of extant BMRs, since this would require an understanding of how other regulatory mutations influence its expression level. Still, ongoing advances in genome engineering (Grunwald et al. 2019) will make it easier to test this in future by introducing additional regulatory mutations (in the Tdrd7 as well as in other loci) in the BMRrepr mouse line. Such studies will expand our understanding of the effect of perturbations of individual regulatory elements and regulatory robustness, and could ultimately enable predictions of which and how many perturbations are required to cause a particular phenotypic difference.
Materials and Methods
Computational Identification of Tdrd7 Regulatory Locus
Two CNEs upstream of Tdrd7 were identified in two previous genome-wide screens for CNEs that are diverged in subterranean mammals (Langer et al. 2018; Roscito et al. 2018). In the first screen, we generated a multiple whole-genome alignment with mouse (mm10 assembly) as the reference and 24 other mammals, used PhastCons (Siepel et al. 2005) to obtain conserved regions, and extracted CNEs by excluding protein-coding regions. This resulted in 351,279 CNEs. For each CNE, we then used the Forward Genomics branch method (Prudent et al. 2016) to assess whether the CNE sequence is preferentially diverged in subterranean mammals (Roscito et al. 2018). In the second screen, we considered the same set of CNEs, but determined whether a CNE exhibits preferential divergence of eye TF-binding sites using REforge (Langer et al. 2018). Applying GERP++ (Davydov et al. 2010), another method to determine evolutionary constraint, to the same multiple genome alignment shows that both PhastCons CNE are part of a larger GERP++ CNE. To determine whether this CNE overlaps previously published regulatory data, we mapped ChIP-seq, DNaseI-seq, and ATAC-seq data (Corbo et al. 2010; Encode Project Consortium 2012; Hao et al. 2012; Samuel et al. 2014; Mo et al. 2016; Roscito et al. 2018; Zhao et al. 2019) derived from developing and adult mouse eye tissues to the mouse mm10 assembly using the bedtools suite (Quinlan and Hall 2010). We inferred TF-binding sites using MAST (Bailey and Gribskov 1998) with a previously obtained set of 28 eye TFs (Langer et al. 2018).
In Vitro Test for Regulatory Activity with a Dual Luciferase Reporter Assay
We synthesized and cloned a 410-bp mouse sequence that spans both diverged CNEs (mm10 assembly; chr4:45967574–45967983) and the orthologous 208-bp BMR sequence (nanGal1 assembly; KL203377:255659–255866) into a luciferase pGL4.23[luc2/minP] vector (Promega, USA). We cloned the insert in the same orientation with respect to the minP promoter and luciferase gene as the CNE and the Tdrd7 promoter are oriented in the genome. We used the renilla pGL4.73 [hRluc/SV40] (Promega, USA) as the control plasmid.
We obtained an aliquot of a primary culture of 21EM15 mouse lens cells for this experiment (kind gift from Dr Salil Lachke). These cells were cultured in DMEM (Thermo Fisher Scientific, USA) supplemented with 10% fetal bovine serum (Merck, Germany), at 37 °C, 5% CO2, and 100% humidity. For detachment, cells were washed with phosphate-buffered saline (PBS) and treated with 0.05% Trypsin/EDTA (Thermo Fisher Scientific, USA) for 3 min at 37 °C. After incubation, fresh medium was added, spun down at 140 g for 5 min and resuspended in fresh complete media; 3,000 cells/well were seeded into the 384-well plate (Corning, USA). The enhancer constructs were transfected 24 h after seeding using FuGENE6 (Promega, USA) as the transfection reagent, following manufacturer's instructions. In brief, FuGENE6 was mixed in OptiMEM (Thermo Fisher Scientific, USA) and incubated for 5 min at room temperature. The plasmids with firefly and renilla luciferases were added to the mix in a ratio of 100:1 and, after an incubation period of 20 min at room temperature, the transfection complex was added to the cells in a 4:1 FuGENE/DNA ratio. The luminescence read-out was obtained 48 h after transfection, using the Dual-Glo Luciferase Assay System Kit (Promega, USA) as substrate, according to manufacturer's instructions, and an Envision 2104 Multilabel reader (Perkin Elmer, USA) with an ultrasensitive luminescence 384-well aperture.
We repeated the assay twice (two different plates) with a total of eight technical replicates per plate for each of the mouse and BMR tested sequences. The ratio of firefly and renilla luciferases was normalized by the mean of the replicates of the empty control vector of the respective plate. Significance was assessed using a two-sided Wilcoxon rank sum test.
Mouse Transgenics
Ethics Statement
Work with mouse was performed in accordance with the German animal welfare legislation and in strict pathogen-free conditions in the animal facility of the Max Planck Institute of Molecular Cell Biology and Genetics, Dresden, Germany. Protocols were approved by the Institutional Animal Welfare Officer (Tierschutzbeauftragter), and necessary licenses were obtained from the regional Ethical Commission for Animal Experimentation (Landesdirektion Sachsen, Dresden, Germany).
CRISPR Guide Design
To measure the molecular and morphological effects of divergence in the Tdrd7 regulatory locus, we used the CRISPR–Cas9 system to create a transgenic mouse line in which we replaced the aforementioned 410-bp mouse sequence by the orthologous 208-bp BMR sequence. We designed four guide RNAs to target the Tdrd7 locus for the CRISPR transgenesis using the Geneious software (8.1.6; Biomatters), and created a repair construct comprising 500-bp homology arms flanking the 208-bp BMR sequence. Guide sequences (PAM sequence underlined) and repair construct sequence (BMR sequence underlined) are the following: gRNA1: 5′-GTTCATGGATGGGGGTAGCAGG-3′; gRNA2: 5′-TGATTAATCATTAATGACATGG-3′; gRNA3: 5′-TAATCCCCTGGAGGGTGATCAGG-3′; gRNA4: 5′-GATCACCCTCCAGGGGATTAGGG-3′; repair sequence 5′-CAGCAACTATTACAGCCTAATTTTTGTACCAGTAGGTTTATCCATGATTTCAGTGCCTTGTTTGAAGCACCAGTTAGCTAATCTCATGCCTTGCTAAATAGCTGGGCCTCTTTTCTCAGCTTCCTGATAGTGCTTAGTAGACACCATCTGTATTGCAAGTCCTGCCTAAGCTGTATGAATGATGCACAATTTGAAGCAGGAAAGTGAAGATGGTCTCTTAGACAGCAGGTTCTACCCTCTAGGTTCTCTACGCAGAGTGTTCAAACAGTGGTTCTCAACTTATGGGTCTCGACCCCTTTGTCGGGTAAACAATCCTTTTCACAGGAGTCAGATATCCTGCATAACAGGTATTTACATTATGATTAATAGTAGTAGCAAAATCACAGTTATGAAGTAGCAAGAAAAAAATAATTTTATGTCTGGGGGGGTCACTACAACATGAGGAACTGTGTTAAAGCGGTTAAGCTTTACGAAGGTTGAGAGACACTGTGTTAAAGCTTTCATTATCTCCTCTTTCCCATTGTTGGTGGCTGTGTGGCCTCTAAAGCTTGGGTGATCAGTTCCTGCTGGGGATTAGGGCCTTTCAGCTGATTCACCTTAAAGGCCTTTGTGGGCAGCTTAGGGGTTTTGCTGTATCAGCACGTTAACGATTAATTGAAAACAGCTCTGTCCAGAGATCCCTACTTTTCCTGACTTTGTATAAGCAACCAGTGCCTGAGAAGCTGGGTTCCACCTGGATGCAAAAACAGCTCAGCACAATGGCTGAGTGGCAGGCGGAATGCTGCAAAAGCCACTTGCAGCTTAGCAACTAGGAGAATGGGGACTCAGTTAAGCAGTACACAGGGGGGATGGAAAGCTTCGCCCTCCTCGCACTGCTATTCTGTGAGAATCCTCAGAGGAACAAAGCACCATCTTGAAACTCAATTAAGAGAGCAATAGGTTTGGGGGAAGGGCTGTGAGGGAGGTTTCCAGAGGAGTACCACCCATGACACTGAATAATGTCACAAGCCAGTCCCTGAAGTTCACTGACGGGATGGAAAGTGACAGAAATCCGAGTCCTGTGGATGTGTTTGGGGTTTTCTTTTTGGAGACAATATAAAGAAGCGACAGATGTTCTGGATAGAAGGTGAGATAGCAGCGCTTGAAGTGTCTCCAAATGCCACTTGAGATGTGGAAGGGGGGATTTGCAACCCTTCCCAGTATTTGTG
Creation of Transgenic Embryos
We induced superovulation in female C57Bl6/JCrl donor mice following standard hormonal treatment with PMSG (pregnant mare’s serum gonadotrophin) and HCG (human chorionic gonadotrophin) and performed pronuclear injection of fertilized mouse oocytes following the procedure described in (Vintersten et al. 2008). Superovulating females were mated with C57Bl6/JCrl male mice 46 h between the PMSG and HCG injections at the midpoint of the dark period (12/12 h, 6 AM to 6PM light cycle). After positive plug detection in the morning, the cumulus complexes were isolated and zygotes removed with a treatment of hyaluronidase (final concentration of 0.1% [801 unit/ml]). Before injecting the CRISPR solution, we incubated the recombinant Cas9 protein (ToolGen, 31.31 pmol final) in protein buffer (20 mM Hepes pH 7.5, 150 mM KCl) with 7.8 pmol of each gRNA, 15.6 pmol of tracrRNA, and 0.16 pmol of the gblock repair construct in a total volume of 15 μl, for 15 min at 37 °C, allowing the mix to form a functional complex. We next centrifuged the mix (1 min, 13,000 g) through a Durapore PVDF 0.22‐μm filter (Merck Millipore, USA). We injected the CRISPR–Cas9 solution into the male pronucleus of fertilized zygotes with a motor-driven manipulator-based microinjection stage. Recipient Crl:CD1(ICR) female mice were mated with sterile (vasectomized) Crl:CD1(ICR) males. Around 2 h after injections of CRISPR–Cas9 mix into fertilized zygotes, the surviving embryos were transferred into the pseudopregnant recipient female mice (around 20 embryos per recipient) following the procedure described previously (Arras et al. 2001).
Genotyping
We extracted genomic DNA from mouse tails using the QuickExtract DNA extraction kit (Epicentre) following manufacturer’s instructions, and performed PCR using the Phusion Flash High-Fidelity PCR master mix (Thermo Fisher Scientific, USA). Two primer pairs were designed to bind to the 5′ and 3′ flanks of the mouse sequence outside of the homology arms and to the BMR-specific sequence. PCR products were Sanger-sequenced to confirm the precise replacement of the regulatory element. Primer sequences are the following: 5′ flanking_forward (mouse): 5′-TCAGTCTGTGAGCCGTTGAC-3′; 5′ flanking_reverse (BMRrepr mouse): 5′-TAACGTGCTGATACAGCAAAACC-3′; 3′ flanking_forward (BMRrepr mouse): 5′-GCTTAGGGGTTTTGCTGTATCA-3′; 3′ flanking_reverse (mouse): 5′ACACAACCCAAGATCCACACG-3′.
Quantification of Tdrd7 mRNA Levels by RT-qPCR
We quantified Tdrd7 mRNA expression by RT-qPCR, with primers to amplify 97 bp of the mRNA spanning exons 12 and 13. We used the ribosomal Rpl13a gene as control. Primer sequences are the following: Tdrd7-fw: 5′-TGGCAATTCGACATCCGTGA-3′; Tdrd7-rev: 5′-GCACTTTATAGCCTGAGGGGG-3′; Rpl13a-fw: 5′-CCCACAAGACCAAGAGAGGC-3′; Rpl13a-rev: 5′-CACCATCCGCTTTTTCTTGTCA-3′. We dissected lenses and testes/ovaries of E14.5, P1, and 12-week-old adult female and male wild-type and homozygous BMRrepr mice and snap-froze collected tissues in liquid nitrogen. Each tissue sample and timepoint is represented by at least three biological replicates. For adults, we pooled both lenses, testes and ovaries of a single mice to obtain one biological replicate. For P1 and E14.5 samples, we pooled all lenses, testes, and ovaries from all pups/embryos from one litter into one biological replicate. Total RNA was extracted with a standard TRIzol RNA extraction and chloroform/isopropanol precipitation and cDNA was prepared with the ProtoScript II First Strand cDNA synthesis kit (New England Biolabs, Frankfurt, Germany). For each sample, we collected at least three biological replicates, and measured each at least three times (technical replicates) in the LightCycler96 (Roche, Germany). We detected expression using SYBRgreen marker (Roche, Germany). To obtain the normalized expression values of Tdrd7 in BMRrepr samples with respect to the wild-type condition, we followed the procedure described in (Taylor et al. 2019). In short, we computed the ΔCq of each BMRrepr sample with respect to the average of wild-type samples, corrected those for primer efficiency, and normalized by the control gene Rpl13a. We tested the difference in normalized Tdrd7 expression between wild-type and BMRrepr mice with a two-sided t-test.
Absolute Quantification of TDRD7 Protein by MS Western
We opted for an absolute quantification of TDRD7 protein in developing lenses using MS-Western (Kumar et al. 2018). TDRD7 was quantified by codigestion of its SDS–PAGE-separated band with the band of isotopically labeled chimera composed of concatenated proteotypic peptides.
Preparation of Labeled TDRD7 Peptides
We selected quantotypic peptides for TDRD7 protein using the collection of mass spectra available in the MaxQB database (supplementary table 3, Supplementary Material online), according to (Rauniyar 2015). Peptide sequences were included into an Escherichia coli-optimized synthetic gene construct containing a TwinStrep tag, selected phosB and BSA peptides (Kumar et al. 2018). The construct was cloned into a pET expression vector and transformed into a BL21 (DE3) E. coli strain, auxotrophic for arginine and lysine. Cells were grown at 37 °C in MDAG-135 media (Studier 2005), supplemented with 16 unlabeled amino acids and isotopically labeled 13N4-l-arginine and 13C6-l-lysine (Silantes, Munich, Germany). Protein expression was induced by 1-mM isopropyl β-d-1-thiogalactopyranoside (IPTG) for 3 h. After induction, cells were pelleted, resuspended in 2× PBS, snap-frozen in liquid nitrogen, and stored at −80 °C. Prior to analyses, cells were thawed and lysed in an equal volume of 2× Laemmli buffer by incubating at 95 °C for 10 min. The sample was clarified by centrifugation and the supernatant subjected to 1D SDS–PAGE on a 4–20% precast gradient gel. Proteins were visualized by Coomassie staining.
Sample Preparation
We carefully dissected the lenses of wild-type and homozygous BMRrepr E14.5 embryos and P1 pups (2 biological replicates for E14.5 samples and a single replicate for P1), snap-froze them in liquid nitrogen and stored at −80 °C until use. To lyse the tissue, we added 40 µl of 1× Laemmli buffer with 0.5 µl of protease inhibitors cocktail (Thermo Fischer Scientific, USA) and 20–30 0.2-mm stainless steel beads (Next Advance, USA) per vial, and homogenized it in a TissueLyser (Qiagen, Düsseldorf, Germany) for 10 min at 4 °C. Homogenized material was centrifuged for 10 min and heated at 80 °C for 5 min. After cooling down to room temperature, cell debris was spun down and the supernatant loaded onto a 1D SDS min-gel (BioRad Laboratories, USA). We visualized the gel by Coomassie staining and excised the region corresponding to the molecular weight of TDRD7 protein for subsequent MS-Western analysis.
Mass Spectrometric Analysis and Absolute Quantification Using MS-Western
Absolute quantification of TDRD7 protein was performed as described in (Kumar et al. 2018). Briefly, an aliquot of 0.5 pmol of BSA standard (Thermo Fischer Scientific, USA) was analyzed by 1 D SDS–PAGE, visualized by Coomassie, and the BSA band was excised. The gel slices containing TDRD7, the isotopically labelled chimeric protein standard from a separate gel, and a band of the BSA standard were combined together. Proteins were reduced with 10 mM DTT, alkylated by iodiacetamide and in-gel digested overnight with trypsin. The resulting peptide mixture was extracted twice by exchange of 5% formic acid and acetonitrile, extracts pooled together and dried in a vacuum centrifuge. Peptides were resuspended in 25 µl of 5% FA and a 5 µl aliquot was analyzed by LC-MS/MS on a nano-UPLC system interfaced to a Q Exactive HF Orbitrap mass spectrometer (both Thermo Fischer Scientific, Bremen, Germany). The nano-UPLC was equipped with an Acclaim PepMap100 C18 75 μm i.d. × 20-mm trap column and 75 μm × 15-cm analytical column (3 μm/100A, Thermo Fisher Scientific, Bremen, Germany). Peptides were separated using an 80-min linear gradient: solvent A was 0.1% aqueous formic acid and solvent B was 0.1% formic acid in neat acetonitrile. Three blank runs were performed after each sample analysis to minimize carryover, the last blank run was recorded and searched against mouse sequences in UniProt database. To set up PRM parameters, the relevant information on target peptides (m/z, charge state, retention time; supplementary fig. 1, Supplementary Material online) was obtained in preliminary experiments using a tryptic digest of the chimeric standard. In all experiments, FT MS spectrum was acquired within the mass range of m/z 350–1,700 at the mass resolution of Rm/z=200 = 240,000 (FWHM); targetAGC of 3 × 10⁶, 150-ms maximum injection time. It was followed by PRM scans at Rm/z=200 = 120,000 resolution; target AGC of 1 × 10⁵; 200-ms maximum injection time triggered by a scheduled inclusion list. Lock mass was set to the singly charged ion of dodecamethylcyclohexasiloxane ion ((Si(CH3)2O))6; m/z = 445.1200).
We processed the spectra using the SkyLine software (MacLean et al. 2010). We manually verified the data, refining the peak boundaries where necessarily. MS/MS spectra from PRM experiments were also searched with MASCOT software against a database of mouse protein sequences. Quantification was performed using the sum of extracted peak areas of 2–4 most abundant y-ion fragments whose m/z exceeded the m/z of the corresponding precursor ion and integral value exceeding 1 × 10⁶. First, the amount of each labelled standard peptide was quantified using the peak areas of peptides of unlabelled BSA standard (note that all peptides in chimera standard protein, including peptides from BSA and TDRD7, were present in equimolar ratios). Then, the molar abundance of the labelled standard peptides was used to quantify peptides from endogenous TDRD7. As data quality control, we required that normalized ratios of fragment ion abundances were the same in labelled (from chimera) and corresponding unlabelled (endogenous) peptides. Finally, the data were normalized to the number of eye lenses pooled in each sample.
Analyzing Lens Morphology
Quantifying Nuclear Cataracts
To quantify the number and size of cataract aggregates in the lenses of adult mice, we imaged them with an Olympus SZX16 stereoscope equipped with a q-Imaging camera. We carefully dissected the lenses of wild-type and homozygous BMRrepr mice with ages between 6 months and 1.5 years, immediately embedded them in Optiprep refractive index matching media (Boothe et al. 2017), and imaged under darkfield illumination (11.5× magnification; 250 ms exposure and 6.5 gain). We used FIJI (Schindelin et al. 2012) to process images with a script that includes subtracting background (rolling ball radius = 50 pixels), median filtering (radius = 2 pixels), detecting objects with the Interactive Watershed plugin (SCF; seed dynamics 2,000, intensity threshold 4,000, peak flooding 50, AllowSplitting = false), and finally obtaining the number and size of elements with Analyze Particles plugin (size = 1,000–10,000 px2).
We performed a post hoc power analysis using the R package pwr (function pwr.t.test) to estimate the sample size one would need to get 80% power to detect a significant effect at P < 0.05 for a two-sided t-test. Effect size was determined as the difference in the mean number of cataract aggregates between the 0.5- and 1-year-old wild-type and BMRrepr mice (4.4736 and 6.0625, respectively), divided by the observed standard deviation (3.17). This resulted in an estimated sample size of 63.46. Pooling the data for young and 1.5-year-old BMRrepr mice estimated a sample size of 187.15.
Scanning Electron Microscopy
Lenses of 2-year-old wild-type and homozygous BMRrepr mice aged were carefully dissected and fixed in a modified Karnovsky’s fixative (2% glutaraldehyde/2% formaldehyde in 100-mM phosphate buffer) at 4 °C for at least one day to allow the fixative to penetrate through the more external layers of the lens. After this period, the lenses were cut in half through the equatorial plane and fixed again in the same solution for at least another 3 days. Samples were washed with PBS (10 mM Na2HPO4, 1.8 mM KH2PO4, 137 mM NaCl, 2.7 mM KCl, pH 7.4) for 5 × 5 min. After that, the material was postfixed in 1% osmium tetraoxide in PBS, washed several times in PBS and water, and dehydrated in a graded series of ethanol/water mixtures up to pure ethanol (30%, 50%, 70%, 96%, and 3 × 100% on molecular sieve, 15 min each). Samples were critical point dried using a Leica CPD300 (Leica Microsystems, Wetzlar, Germany) and mounted on 12-mm aluminum stubs using conductive carbon tabs. The lens halves were additionally grounded with conductive liquid silver paint. To increase contrast and conductivity, the samples were sputter coated with gold (BAL-TEC SCD 050 sputter coater, settings: 60 s, with 60 mA, at 5-cm working distance). Finally, the samples were imaged with a JSM 7500 F scanning electron microscope (JEOL, Garching, Germany) running at 5 kV (lower SE-detector, working distance 8 mm).
Analyzing Sperm Quality
To characterize potential differences in sperm quality between wild-type and homozygous BMRrepr adult mice, we collected sperm samples and analyzed them on an automated sperm analyzer. Sample preparation followed (Helppi et al. 2016). In short, we dissected the epididymis of age-matched wild-type and BMRrepr mice (three biological replicates), embedded it in 170 µl of cryoprotective agent (18% raffinose and 3% skim milk), and transferred equal amounts of the sperm solution to human tubal fluid, to a concentration of 1:50. We then added this solution to a Standard Count 2 Chamber Slide from Leja (Nieuw-Vennep, The Netherlands) and measurements were made with a Hamilton Thorne Automated Sperm Analyser (Hamilton Thorne, Beverly, MA, USA) with default settings for mouse sperm.
Acknowledgments
We thank Maurício de Rocha Martins for helpful discussions and comments on the manuscript, Salil Lachke for providing the lens cell line, Andrea Schuhmann for assistance in MS experiments and analyses, and the following MPI-CBG facilities for their support: Antibody Facility, Biomedical services, Cell Technologies Group, DNA sequencing, Mass Spectrometry, Transgenic Core Facility, TransgeneOmics, and Technology Development Studio. This work was supported by the Max Planck Society.