 Are Nonsynonymous Transversions Generally More Deleterious than Nonsynonymous Transitions?
Molecular Biology and Evolution


- Altmetric
It has been suggested that, due to the structure of the genetic code, nonsynonymous transitions are less likely than transversions to cause radical changes in amino acid physicochemical properties so are on average less deleterious. This view was supported by some but not all mutagenesis experiments. Because laboratory measures of fitness effects have limited sensitivities and relative frequencies of different mutations in mutagenesis studies may not match those in nature, we here revisit this issue using comparative genomics. We extend the standard codon model of sequence evolution by adding the parameter η
Introduction
Nucleotide changes between the two purines (A and G) and those between the two pyrimidines (C and T) are known as transitions, whereas changes between a purine and a pyrimidine are known as transversions. Because there are four types of transitions but eight types of transversions, the expected number of transitions relative to that of transversions (Ts/Tv) is 0.5 in DNA sequence evolution if all types of nucleotide changes have equal rates. In reality, however, Ts/Tv often exceeds 0.5 or even 1 (Nei and Kumar 2000; Yang 2006). This phenomenon, referred to as the transition bias, is well recognized and is commonly considered in nucleotide or codon substitution models of DNA sequence evolution that are used for estimating nucleotide substitution rates, inferring molecular phylogenies, and testing natural selection (Kimura 1980; Hasegawa et al. 1985; Li et al. 1985; Tamura and Nei 1993; Goldman and Yang 1994; Yang et al. 1998; Zhang et al. 1998).
The transition bias observed in the evolution of protein-coding DNA sequences has two sources of origin. First, the transition bias exists at the mutational level. Transitions require a much smaller distortion of the DNA double-helix structure than transversions so tend to occur more frequently in DNA replication. In addition, deamination, a common chemical change of nucleotides, leads to transitions. Genome-wide evidence for transition bias at the mutational level typically comes from mutation accumulation (MA) experiments, in which mutations are accumulated over many generations in organisms kept in extremely small populations to minimize the effect of selection. For instance, spontaneous mutations observed in MA experiments of Saccharomyces cerevisiae (Lynch et al. 2008; Zhu et al. 2014; Liu and Zhang 2019), Drosophila melanogaster (Haag-Liautard et al. 2008; Schrider et al. 2013), and Arabidopsis thaliana (Ossowski et al. 2010) show transition bias. Similar biases were found among single nucleotide polymorphisms of natural populations at noncoding or synonymous sites, which are presumably under little or no natural selection (Freudenberg-Hua et al. 2003; Rosenberg et al. 2003; Cutter 2006; Jiang and Zhao 2006; Hershberg and Petrov 2010). Notably, however, the transition bias at the mutational level was reported to be absent in the nematode Caenorhabditis elegans (Denver et al. 2009).
Second, the transition bias also results from natural selection. For example, Zhu et al. (2014) observed Ts/Tv = 0.95 from 867 spontaneous mutations in Saccharomyces cerevisiae MA lines, but Ts/Tv = 2.96 when the MA ancestral line is compared with the yeast reference genome. A similar inflation of Ts/Tv among natural polymorphisms relative to mutations is also observed in Caenorhabditis elegans (Denver et al. 2009). These results suggest that transitions are less deleterious and less likely to be purged by natural selection than transversions. The difference in purifying selection intensity on transitions and transversions has two potential causes in coding sequences. First, due to the structure of the genetic code, transitions are more likely than transversions to be synonymous, rendering transitions less often selected against than transversions and an inflated Ts/Tv. This mechanism is theoretically sound and empirically supported (Zhang 2000; Freudenberg-Hua et al. 2003; Schrider et al. 2013). Second, it has been suggested that, compared with nonsynonymous transversions, nonsynonymous transitions are less deleterious because they tend not to cause radical changes in amino acid physicochemical properties such as the charge, polarity, and size (Zhang 2000). For instance, Zhang (2000) grouped the 20 amino acids into different physicochemical bins and reported that nonsynonymous transitions are less likely than nonsynonymous transversions to cause amino acid changes from one bin to another. Furthermore, he reported a lower substitution rate for nonsynonymous transversion than nonsynonymous transition in mammalian gene evolution (Zhang 2000). Freudenberg-Hua et al. (2003) classified amino acid changes as radical or conservative according to the Grantham physicochemical distance (Grantham 1974) and showed a similar trend among human nonsynonymous polymorphisms. Although these studies support the existence of a selection strength difference between nonsynonymous transitions and transversions, Stoltzfus and Norris (2016) disagreed with this view. Based on eight mutagenesis studies that measured the fitness effects of 1,239 nonsynonymous mutations in six viruses and the beta-lactamase TEM-1 gene in Escherichia coli, the authors found no significant difference in fitness effect between nonsynonymous transitions and transversions. By contrast, Lyons and Lauring analyzed 11,282 nonsynonymous mutations from deep mutational scans in the influenza virus and human immunodeficiency virus and reported that nonsynonymous transversions are significantly more deleterious than nonsynonymous transitions (Lyons and Lauring 2017). Thus, whether nonsynonymous transversions are generally more deleterious than nonsynonymous transitions remains controversial.
We note that, although mutagenesis studies are powerful in its ability to test the fitness impact of any mutation of interest, it has a limited sensitivity. For instance, fitness difference smaller than 0.02% per generation is virtually undetectable in the lab (Gallet et al. 2012), whereas natural selection can detect a fitness difference that is larger than the inverse of the effective population size. In addition, we note that both nonsynonymous transitions and nonsynonymous transversions comprise a mixture of many types of amino acid changes whose relative frequencies depend on a number of factors such as codon frequencies, which vary among species. Hence, the relative frequencies of various amino acid changes in mutagenesis studies may not represent those in nature for the same species and genes, let alone other species and genes. Consequently, to answer whether nonsynonymous transitions are on average less deleterious than nonsynonymous transversions, we need to analyze evolutionary data. In this study, we built a codon substitution model that includes the parameter η that measures the fixation probability of nonsynonymous transitions relative to that of nonsynonymous transversions. Estimating η from each of 90 pairs of genomes across the tree of life, we find that η varies from significantly below 1 to significantly above 1. We show that this unexpected result is most likely due to the variation of amino acid exchangeabilities across evolutionary lineages.
Results
A Likelihood Estimator of , the Fixation Probability of Nonsynonymous Transitions Relative to That of Nonsynonymous Transversions
Let η be the fixation probability or acceptability of nonsynonymous transitions relative to that of nonsynonymous transversions. To estimate η, we extended the Markov codon substitution model of Goldman and Yang (1994) such that the rate of substitution from codon u to codon v is given by
We performed computer simulations to verify the reliability of the above-described estimator of η. Specifically, we simulated coding sequence evolution under the model described above to produce a pair of homologous sequences of 500,000 codons. This long alignment was used because our purpose was to validate the maximum likelihood implementation of the model and to evaluate the potential bias in η estimation rather than the sampling error and because this length is close to the median alignment length (486,750 codons) of real sequences analyzed in this study. A series of η values ranging from 0.1 to 2 were used in the simulation. We also varied the genetic distance d, which is defined by the number of nucleotide substitutions per codon between the two sequences, , and to examine if η estimation is reliable under a variety of parameter combinations. We found that the estimated η is unbiased (fig. 1). For example, when the true η is 1.2, the estimated η values under six different d values each with N = 10 replicates have a mean of 1.204 and a standard deviation of 0.027 (fig. 1a). Considering all η estimates in figure 1a together, we found that the deviation of the estimated η from the true value was not significantly different from 0 (P = 0.14, one-sample t-test). Furthermore, no correlation was observed between the deviation of the η estimate from its true value and the true d in figure 1a (Spearman’s = −0.015, P = 0.76). Similarly, there is no significant correlation between the deviation of the η estimate from its true value and the true (fig. 1b) or (fig. 1c).

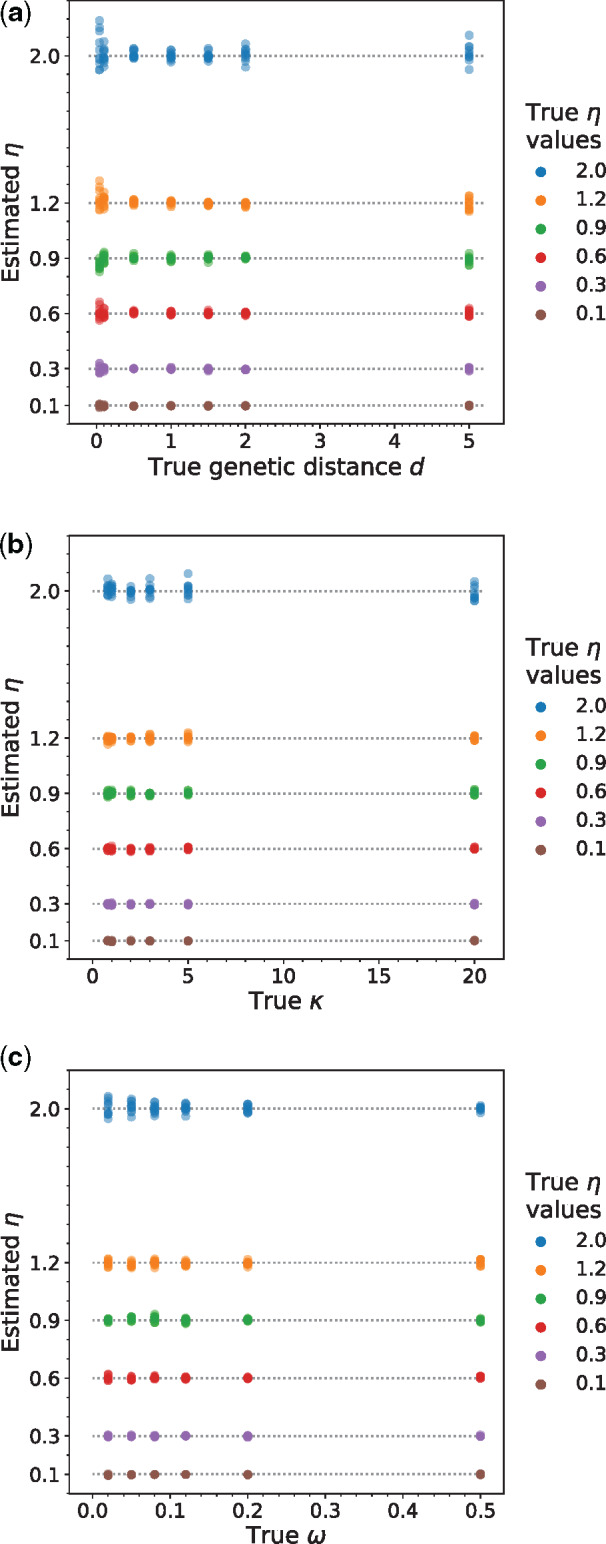
Simulations according to equation (1) show that the inferred η’s are unbiased when compared with the true values and are uncorrelated with (a) the genetic distance (d) between the two species in the clade, (b) transition bias at the mutational level (), and (c) the fixation probability of nonsynonymous transversions relative to that of synonymous transversions (). In each panel, only the parameter shown on the x-axis varied. Each dot is one η estimate plotted against the true value of another parameter used in the simulation. The true value of an η estimate is indicated by its color, and the dotted lines correspond to the true η values for easy comparison. Genetic distance is defined by the number of nucleotide substitutions per codon between the two sequences. In each plot, except for the parameter varied, the other parameters used in the simulation are d = 1 substitution per codon, = 2, = 0.06.
Substantial Variation of η across the Tree of Life
After verifying the reliability of the η estimator, we applied the estimator to 90 clades across the tree of life (supplementary table S1, Supplementary Material online), including 15 eukaryotic, 6 archaeal, and 69 bacterial clades. The eukaryotic clades comprise six vertebrate, two insect, two fungal, three plant, and two protozoan clades. Each of the 90 clades includes a pair of relatively closely related species or strains with available genome sequences. With the genome-wide concatenated coding sequence alignment available for each clade (see Materials and Methods), we estimated η for each clade using codemlz.
The results are surprising (fig. 2 and supplementary table S1, Supplementary Material online). Within both eukaryotes and prokaryotes, some clades show η > 1, whereas other clades exhibit η < 1. In total, 34 clades have η > 1, with the largest being 2.0; whereas 56 clades have η < 1, with the smallest being 0.13. For example, for the clade containing two malaria pathogens Plasmodium vivax and P. knowlesi, the inferred η is 2.0, indicating that nonsynonymous transitions are twice as likely to be fixed as nonsynonymous transversions. By contrast, η is estimated to be 0.54 for the clade consisting of the ant species Atta cephalotes and Solenopsis invicta, meaning that the acceptability of nonsynonymous transitions is close to one half that of nonsynonymous transversions. Among the 90 clades, 81 have an η that deviates significantly from 1 (P < 0.05, likelihood ratio test followed by Bonferroni correction for multiple testing), including 30 cases of η > 1 and 51 cases of η < 1.
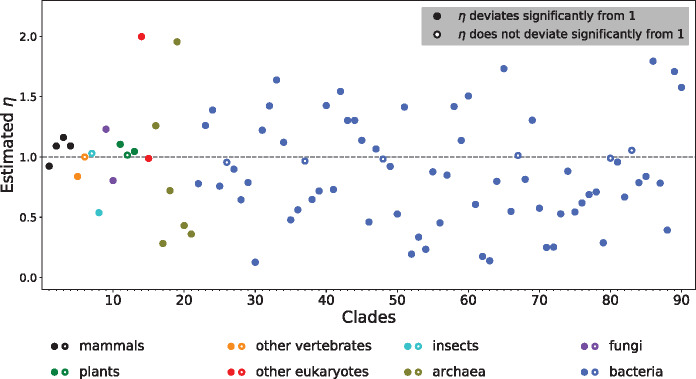
The estimated η varies among 90 clades sampled across the tree of life. Each clade is represented by an alignment of genome-wide orthologous coding sequences of two closely related species/strains. Statistical significance of η’s deviation from 1 is determined by an adjusted P value of <0.05 (likelihood ratio test followed by Bonferroni correction for multiple testing). Clade indices on the x-axis refer to those in supplementary table S1, Supplementary Material online.
To examine the potential variation of η within a genome, we randomly split the coding sequence alignment of a clade into two halves and estimated η from each half. The 90 estimated η’s from the first halves have a strong correlation (Spearman’s = 1.0, P < 1E-89) with those from the second halves. This is true in all five replicate analyses of random genome split, indicating that the phenomenon of η heterogeneity among clades is not observed among large segments within a genome. Additionally, we ranked all genes in each clade by their values (see Materials and Methods) and grouped the 50% top-ranked genes into one bin and the remaining genes into the second bin. We found that η estimated from the concatenated sequences of the high- bin and the corresponding η from the low- bin are highly correlated across the 90 clades ( = 0.82, P = 1.2E-22). This result suggests that η is a clade-specific feature that is shared by both high- and low- genes.
Causes of the Among-Clade Variation in η
Why does η vary among different clades, reaching values of both higher than 1 and lower than 1? Because the overall acceptability of nonsynonymous transitions relative to that of nonsynonymous transversions depends on the acceptability of individual nonsynonymous mutations, a mechanistic understanding requires considering the underlying relative exchangeabilities among amino acids (Zou and Zhang 2019). Here, the relative exchangeability between amino acids i and j, or REij, is the fixation probability of mutations converting between i and j, relative to the overall fixation probability of all nonsynonymous mutations. To study how amino acid exchangeabilities influence η, we simulated sequence evolution using the general codon model proposed in Yang et al. (1998), with slight modifications. Specifically, the rate of substitution from codon u to codon v equals
Here, is the fixation probability of mutations converting codon u to v, where u and v respectively code for amino acid i and j ≠ i, relative to the fixation probability of synonymous mutations. Each is the product of the corresponding REij and, which is the overall fixation probability of nonsynonymous mutations relative to that of synonymous mutations. All other notations in equation (2) are the same as in equation (1). Note that REij = REji, so . The set of REij used are derived from the aforementioned Grantham physicochemical distances between amino acids (see Materials and Methods). To probe factors potentially explaining the among-clade variation in η, we varied parameters or combinations of parameters in the simulation according to their observed values in the 90 clades. If any specific parameter in this model is responsible for the observed η heterogeneity, we should be able to replicate the observed η heterogeneity by varying that parameter across its range observed in the actual data.
First, we simulated sequence evolution with a series of values while keeping all other parameters constant, and then used codemlz to estimate η from the simulated sequences. We observed a significant, negative correlation between and the estimated η (Spearman’s = −0.93, P = 4.7E-69; fig. 3a), suggesting that increasing the transition bias at the mutational level decreases η (under the other parameters used). This correlation is consistent with the observation in the real data (supplementary fig. S1a, Supplementary Material online). Nevertheless, with changing from 0.5 to 20 in the simulation, the estimated ηvaries only in the narrow range of 0.78–0.92 (fig. 3a). By contrast, among the 90 clades in the real data examined, 88 clades have inferred within the same range [0.5, 20], whereas the corresponding η estimates vary in the much wider range of 0.12–2.0 (fig. 2). Hence, the among-clade variation in alone cannot explain the observed large variation of η.
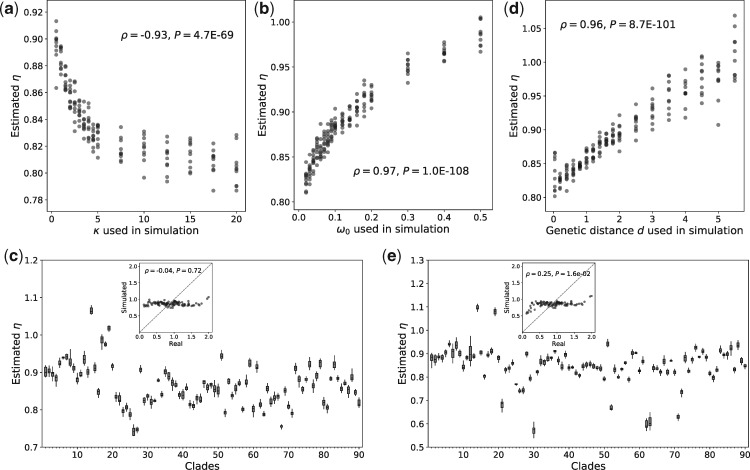
Variations in , , , d, or their combination are insufficient to explain the large among-clade variation in the estimated η. Here, η’s estimated from sequence alignments simulated under equation (2) are plotted against the true values of (a) , (b) , (c) , (d) d, or (e) combination of , , , and d used in the simulations. In (a), (b), and (d), only the parameter on the x-axis varied in the simulations. In (c) and (e), the observed codon frequencies and combination of , , , and d of the 90 clades are respectively used in the simulations, and the insets plot the η estimated from the real sequence alignment of each clade against that estimated from the alignment simulated. For each parameter value, the η estimates from ten replicate simulations are shown as dots (in panels a, b, and d) or boxplots (in panels c and e). In each boxplot, the lower and upper edges of a box represent the first (qu1) and third (qu3) quartiles, respectively, the horizontal line inside the box indicates the median (md), and the whiskers extend to the most extreme values inside inner fences, md ± 1.5(qu3 − qu1). In the insets of panels (c) and (e), the mean estimate from the ten replicate simulations is shown on the y-axis. In each plot, except for the parameter varied, the other parameters used in the simulation are d = 1 substitution per codon, = 2, and = 0.06.
Second, we simulated sequence evolution under a series of values between 0.02 and 0.50 while maintaining all other parameters unchanged (fig. 3b). Despite a significant positive correlation between and the estimated η ( = 0.97, P = 1.0E-108), the estimated η ranges merely from 0.81 to 1.0. Furthermore, the real data do not exhibit a positive correlation between the estimated and η (supplementary fig. S1b, Supplementary Material online). Thus, variation in cannot explain the observed large variation in η among different evolutionary lineages.
Third, we simulated 90 pairs of sequences using the same parameters except for the codon frequencies , for which we respectively used the observed codon frequencies from the 90 clades. The estimated η of the 90 pairs of simulated sequences ranges from 0.74 to 1.07 (fig. 3c), which is still much narrower than the range observed from the 90 actual clades (fig. 2). Furthermore, no positive correlation was detected between the η values estimated from the simulated sequences and those estimated from the actual sequences ( = −0.04, P = 0.72; fig. 3c inset). These results indicate that the different codon frequenciesof different clades are insufficient to explain the observed η heterogeneity.
Fourth, we also tested the effect of the genetic distance (d) between two species in a clade on the estimated η value. Sequence evolution under a series of d values between 0.05 and 5.5 was simulated, whereas all other parameters were unchanged. Although there is a positive correlation between the estimated η and d, η varies only within the range of 0.8–1.07 (fig. 3d), and no positive correlation exists between η and d in the real data (supplementary fig. S1c, Supplementary Material online). Hence, d cannot be a major factor driving the observed among-clade η variation in real data.
Although individual variations of the above parameters cannot explain the observed η variation, it remains possible that clade-specific combination of , , , and d can produce the observed heterogeneity of η. To examine this possibility, we simulated 90 pairs of sequences using the corresponding, , , and d estimated from each of the 90 real clades, but with the single set of Grantham-matrix-derived relative amino acid exchangeabilities (REs). Although some estimated η values from these 90 simulated sequence alignments deviate substantially from 1, most are still concentrated within a small range from 0.7 to 1.0, with only two clades showing η > 1 (fig. 3e). Furthermore, the correlation between these η estimates and those from the real data is moderate ( = 0.25, P = 0.016; fig. 3e inset). Thus, the combined variation of these parameters cannot explain most of the observed variation of η among the 90 clades.
Given the above set of largely negative findings, we used simulations to investigate the impact of the last component, REs, on η. Starting from the REs used above, we created a series of modified REs by randomly increasing or decreasing each original RE by a certain percentage, or by shuffling REs between different amino acid pairs (see Materials and Methods). Under constant , , and d, we conducted simulations with these different REs and found a large variation in the estimated η among the simulated clades. For example, the estimated η ranges from 0.37 to 1.52 when a series of REs that are 90% different from the original REs are used (fig. 4a). This level of variation largely matches that observed from the real data; importantly, the estimated η varies from below 1 to well above 1. Thus, variation in REs could in principle explain the observed heterogeneity in η
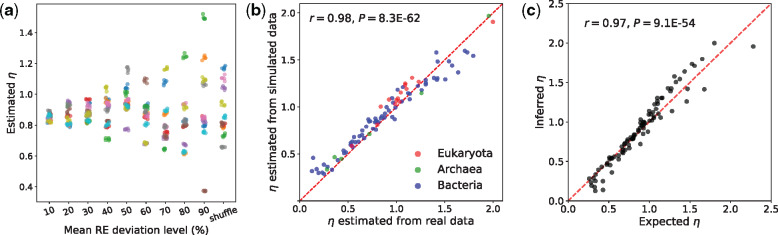
Variation of REs among clades can explain η variation. (a) Simulations with RE values based on the Grantham matrix (see Materials and Methods). For each of the ten new RE sets at a given level of deviation from or shuffled from the original values, five replicate sequence evolution simulations are conducted and the corresponding η estimates are plotted. Different RE sets at each deviation level and from each independent shuffle are distinguished by different (randomly assigned) colors. (b) The η’s estimated from the 90 clades simulated using the corresponding RE values of the real clades are plotted against the η’s estimated from the real clades. Dots are colored by the corresponding taxonomic group of the clades, as shown in the legend. The dashed red line indicates y = x. The y-axis value of each dot is the mean estimate from ten replicate simulations. (c) The expected η computed from the estimated REs and codon frequencies of each clade is plotted against the η estimated by the likelihood method from the alignment of the clade. The dashed red line indicates y = x. The y-axis value of each dot is the mean estimate from ten replicate simulations.
We recently used the codeml program in PAML to estimate and REs from each of the 90 clades examined here (Zou and Zhang 2019) (see Materials and Methods). To further verify that the RE variation explains the η variation, we simulated the 90 pairs of sequences using the respectively estimated REs, keeping , , , and d constant. Interestingly, the η’s estimated from the simulated sequences closely match those estimated from the real sequences (r = 0.98, P = 8E-62; fig. 4b), and this is true to each of the three domains of life (r > 0.97, P < 1E-4 for each domain). This finding strongly suggests that the among-clade variation in REs is the primary cause for the observed η variation among evolutionary lineages. We note that the η’s estimated from the simulated sequences are slightly inflated when compared with those estimated from the real sequences (fig. 4b), likely because all simulated sequences were generated under the same set of , , , and d instead of each clade’s specific values.
In theory, η is the mean RE for amino acid changes caused by nonsynonymous transitions, weighted by the corresponding frequencies of codon pairs, divided by its counterpart for nonsynonymous transversions (see Materials and Methods). To validate this relationship, we calculated η for each of the 90 clades from the estimated REs and codon frequencies of each clade. These calculated η values are very strongly correlated with the likelihood estimates of η from the real data (r = 0.97, P = 9E-54; fig. 4c), supporting the proposed mathematical relationship between η and REs.
Robustness of the above Finding to Potential Model Misspecification in η Estimation
Model-based analysis could yield misleading results if the assumed model differs from the reality and the analysis is sensitive to model misspecification (Zhang 1999). In our η estimator, is assumed constant across codons along a sequence despite the commonality of substitution rate heterogeneity (Zhang and Gu 1998; Yang 2006) and hence heterogeneity. To investigate whether this model simplification had affected our conclusion, we simulated sequence evolution under equation (1) with varying among codons following a gamma distribution, where the shape parameter measures the extent of this variation. We found that, under a diverse set of parameters of , d, , and mean , the η estimates from the simulated sequences are largely accurate (supplementary fig. S2a–c, Supplementary Material online). Although biased estimation of η does exist under extreme parameter settings such as d = 5, = 20, and = 0.2 (last plots in supplementary fig. S2a and b, Supplementary Material online), the bias tends to underestimate the deviation of η from 1, potentially masking the among-clade heterogeneity in η.
Additionally, in the presence of among-codon variation, we simulated a set of sequence alignments in which each codon along a sequence follows one of ten different codon equilibrium frequencies created by shuffling the 61 numbers in the original . Even with such an extensive and radical codon compositional heterogeneity, deviation of estimated η from the true value is <10% (supplementary fig. S2d, Supplementary Material online).
We also simulated sequence evolution under equation (2) with among-codon variation of following a gamma distribution with = 1 and confirmed that none of the variations of (supplementary fig. S3a, Supplementary Material online), mean (supplementary fig. S3b, Supplementary Material online), π (supplementary fig. S3c, Supplementary Material online), d (supplementary fig. S3d, Supplementary Material online), or their combination (supplementary fig. S3e, Supplementary Material online) can explain the large heterogeneity in η observed from the real data. By contrast, in the presence of among-codon variation of , varying amino acid exchangeabilities produces η’s ranging from 0.55 to 1.35 (supplementary fig. S4a, Supplementary Material online). Furthermore, when sequences are simulated with REs inferred from the real data and with among-site variation, the η’s estimated from the simulated sequences correlate strongly with those estimated from the real data (r = 0.98, P = 4.5E-62; supplementary fig. S4b, Supplementary Material online). Thus, our conclusion that the large among-clade variation in η is caused primarily by the variation in REs is robust to model simplification about among-codon variation in selection intensity.
Another major model simplification in our inference of η is that we considered only one aspect of mutational bias, transition bias. To confirm that this model simplification had not affected our conclusion, we simulated sequence evolution under equation (3) as follows:
Equation (3) is a more general version of equation (2) that allows a more complex mutational scheme. Here, mutations follow a General Time-Reversible (GTR) model, with mutability between nucleotides m and n. We estimated the six parameters from 4-fold degenerate sites of each of the 90 clades and used these values to simulate sequence evolution, while keeping other parameters constant across clades. Although there is a positive correlation between η’s estimated from the simulated sequences and those estimated from the real data (r = 0.46, P = 5.8E-6; supplementary fig. S5a, Supplementary Material online), the correlation is much weaker than that when REs estimated from the actual data were used in the simulation (fig. 4b and supplementary fig. S4b, Supplementary Material online). A similar result was obtained when the among-codon variation was also included in the simulation (supplementary fig. S5b, Supplementary Material online). Hence, the observed among-clade η variation cannot be caused primarily by the mutational biases that are ignored in η inference.
The third major model simplification in our analyses is the negligence of potential natural selection on synonymous mutations. One can see from equation (1) that η is the transition bias of nonsynonymous substitutions (η) relative to that of synonymous substitutions (). The among-clade variation of exceeds that of η (blue dots in supplementary fig. S6, Supplementary Material online). Under the assumption that synonymous transition bias equals mutational transition bias, we have interpreted η as the fixation probability of nonsynonymous transitions relative to that of nonsynonymous transversions. In reality, however, synonymous mutations may not be completely neutral. Hence, it is possible that synonymous transition bias differs from mutational transition bias, due to selections related to nucleotide composition (Long et al. 2018), mRNA folding (Bartoszewski et al. 2010; Park et al. 2013; Yang et al. 2014; Presnyak et al. 2015), translation efficiency (Ikemura 1981; Kanaya et al. 1999; Akashi 2003; Rocha 2004; Qian et al. 2012; Spencer and Barral 2012), translation accuracy (Drummond and Wilke 2008), protein structure and amino acid usage (Oresic and Shalloway 1998; Morton 2001; Pechmann and Frydman 2013; Błażej et al. 2017), or mutational cost (Błażej et al. 2017). Most of these factors introduce synonymous codon usage biases (Hershberg and Petrov 2008). Some of them (e.g., selection on nucleotide composition) should act similarly on synonymous and nonsynonymous mutations, whereas others may not. Hence, strictly speaking, η estimated by equation (1) should be interpreted as nonsynonymous transition bias relative to synonymous transition bias. Therefore, the among-clade variation of η is caused by among-clade variations in factors differentially influencing synonymous and nonsynonymous transition biases.
To investigate the extent to which selection on synonymous mutations impacts our results, we modified and implemented in codemlz the FMutSel model (Yang and Nielsen 2008) that explicitly includes selection on synonymous mutations, as described by equation (4):
Here, Fv is twice the effective population size multiplied by the fitness of the genotype with codon v, k (=1, 2, or 3) is the position at which u and v differ, and is the equilibrium frequency of the nucleotide at position k of codon v, and all other symbols have the same meanings as defined earlier. Because natural selection on synonymous mutations is explicitly considered here, the η estimated under this model should truly reflect the fixation probability of nonsynonymous transitions relative to that of nonsynonymous transversions. The inferences under equation (4) reveal a drastically reduced among-clade variation in synonymous transition bias () (orange dots in supplementary fig. S6, Supplementary Material online) compared with that under equation (1) (blue dots in supplementary fig. S6, Supplementary Material online), confirming that part of the previously observed variation in (blue dots in supplementary fig. S6, Supplementary Material online) arose from a variation in selection on synonymous mutations. Additionally, the among-clade variation in nonsynonymous transition bias (η) now exceeds that in synonymous transition bias () (orange dots in supplementary fig. S6, Supplementary Material online). Most importantly, the η estimates still vary substantially among the 90 clades, ranging from 0.39 to 1.72 (supplementary fig. S7, Supplementary Material online). Furthermore, these η estimates correlate strongly with those estimated under equation (1) (r = 0.73, P = 6.2E-16; supplementary fig. S7, Supplementary Material online). Thus, most of the observed among-clade variation in η (fig. 2) is not caused by ignoring natural selection on synonymous mutations in η estimation. We believe that the new η estimates are more reliable measures of the ratio of the fixation probability of transitional nonsynonymous mutations to that of transversional nonsynonymous mutations when compared with the estimates under equation (1) that ranged from 0.13 to 2.0 across the 90 clades (fig. 2), because the potential influence of selection on synonymous mutations has now been excluded. Because the RE values of the 90 clades used in the present study were previously estimated under a model with no selection on synonymous mutations (Zou and Zhang 2019), one wonders whether the RE estimator is robust to the violation of the assumption of no selection on synonymous mutations. Our computer simulation verified that it is largely robust (supplementary fig. S8, Supplementary Material online).
Discussion
In this work, we studied a potential cause of the widespread phenomenon of transition bias in coding sequence evolution and tackled the controversy of whether nonsynonymous transversions are more deleterious than nonsynonymous transitions. We developed a likelihood estimator of η, the fixation probability of nonsynonymous transitions, relative to that of nonsynonymous transversions, and showed that this estimator is reliable. Surprisingly, however, applying this estimator to 90 two-species clades across the tree of life revealed a large variation of η from significantly above 1 to significantly below 1, whereas the difference between two random halves (or two halves with contrasting ) of a genome is minimal. An extensive search showed that this among-clade heterogeneity in η is largely attributable to the recently discovered variation in amino acid exchangeabilities among evolutionary lineages (Zou and Zhang 2019). We further demonstrated that the above conclusion is robust to the negligence in η estimation of potential among-codon variation, various mutational biases, and selection on synonymous mutations.
As mentioned in Introduction, an intraspecific study in humans (Freudenberg-Hua et al. 2003) and an interspecific study in mammals (Zhang 2000) both concluded that nonsynonymous transversions are more deleterious than nonsynonymous transitions. Indeed, we observed η > 1 in three of the four mammalian clades surveyed here (the second to fourth clade in fig. 2). Nevertheless, our broader phylogenetic survey also found η < 1 in many other clades, including the clade of human and rhesus macaque (η = 0.92) (fig. 2). Thus, although these previous findings might not be wrong, they provided an incomplete picture.
In summary, our study showed that whether nonsynonymous transversions are overall more deleterious than nonsynonymous transitions varies with species. Of all possible factors we have investigated, the among-species variation in amino acid exchangeabilities is the primary cause of the among-species variation in η. The among-species variation in amino acid exchangeabilities is probably a result of proteome-wide changes in the physicochemical environments of amino acid residues during evolution (Zou and Zhang 2019), but more studies are required to gain a better understanding of its exact origin. Regardless, multiple recent studies have investigated amino acid exchangeabilities (or related relative substitution rates) and reported cases of species-specificity (Dang et al. 2010; Chen et al. 2019; Weber and Whelan 2019). The variations of amino acid exchangeabilities and η among species demonstrate that even some of the most fundamental parameters of protein and DNA sequence evolution vary among evolutionary lineages, which cautions against assuming a constant molecular evolutionary model across all life forms.
Materials and Methods
Sequence Data
The sequence alignments used in this study were from Zou and Zhang (2019) and the full list of the 90 clades surveyed is in supplementary table S1, Supplementary Material online. Sequence data used were retrieved from various sources listed in supplementary table S1, Supplementary Material online. Specifically, coding sequence alignments of four mammalian clades, fruitflies, and yeasts were directly retrieved from respective databases. For each of the other eukaryotic clades, we queried in Ensembl (https://useast.ensembl.org/index.html; last accessed August 17, 2020) a list of all one-to-one orthologous genes for the pair of species and downloaded their coding sequences. The coding sequences were translated into protein sequences using MACSE v1.02 (Ranwez et al. 2011). Local pairwise protein sequence alignment was performed for each pair of orthologs by MAFFT v7.294b (Katoh and Standley 2013) using the L-INS-i algorithm. The corresponding coding sequence alignment was then derived using a custom Python script. All prokaryotic clades were sampled from strains available in the ATGC database (Kristensen et al. 2017). All alignments were filtered so that no gaps, missing data, or ambiguous codons exist. The alignments have been deposited to GitHub (https://github.com/ztzou/REvariation; last accessed August 17, 2020).
Modification of the Codeml Program
We modified the codeml program in PAML 4.8 (Yang 2007) and named the modified program “codemlz.” To use codemlz, one should use the following model setting (following the original codeml control file): seqtype = 1, CodonFreq = 3, clock = 0, model = 0, NSsites = 0, Mgene = 0, fix_alpha = 1, and alpha = 0. To conduct inferences under the FMutSel model, one should use: seqtype = 1, CodonFreq = 7, estFreq = 1, clock = 0, model = 0, NSsites = 0, Mgene = 0, fix_alpha = 1, and alpha = 0. Two options are added to the control file for η estimation: “fix_eta” and “eta.” Setting fix_eta = 0 allows inferring η with the initial value specified by eta, whereas setting fix_eta = 1 assumes a fixed η with the value specified by eta. The inferred η value is output to the “mlc” file generated by the program. The codemlz program can be accessed from GitHub (https://github.com/ztzou/codemlz; last accessed August 17, 2020).
Inference of η
We used codemlz to estimate η. We ran codemlz on a given sequence alignment 30 times, with three replicate runs of each of ten different initial η values (from 0.1 to 50), to avoid spurious results. The run yielding the highest likelihood provided the likelihood estimates of model parameters under the alternative hypothesis (H1) in which η is unconstrained. We further performed three replicate runs under the null hypothesis (H0) in which η = 1.0. The run with the highest likelihood offered the model parameters under H0. H1 and H0 were compared via a likelihood ratio test with one degree of freedom. Parameters inferred under H1 (,, , and η) were used in all downstream analyses.
Inference of
To estimate for each gene in each clade, we used codeml in PAML 4.9e. Filtered alignments of individual genes were used as input. Codeml was called with the parameter setting of seqtype = 1, CodonFreq = 3, clock = 0, model = 0, NSsites = 0, Mgene = 0, fix_kappa = 0, kappa = 2.0, fix_omega = 0, omega = 0.4, fix_alpha = 1, and alpha = 0. When conducting inferences under the FMutSel model, we used seqtype = 1, CodonFreq = 7, estFreq = 1, clock = 0, model = 0, NSsites = 0, Mgene = 0, fix_kappa = 0, kappa = 2.0, fix_omega = 0, omega = 0.4, fix_alpha = 1, and alpha = 0.
Inference of GTR Parameters
To estimate parameters of the GTR model in each clade, we used the program baseml in PAML 4.9e. Four-fold degenerate sites in the concatenated coding sequence of each clade were used as input. Baseml was called with the parameter setting of model = 7, Mgene = 0, clock = 0, fix_kappa = 0, kappa = 5, fix_alpha = 0, and alpha = 0.5.
Simulating Coding Sequence Evolution
Simulations in figure 1 and supplementary figure S2, Supplementary Material online, followed the codon substitution model specified by equation (1). Simulations in figures 3 and 4 and supplementary figures S3 and S4, Supplementary Material online, followed the model specified by equation (2). Simulations in supplementary figure S5, Supplementary Material online, followed the model specified by equation (3). To simulate a clade with a pair of sequences, a transition matrix of 61 codons × 61 codons was first derived. For each codon pair, the instantaneous rate of substitution was set as in equation (1) or (2). The resultant rate matrix was normalized to have a total rate of 1, and the transition matrix was then given by (Yang 2006). At each position, the codon in an ancestral species was randomly generated according to the equilibrium codon frequencies. This codon evolved under a Markov process, based on the genetic distance d and the matrix , to arrive at the codon in species 1 and species 2, respectively, each with a genetic distance of d/2 from the ancestral species. Across the 90 clades, the median estimates (with one significant digit retained) are d = 1 substitution per codon, = 2, = 0.06, and η = 0.9. In all simulations, except for the factor that varied in the simulation, parameters (e.g., d, , , and ), if applicable, were set to the above median values across all clades to ensure a realistic scenario. As mentioned, we simulated coding sequences of 500,000 codons for each clade. The original RE values associated with equation (2) were set to element-wise inverse of the Grantham matrix (Grantham 1974) stored in the PAML 4.9e package (Yang 2007). Note that there are 75 RE values, each for one pair of amino acids that can be converted from each other by a single nucleotide change. In figure 4a and supplementary figure S4a, Supplementary Material online, to obtain each set of 75 new RE values, we sampled 75 x values from a beta distribution with parameter a = 2 and mean equal to the desired level of RE difference. Each of the 75 new REs equaled the original value plus Ix, where I is a random variable with a 50% probability of being 1 and a 50% probability of being −1. New REs leading to the last column (“shuffle”) were derived from matrices generated by shuffling the elements in the above-mentioned element-wise inverse of the Grantham matrix. The simulation in figure 4b and supplementary figure S4b, Supplementary Material online, followed equation (2), where RE values were obtained from Zou and Zhang (2019). These values were estimated from the respective alignments of real sequences using codeml with the following setting: count codon frequencies for each individual codon; no clock; model 0 for coding sequence (one ); NSsites = 0; fixed alpha = 0; omega and kappa are not fixed; control parameter aaDist = 7. In simulations of supplementary figures S2–S4, Supplementary Material online, variation of or among sites was modeled by a discrete gamma distribution of 100 categories, with its mean equal to the specified value for the whole sequence.
Expected η from RE Values and Codon Frequencies
The calculation of expected η follows the following:
Here, u and v are the codons before and after a single nucleotide substitution, respectively; i and j ≠ i are the amino acids encoded by u and v, respectively; NI and NV are the sets of nonsynonymous transitions and nonsynonymous transversions, respectively; and n is the number of codon pairs belonging to each set.
Acknowledgments
We thank Daohan Jiang, Daniel Lyons, and three anonymous reviewers for valuable comments. This work was supported by the U.S. National Institutes of Health research grant R01GM120093 to J.Z.