 Relevance of Higher-Order Epistasis in Drug Resistance
Molecular Biology and Evolution


- Altmetric
We studied five chemically distinct but related 1,3,5-triazine antifolates with regard to their effects on growth of a set of mutants in dihydrofolate reductase. The mutants comprise a combinatorially complete data set of all 16 possible combinations of four amino acid replacements associated with resistance to pyrimethamine in the malaria parasite Plasmodium falciparum. Pyrimethamine was a mainstay medication for malaria for many years, and it is still in use in intermittent treatment during pregnancy or as a partner drug in artemisinin combination therapy. Our goal was to investigate the extent to which the alleles yield similar adaptive topographies and patterns of epistasis across chemically related drugs. We find that the adaptive topographies are indeed similar with the same or closely related alleles being fixed in computer simulations of stepwise evolution. For all but one of the drugs the topography features at least one suboptimal fitness peak. Our data are consistent with earlier results indicating that third order and higher epistatic interactions appear to contribute only modestly to the overall adaptive topography, and they are largely conserved. In regard to drug development, our data suggest that higher-order interactions are likely to be of little value as an advisory tool in the choice of lead compounds.
Introduction
The enzyme dihydrofolate reductase (DHFR) is a key target for antibiotic, antimalaria, and anticancer drugs. Trimethoprim is prescribed for many bacterial infections and is also widely used in livestock feed. Pyrimethamine was a mainstay medication for malaria for almost a decade, and it is still in use in intermittent treatment during pregnancy or as a partner drug in artemisinin combination therapy. Methotrexate is used against certain cancers and autoimmune diseases. The efficacy of all three drugs has been compromised by the evolution of drug resistance in the population being treated, be it bacteria, malaria parasites, or cancer cells.
DHFR is a favorable target for drugs because it is an essential enzyme and resistance mutants are in DHFR itself rather than in drug import, export, detoxification, or other mechanisms (Toprak et al. 2012). For this reason, DHFR has also become a model for studying the molecular evolution of drug resistance (Lozovsky et al. 2009; Costanzo and Hartl 2011; Bershtein et al. 2015; Palmer et al. 2015; Rodrigues et al. 2016; Rodrigues et al. 2019).
Pyrimethamine resistance in the malaria parasite evolves by the stepwise acquisition of four amino acid replacements (Wang et al. 1997). The temporal order in which these are acquired is constrained owing to interactions among the replacements (Lozovsky et al. 2009). Such interactions constitute epistasis, and for four mutant sites there are (in addition to four main effects) 11 epistatic effects consisting of six pairwise interactions, four three-way interactions, and one four-way interaction. A quantitative analysis of these interactions is made possible by analyzing a combinatorially complete data set (Weinreich et al. 2006), which consists of the phenotypes of all possible combinations of a set of mutations. For n mutant nucleotide sites or genes, each with two possible states (mutant and wild type), there are 2n such combinations.
Geneticists have recognized and studied pairwise interactions since the beginning of modern genetics, but higher-order interactions have usually been ignored, largely because combinatorially complete data sets were unavailable and no framework for interpretation was available. Modern methods of gene and genome manipulation have made it possible to create combinatorially complete data sets, and both geometrical (Crona et al. 2013) and analytical (Weinreich et al. 2013) methods have been developed to describe the adaptive topographies. In this article, we adopt the analytical framework using Fourier–Walsh transforms, which creates a set of linear contrasts yielding an estimate of the contribution of each of the epistatic terms to the overall adaptive topography (Weinreich et al. 2018).
Although studies of pairwise and higher-order epistasis reveal gene-by-gene or gene-by-genome interactions, they fail to address how environmental perturbations might change these interactions (Hartl 2014). The key issue is whether epistatic effects are largely conserved in similar environments, or whether they are highly labile and unpredictable. It is known that major environmental changes, such as different classes of antimicrobial drugs, can often change the main effects of alleles (Hastings and Sibley 2002; Matsui and Ehrenreich 2016; Wang et al. 2019), and it is likely that changes in the main effects also alter higher-order interactions. The effects of smaller perturbations are not known, but they may be smaller than intuition might at first suggest. For example, fitness exhibits diminishing-returns epistasis (Kryazhimskiy et al. 2014), and this pattern may be conserved even with changes in rank order of the main effects.
The present study was designed to investigate the extent to which small perturbations in the environment alter the main and epistatic effects of mutations in DHFR. The perturbations correspond to five chemically modified versions of a 1,3,5-triazine antifolate (Hunt et al. 2005), and the combinatorially complete data set consists all 16 possible combinations of four amino acid replacements in the DHFR of the malaria parasite Plasmodium falciparum (Lozovsky et al. 2009). Levels of resistance to the antifolates were estimated from experiments carried out using a system in budding yeast, Saccharomyces cerevisiae, developed by Sibley and Macreadie (2001) and Hastings and Sibley (2002). We find that the main effects as well as all of the two-way and higher-order interactions are largely conserved across the triazine antifolates, despite rather large differences in their efficacy as DHFR inhibitors. The conserved patterns of main effects and epistasis observed with the triazine antifolates contrast strongly with those observed for pyrimethamine, a chemically dissimilar aminopyrimidine.
Results
Antifolate Structures
Chemical structures of the five triazine antifolates and pyrimethamine are illustrated in figure 1. The triazine molecules denoted c57–c61 have various functional groups attached to a 1,3,5-triazine ring. Pyrimethamine has a very different structure, being a chlorophenyl derivative of ethyl diaminopyrimidine.

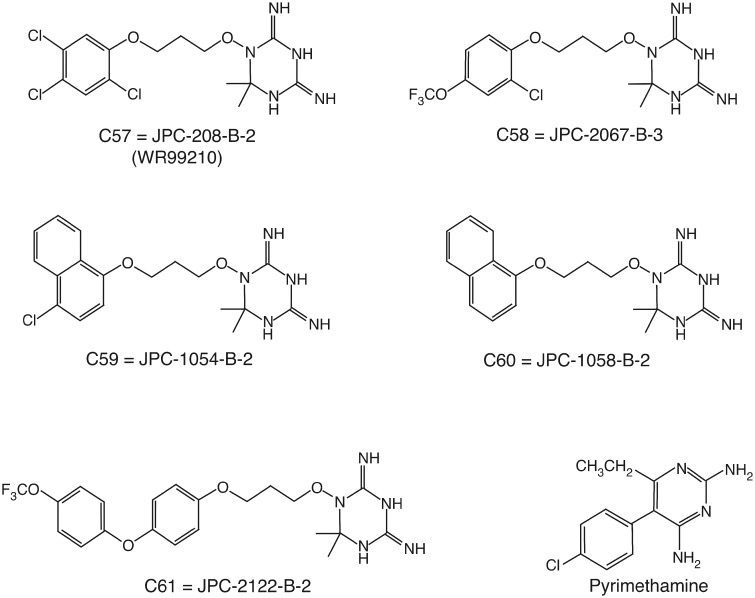
Structures of triazine antifolates versus pyrimethamine.
We tested the triazine antifolates against a combinatorially complete data set consisting of all 16 possible combinations of four amino acid replacements associated with pyrimethamine resistance. This set of mutants was chosen because the potential efficacy of any new antifolates must take into account preexisting polymorphisms selected for pyrimethamine resistance. The 16 allele designations are decimal equivalents of a binary code, with allele 0000 (decimal 0) denoting the wildtype P. falciparum DHFR with amino acid sites N51, C59, S108, and I164. The single mutants are I164L = 0001 (decimal 1), S108N = 0010 (decimal 2), C59R = 0100 (decimal 4), and N51I = 1000 (decimal 8). Double and triple mutants consist of quadruples of 0 s and 1 s according to whether each site of wildtype or mutant. The quadruple mutant is 1111 (decimal 15). Supplementary table S1, Supplementary Material online, lists the decimal and binary allele designations along with the amino acid replacements that each contains.
Adaptive Topographies
Figure 2 shows the levels of resistance of the 16 possible genotypes against each of the triazine antifolates. The measure of resistance is IC50 (inhibitory concentration 50), that concentration of drug that reduces the growth rate in the absence of drug by 50%. Figure 2 is plotted as the logarithm of IC50, where the drug concentration is in nanomoles per liter. The untransformed IC50 estimates are tabulated in supplementary table S1, Supplementary Material online. In figure 2, in each panel the asterisk denotes the logarithm of the mean IC50 across all alleles. These data define the adaptive topography of the DHFR alleles for each of the drugs.
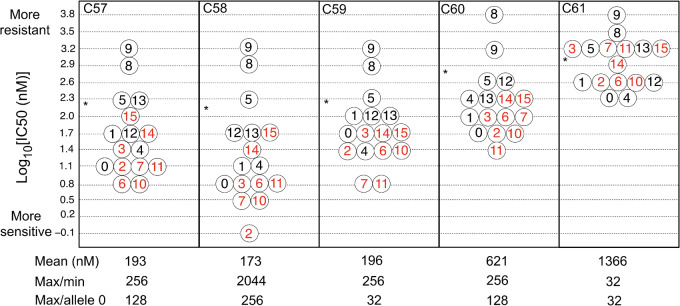
IC50 values of the triazine antifolates. Alleles are numbered 0 (binary 0000, wildtype) to 15 (binary 1111, which carries all four mutations). Those in red include S108N. The asterisk denotes the position of the arithmetic mean IC50 on the logarithmic scale.
A number of features of the adaptive topographies are noteworthy. First, the mean IC50 differs across the drugs by a factor of nearly 8 (173 nM for c58 vs. 1,366 nM for c61). Second, the ratio of maximum resistance to minimum resistance (max/min) differs markedly among the drugs, from 32 for c61 to 2,044 for c58. Third, the S108N replacement is consistently associated with greater drug sensitivity. Across all of the drugs, alleles carrying the wildtype serine-108 are above/below the median resistance in the ratio 27/12, whereas the alleles carrying the mutant 108-asparagine are above/below the median resistance in the ratio 10/27 (P = 0.0003, Fisher’s exact test). This finding is unexpected in light of the fact that S108N is a major driver of resistance against pyrimethamine (Lozovsky et al. 2009), but it is consistent with earlier results with drug c57 (WR99210) (Hastings and Sibley 2002). Note, however, that c61 is an exception in as much as the S108N replacement is evenly distributed above and below the median, although this may simply reflect the degree to which all DHFR alleles are bunched together at the higher levels of resistance.
There is a consistency of the DHFR alleles across the triazine antifolates in that the rank of alleles across drugs is more consistent than would be expected by chance. To quantify this finding, we first ranked all 16 alleles across all five drugs taking ties into account. A null distribution of variance across drugs was obtained by analyzing 100,000 ranks randomly sampled across the observed distributions. The variance across drugs of alleles 0, 1, 5, 8, 9, 12, 13, 14, and 15 was significantly smaller than that of the null distribution (P < 0.05). Of these, only alleles 14 and 15 carry S108N. In other words, 7/8 alleles with S108 have a variance across drugs significantly smaller than the null distribution, but only 2/8 alleles with 108N have this property. This difference is itself statistically significant (P = 0.04, Fisher’s exact test). The difference in consistency across drugs between S108 and 108N is largely due to alleles 5, 8, 9, 12, and 13, which consistently rank among the most resistant alleles across all of the tiazine antifolates.
Despite the number of cases in which pairs of alleles have a resistances values within one standard error of the mean (SEM) (these are denoted “ties” and are grouped together in the same bin in fig. 2), each triazine antifolate has one and only one most-resistant allele. For the drugs c57, c58, c59, and c61 this allele is 9 (allele 1001 in binary), and for drug c60 it is allele 8 (1000), which differs from allele 9 only in having I164 instead of 164L.
Simulated Evolution in Sequence Space
To understand the evolutionary implications of figure 2, we carried out computer simulations to track the trajectories of DHFR evolution under drug pressure in a large population initially fixed for allele 0 (binary 0000), as the contemporary effective population size of African populations has been estimated a 107–108 (Chang et al. 2012). Evolution was simulated 10,000 times for each drug, and the trajectories recorded from allele 0 to each intermediate state to some final equilibrium allele that could no longer be replaced.
The simulations are based on a weak mutation-strong selection model of evolution, in which mutations take place infrequently and selection is sufficiently strong that the fixation or loss of each new mutation occurs before the next mutation enters the population. The population size is assumed to be sufficiently large and drug pressure sufficiently intense that mutations that decrease resistance cannot become fixed by chance. A flow chart summarizing the weak mutation-strong selection algorithm used in the simulations is included in supplementary figure S1 in Lozovsky et al. (2009).
The simulations include three sources of randomness. The first is a random choice of adaptive landscape. Although the alleles in figure 2 are binned, the estimated resistance of each allele has its own SEM (supplementary table S2, Supplementary Material online). The estimated SEMs average ∼0.047 times the magnitude of the mean, hence they are small relative to the size of the bins. But for alleles within bins the uncertainty in the estimates is important. Because of the uncertainty, each panel of figure 2 defines an ensemble of adaptive landscapes, each differing slightly from one to another. To take the uncertainty into account, we used the fact that the distribution of means is Gaussian with a mean equal to the true mean and a standard deviation equal to the SEM. The first step in each simulation was therefore to obtain a resistance value for each allele by randomly choosing a number from a normal distribution of resistances with mean equal to the mean of the allele and standard deviation equal to the SEM. The SEM is sufficiently large to resolve ties within each bin, but not so large as to switch an allele from one resistance bin to another. For each drug, a random allocation of resistance to each of the 16 alleles defines one member of the ensemble of adaptive topographies for the drug.
The second source of randomness in the simulations is mutation bias. Because the DHFR alleles are those from P. falciparum, it is appropriate to use the rather large mutation bias observed in this organism (supplementary table S3 in Lozovsky et al. 2009). These mutation biases are as follows:
N51I forward mutation 0.137, reverse 0.154
C59R forward mutation 0.112, reverse 0.195
S108N forward mutation 0.162, reverse 0.120
I164L forward mutation 0.051, reverse 0.069
Any currently fixed allele can mutate in any of four ways. In the simulations, the probabilities of these mutations are based on the relative magnitudes of the values above, normalized to sum to 1, for each of the four possibilities.
The third source of randomness in the simulations is the probability of fixation of a new mutation, given its resistance (fitness) relative to the currently prevailing allele. For this purpose, we use a model of Fisher (1922) that assumes a Poisson distribution of offspring number in an infinite population. Given a new mutation with fitness 1 + s relative to a value of 1 for the prevailing allele, Fisher's model implies that the probability that the new mutation ultimately survives equals 1 – d where d is the smallest positive solution of d = Exp[(1 + s)(1 – d)].
Evolutionary Trajectories
Table 1 lists the principal evolutionary trajectories for all five triazine antifolates and also pyrimethamine. The allele substitutions are listed as they occur, and the list terminates when an allele can no longer be replaced. The table list the percentage of each path observed in the simulations, and includes only those pathways that account for at least 5% of the simulations. (A complete list is included as supplementary table S3, Supplementary Material online.) The paths are all relatively short with few intermediate steps. Except for the antifolate c59, for which the path allele 0–8–9 is followed without exception, the other inhibitors show a variety of outcomes. The paths for c57 and c58 are similar to each other and quite predictable, with the principal paths accounting for 83% and 95% of all outcomes, respectively. The paths for c60 are also quite predictable but usually end at allele 8 instead of allele 9. (Alleles 8 and 9 differ only in the absence or presence of I164L.) By contrast the paths for c61 are highly variable owing to the close clustering of the resistance values (fig. 2) and the many ties. For c60, the principal paths in the ensemble account for only 23% of the outcomes. Table 1 also indicates that the evolutionary trajectories for resistance to the triazine antifolates are very different from those for resistance to pyrimethamine.

| Percent among 10,000 Simulated Adaptive Topographies | ||||||
|---|---|---|---|---|---|---|
| Path | c57 | c58 | c59 | c60 | c61 | PYR |
| 0 → 8 → 9 | 33 | 47 | 100 | — | 12 | — |
| 0 → 8 | — | — | — | 34 | — | — |
| 0 → 4 → 12 → 8 → 9 | 13 | 32 | — | — | — | — |
| 0 → 4 → 12 → 8 | — | — | — | 29 | — | — |
| 0 → 4 → 5 | 12 | 16 | — | 13 | — | — |
| 0 → 4 → 5 → 13 → 9 | 12 | — | — | — | — | — |
| 0 → 4 → 12 → 13 → 9 | 7 | — | — | — | — | — |
| 0 → 1 → 9 | 6 | — | — | — | — | — |
| 0 → 1 → 5 | — | — | — | 7 | — | — |
| 0 → 1→ 9 → 8 | — | — | — | 5 | — | — |
| 0 → 2 → 3 | — | — | — | — | 6 | — |
| 0 → 2 → 3 → 7 | — | — | — | — | 5 | — |
| 0 → 4 → 6 → 14 → 15 | — | — | — | — | — | 12 |
| 0 → 4 → 12 → 14 → 15 | — | — | — | — | — | 12 |
| 0 → 2 → 6 → 14 → 15 | — | — | — | — | — | 11 |
| 0 → 2 → 10 → 14 → 15 | — | — | — | — | — | 10 |
| 0 → 8→ 12 → 14 → 15 | — | — | — | — | — | 7 |
| 0 → 8 → 10 → 14 → 15 | — | — | — | — | — | 6 |
| Percent paths with P ≥ 0.05 | 83 | 95 | 100 | 88 | 23 | 58 |
The evolutionary pathways in table 1 pertain to the ensemble of adaptive topographies that take the uncertainty of estimates of the resistance levels into account. Simulations were also carried out based on the binned resistance levels, in which the only sources of variation are those due to biased mutation and the probability of survival of a new favored mutation. The results are shown in supplementary table S4, Supplementary Material online. They are similar to those in table 1 for c57–c60 and also pyrimethamine, but differ substantially for c61. Simulating evolution for c61 using only the means results in only three evolutionary pathways (alleles 0–8–9 at 56%, alleles 0–2–3 at 37%, and alleles 0–1–9 at 7%). Although the pathways for c61 are more predicable using the single-adaptive topography based on the means, nevertheless only 63% of the outcomes converge to the allele with the highest level or resistance.
Ultimate Allele Fixations: Optimal and Suboptimal Fitness Peaks
For each of the drugs in figure 2, there is a single allele that yields the maximum level of resistance. The data in table 2 show the percentages of simulations for each drug in which the evolutionary pathway ultimately converges on the maximally resistant allele (italic font). Except for c59, some of the pathways end with submaximal alleles, with the number of such alternative pathways ranging from 1 (c57 and PYR) to 4 (c61), and total percentages from 15.19 (PYR) to 57.35 (c61).
| Antifolate | ||||||
|---|---|---|---|---|---|---|
| c57 | c58 | c59 | c60 | c61 | PYR | |
| Allele with maximum fitness | 9 | 9 | 9 | 8 | 9 | 15 |
| Allele at equilibrium | ||||||
| 3 | — | — | — | 1.7 | 12.18 | — |
| 5 | 18.5 | 18.12 | — | 22 | 10.63 | — |
| 7 | — | — | — | — | 13.85 | — |
| 8 | — | — | — | 75 | — | — |
| 9 | 81.5 | 81.35 | 100 | — | 48.65 | 15.19 |
| 15 | — | 0.53 | — | 1 | 14.69 | 84.81 |
How do such submaximal pathways arise? A submaximal fitness peak exists if there is at least one path to an allele with submaximal fitness, but the allele cannot be displaced because all mutationally accessible alleles have lower fitness. These situations arise owing to certain patterns of higher-order epistasis. In general, epistasis refers to situations in which the effect of a mutation depends on the presence or absence of other mutations. Sign epistasis occurs when the beneficial effect of a mutation is magnified by the presence of an otherwise deleterious mutation. An extreme case of epistasis is reciprocal sign epistasis, in which two mutations, each deleterious on its own, are beneficial in combination (Poelwijk et al. 2007). In the context of multiple sites across a gene or genome, reciprocal sign epistasis can result in populations evolving to a suboptimal fitness peak, which means a fitness peak that is a local maximum but not a global maximum.
The results in table 2 indicate that, with the exception of c61, the ensemble of adaptive topographies yields a pattern of reciprocal-sign epistasis leading to a submaximal fitness peak with likelihoods similar to those obtained using the mean resistances (supplementary table S4, Supplementary Material online). The drug c61 is very different in this respect, as the ensemble of adaptive landscapes can lead to submaximal fitness peaks with alleles 5, 7, and 15 although these are not observed based on the adaptive topography of mean resistances. The many submaximal fitness peaks for c61 result from the multiple alleles bunched in the bins in figure 2 and the patterns of mutational interaccessibility of the alleles within the bins.
Main Effects and Their Pairwise and Higher-Order Interactions
Additional insight into the resistance patterns in figure 2 comes from partitioning the resistance phenotypes into main effects of the individual mutations and their pairwise and higher-order interactions. A convenient framework for such partitioning makes use of the Walsh transform that transforms a vector W of phenotypes in a combinatorially complete data set of alleles into another vector E whose elements are called Walsh coefficients that measure the main and interaction effects of the individual mutations constituting the alleles. The elements of W are in natural order (0, 1, 2, 3, …). The transformation is of the form (1/2n) × Ψ × W = E, where W and E are the vectors just described, n is the number of mutations in the alleles constituting the data set (in the present instance, n = 4), and Ψ is the Hadamard matrix required for estimating the main fitness effects and their epistatic interactions. The Hadamard matrix is an orthogonal 2n × 2n matrix consisting of elements +1 or −1. First used in the analysis of epistasis by Weinreich et al. (2013), the approach is described in detail in Weinreich et al. (2018).
With four biallelic sites, there are four main effects, six pairwise interactions, four three-way interactions, and one four-way interaction. The Walsh coefficients for these components and their 95% confidence intervals are listed in table 3; these are also shown graphically in supplementary figure S1, Supplementary Material online. Following Weinreich et al. (2006), we first carried out a nonparametric Kendall tau test of whether the absolute values of the Walsh coefficients conform to the naïve expectation that the relative magnitudes of the coefficients should be according to the epistatic order: first-order the largest, second-order second largest, and so forth. For c57–c61 and PYR the P values are all significant or nearly significant (P = 0.048, 0.026, 0.048, 0.075, 0.043, and 0.007, respectively). With only 16 coefficients the power of the test is weak; however, an omnibus test including all the data yields P = 6 × 10⁻⁸.
| Drug | ||||||
|---|---|---|---|---|---|---|
| Order | c57 | c58 | c59 | c60 | c61 | PYR |
| 1000 | 0.783 ± 0.012 | 0.825 ± 0.012 | 0.698 ± 0.015 | 0.784 ± 0.012 | 0.429 ± 0.020 | 0.378 ± 0.026 |
| 0100 | −0.593 ± 0.020 | −0.720 ± 0.016 | −0.651 ± 0.017 | −0.646 ± 0.018 | −0.268 ± 0.023 | 0.643 ± 0.016 |
| 0010 | −0.858 ± 0.008 | −0.929 ± 0.004 | −0.845 ± 0.008 | −0.838 ± 0.009 | −0.250 ± 0.023 | 0.701 ± 0.015 |
| 0001 | 0.391 ± 0.034 | 0.361 ± 0.038 | 0.318 ± 0.034 | −0.464 ± 0.030 | 0.464 ± 0.021 | 0.236 ± 0.029 |
| 1100 | −0.684 ± 0.016 | −0.858 ± 0.008 | −0.647 ± 0.015 | −0.744 ± 0.014 | −0.375 ± 0.021 | 0.055 ± 0.029 |
| 1010 | −0.711 ± 0.015 | −0.777 ± 0.014 | −0.682 ± 0.016 | −0.759 ± 0.013 | −0.393 ± 0.020 | 0.113 ± 0.028 |
| 1001 | 0.245 ± 0.037 | 0.223 ± 0.041 | 0.170 ± 0.037 | −0.523 ± 0.028 | 0.107 ± 0.026 | 0.160 ± 0.029 |
| 0110 | 0.664 ± 0.000 | 0.768 ± 0.000 | 0.667 ± 0.000 | 0.720 ± 0.000 | 0.304 ± 0.022 | 0.700 ± 0.013 |
| 0101 | −0.150 ± 0.038 | −0.214 ± 0.041 | −0.217 ± 0.036 | 0.464 ± 0.030 | −0.054 ± 0.026 | 0.044 ± 0.029 |
| 0011 | −0.344 ± 0.035 | −0.344 ± 0.039 | −0.328 ± 0.034 | 0.469 ± 0.030 | −0.071 ± 0.026 | −0.037 ± 0.030 |
| 1110 | 0.779 ± 0.013 | 0.903 ± 0.006 | 0.736 ± 0.013 | 0.798 ± 0.011 | 0.410 ± 0.020 | 0.143 ± 0.028 |
| 1101 | −0.233 ± 0.037 | −0.335 ± 0.039 | −0.271 ± 0.035 | 0.444 ± 0.031 | −0.161 ± 0.025 | −0.065 ± 0.030 |
| 1011 | −0.221 ± 0.037 | −0.205 ± 0.041 | −0.186 ± 0.036 | 0.508 ± 0.028 | −0.143 ± 0.027 | −0.094 ± 0.030 |
| 0111 | 0.174 ± 0.038 | 0.223 ± 0.041 | 0.201 ± 0.036 | −0.469 ± 0.030 | 0.018 ± 0.027 | 0.123 ± 0.029 |
| 1111 | 0.264 ± 0.036 | 0.357 ± 0.038 | 0.302 ± 0.035 | −0.430 ± 0.031 | 0.125 ± 0.026 | 0.032 ± 0.029 |
Although the Kendall tau tests indicate that the absolute magnitudes of the Walsh coefficients differ significantly from naïve expectation, they do tend to decline as a function of epistatic order. The P values of the regression coefficients of the absolute magnitudes against the natural numbers 1–16 for c57–c61 and PYR are 0.013, 0.025, 0.016, 0.023, 0.020, and 0.051. The P value for PYR is somewhat misleading because, except for the large synergistic Walsh coefficient associated with the interaction 0110, the squares of the 2-fold and higher-order interactions are close to 0 (table 3).
The squares of the Walsh coefficients are of interest because squared magnitude of the coefficients are monotonic in their effects on landscape topology (Weinreich et al. 2006). For each of the drugs c57–c61 and PYR, table 4 shows the proportion of the total sums of squares of all the Walsh coefficients of order 1–4 that is attributable to each order of epistasis. The first and second-order terms clearly dominate across the board. This result underscores the conclusion of Weinreich et al. (2006) that higher-order epistasis contributes only modestly to landscape topology.
| Drug | ||||||
|---|---|---|---|---|---|---|
| Order | c57 | c58 | c59 | c60 | c61 | PYR |
| 1 | 0.433 | 0.4 | 0.426 | 0.336 | 0.456 | 0.653 |
| 2 | 0.378 | 0.391 | 0.381 | 0.406 | 0.347 | 0.317 |
| 3 | 0.173 | 0.186 | 0.171 | 0.226 | 0.184 | 0.029 |
| 4 | 0.016 | 0.023 | 0.022 | 0.032 | 0.013 | 0.001 |
We now consider the extent to which patterns of epistasis are conserved across small chemical perturbations exemplified by the triazine antifolates. For ease of interpretation, the patterns of epistasis are shown in the heat map in figure 3, where the drugs are listed across the top. On the right are the single or multiple mutant sites that each Walsh coefficient refers. In the heat map, red indicates increased resistance of the main effect or a synergistic interaction in the epistatic effect, and blue indicates increased sensitivity of the main effect or an antagonistic interaction in the epistatic effect. To improve contrast, for each drug, the Walsh coefficients in the heat map have been normalized with respect to the absolute value of the coefficient with the largest absolute value.
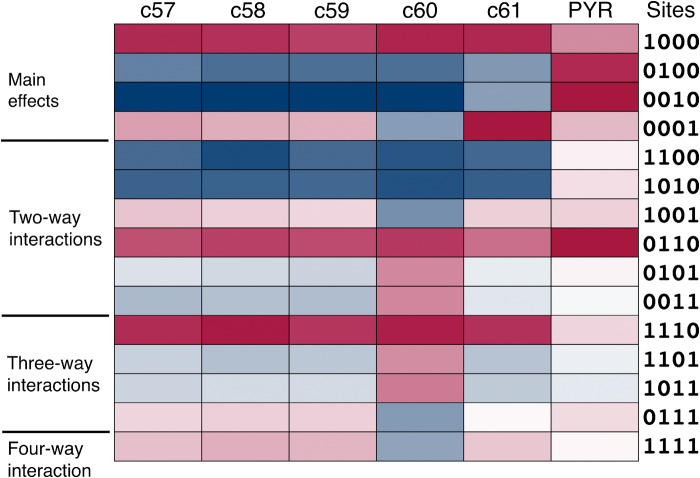
Heat map of main effects and epistatic interactions of the amino acid replacements for each of the antifolates. Red indicates greater resistance or a synergistic interaction, blue greater sensitivity or an antagonistic interaction. Color opacity is scaled in proportion to the relative numerical value.
Note first the pattern of epistasis in the aminopyrimidine antifolate pyrimethamine. The main effects are all positive, and there is virtually no second- or higher-order epistasis except for the large synergistic interaction between C59R and S108N (0110).
Among the triazine antifolates, the pattern of epistasis is conserved quantitatively across the drugs c57, c58, and c59. The pattern is conserved qualitatively but not quantitatively in c61. For c60 the pattern of epistasis is not conserved. There is a difference in sign among one of the main effects (0001), three of the two-way interactions (1001, 0101, and 1001), one of the three-way effects (0111), and the four-way interaction (1111). Among this sample of five modified triazine antifolates, the main effects and epistatic effects are largely conserved in four (c57, c58, c59, and c61).
Discussion
Transgenic yeast expressing Plasmodium DHFR has been a model for studies of antimalarial antifolates for >20 years (Wooden et al. 1997; Sibley and Macreadie 2001; Hastings and Sibley 2002). It is a suitable model because DHFR plays the same essential role in metabolism in both organisms, Plasmodium DHFR can substitute for the endogenous yeast enzyme, and inhibitors of Plasmodium DHFR that impair the growth of the parasite also inhibit the growth of transgenic yeast. The relevance of the yeast model is exemplified by its ability to recapitulate the stepwise evolution of pyrimethamine resistance that took place in the field (Lozovsky et al. 2009).
Our study was motivated by the question as to whether the main effects of mutations and their patterns of pairwise and higher-order epistasis are conserved across a set of triazine antifolates differing only in the nature and position of certain functional groups. The answer is usually but not always. We find that four of the triazine derivatives have very similar main effects and patterns of epistasis, but that one (c60) alters one of the main effects in such a way as to change the sign of many of the epistatic components. Furthermore, we find that most of the compounds (c59 is the exception) feature an adaptive topography with 1–4 suboptimal fitness peaks due to reciprocal sign epistasis, and that populations often (20–50% of simulations) converge to a suboptimal peak.
The model of evolution is one of weak mutation and strong selection in a large population, in which the fixation or loss of each new mutation is resolved before the next mutation occurs. We assume constant drug pressure for increased resistance. Mutations that increase resistance have an ultimate probability of survival calculated from Fisher’s (1922) formula, which assumes an infinite population and a Poisson distribution of progeny number. The population is always nearly fixed for one allele or another, and there are no persistent polymorphisms. One limitation is that the analysis is based on the IC50 phenotype, the drug concentration that reduces growth rate by half; however, it has been shown that adaptive landscapes including fitness optima are affected by drug concentration (Mira et al. 2015). Another limitation is that the model does not include intermittent selection for drug resistance offset by differences in growth rate in the absence of drug. Allowing for changes in drug concentration or for intermittent selection opens up an infinity of models differing in the strength and spatial or temporal pattern of drug pressure. In view of the multiplicity of outcomes in even the simplest model, little additional insight is likely to be gained from models of increased complexity.
The selection model stipulates a specific, constant adaptive topography. This would be simple, were it not that the range of resistances for some of the drugs is sufficiently narrow that the estimate of mean resistance for two or more alleles is within experimental error. In such a case the true resistances are unknown, and the “ties” need somehow to be resolved. We resolve them by choosing, for each allele, a resistance value based on a random sample from a normal distribution with standard deviation equal to the empirically determined SEM. Each independent resolution of the ties results in a slightly different adaptive topography, hence when there are tries, “the” adaptive topography is actually an ensemble of adaptive topographies, and it is this ensemble that the simulation explores.
In the simulations, some of the drugs yield large numbers of evolutionary pathways, each corresponding to a subset of the ensemble of topographies. For example, simulations for c61 yield ∼100 distinct trajectories (supplementary table S2, Supplementary Material online). Most of these are rare (each <5%), but cumulatively they account for nearly three-fourths of the outcomes (table 1).
Nevertheless, most ensembles of pathways finally settle on one of a relatively small number of possible states. The most common pathways invariably lead to the most resistant allele, but there are also many suboptimal fitness peaks (table 2).
Among the triazine antifolates, the patterns of epistasis are largely conserved, with the exception of c60. Relative to the others, the epistatic components of c60 show many changes of sign including 1/4 for main effects and 7/11 for pairwise and higher-order effects (table 3). The predominant evolutionary pathways for c60 converge on the allele 1000 (table 1), which differs from the maximally resistant allele 1001 for the other triazines. The differences between c60 and the other triazines must somehow be related to the different interactions of c60 with the active site of DHFR; however, this issue is beyond the scope of the present study.
For all of the drugs tested, third order and higher epistatic interactions appear to contribute modestly if at all to the overall adaptive topography (table 4). This finding is consistent with the results of Weinreich et al. (2018), who analyzed 16 published adaptive landscapes for fitness.
Relative to the triazine antifolates, pyrimethamine shows very little 2-fold or higher-order epistasis with the exception of the interaction between C59R and S108N (0110). This probably reflects the fact that all four amino acid replacements took place in nature under selection for pyrimethamine resistance. Furthermore, natural populations can be polymorphic for various combinations of the replacements (Lozovsky et al. 2009), which means that they have had to perform well together in combinations. With such coevolution, the substitutions would hardly occur together were they to have large antagonistic interactions. In this context it is noteworthy that the one large epistatic term (0110) is synergistic.
In contrast to pyrimethamine, these same amino acid replacements did not coevolve in the presence of triazine antifolates. With the triazines, some of the main effects are deleterious to resistance, and there are also many large antagonistic interactions (table 3, 3). This contrast bears on the interpretation of experiments examining epistasis among nucleotide or amino acid polymorphisms present in divergent lineages or among laboratory mutations. Because these polymorphisms or mutations have not coevolved, their interactions may be much larger and more antagonistic than would be found among coevolved polymorphisms segregating in the same population. Such experiments may tell one what might happen in nature, but not necessarily what does happen.
Although the subject is not quite germane, we should emphasize that the epistasis we have been discussing is physiological epistasis as distinguished from statistical epistasis (Sackton and Hartl 2016). The latter relates to the effects of interactions on allele-frequency change in polymorphic populations and depends on allele frequencies, recombination rates, and in diploids also on the degree of dominance at heterozygous sites. As far as we know there has been no analysis of statistical epistasis in terms of Walsh coefficients, but suffice it to say here that the magnitude of statistical epistasis is usually smaller, and typically much smaller, than that of physiological epistasis (Hill et al. 2008; Mäki-Tanila and Hill 2014; Sackton and Hartl 2016).
Conclusions
In summary, all of the triazine antifolates tested yield similar adaptive topographies with the same or closely related alleles being fixed in computer simulations of stepwise evolution. All but one of the topographies feature at least one suboptimal fitness peak. In regard to epistasis among the amino acid replacements, our data are consistent with earlier results indicating that third order and higher epistatic interactions appear to contribute modestly if at all to the overall adaptive topography (Weinreich et al. 2018). In addition, we find that epistatic interactions across related drugs are largely conserved except for c60. To the extent that our findings with regard to triazine antifolates will generalize to other classes of drugs, then they suggest that higher-order interactions will add little value as an advisory tool in the choice of lead compounds.
Materials and Methods
Yeast Strain Construction
Using the QuikChange Site-Directed Mutagenesis Kit (Stratagene, Cedar Creek, TX), we constructed all 16 possible combinations of point mutations at four amino acid coding sites (N51I, C59R, S108N, I164L) in the P. falciparum dhfr gene in the yeast shuttle vector GR7. The dhfr locus on each mutagenized plasmid was sequenced to verify the presence of the engineered mutations (Brown et al. 2010). GR7 is a derivative of the pRS314 shuttle vector (Sikorski and Hieter 1989; Wooden et al. 1997) and was generously provided by Carol Sibley of the University of Washington. GR7 contains the wildtype P. falciparum dhfr allele regulated upstream by 600 base pairs from the promoter region of the S. cerevisiae DFR1 gene and downstream by the 400 base pairs 3′ DFR1 transcription and translation terminators. DFR1 is the yeast ortholog of the dhfr gene in P. falciparum. GR7 also includes the TRP1 yeast biosynthetic marker, and a yeast centromere sequence that maintains the plasmid at about one copy per cell (Hunt et al. 2005).
The S. cerevisiae strain TH5 (MATa leu2-3,112 trp1 ura3-52 dfr1::URA3 tup1, also provided by Carol Sibley) was used to assay the level of resistance by each of 16 DHFR alleles to five chemically related 1,3,5-triazine antifolates (Hunt et al. 2005). TH5 lacks a functional DFR1, the yeast ortholog of the dhfr gene. When not transformed with a functional DFR1 ortholog, the strain requires media supplemented with 100 μg/ml deoxythymidine monophosphate (dTMP; Sigma-Aldrich, St. Louis, MO) for growth. The tup1 mutation increases cellular permeability to dTMP (Wooden et al. 1997). We transformed TH5 with each of the 16 alleles using the EZ Yeast Transformation Kit (Zymo, Orange, CA), selecting for the presence of the GR7 vector on tryptophan dropout media (SC trp–) supplemented with 100 µg/ml dTMP (Brown et al. 2010).
Growth-Rate Measurements
Five chemically related 1,3,5-triazine antifolates (table 1) were tested against yeast strains expressing the 16 dhfr alleles from P. falciparum. For each strain, we picked two to five colonies from a solid media plate and inoculated the appropriate liquid medium culture with our transformed yeast strains. After overnight growth, cultures were diluted to an OD600 of 0.01 (or ∼6 × 10⁴ cells/ml) in a series of concentrations of each compound in minimal medium, and then dispensed into microtiter plates. These plates were transferred to a Bioscreen C microbiological workstation (Thermo Labsystems), which recorded OD600 readings every 15 min for 2 days. The strains were cultured at 30°C. Growth rate was calculated by taking a least squares linear regression of log absorbance versus time for a 3 h sliding window over the length of the growth curve (Joseph and Hall 2004; Brown et al. 2010). Growth rates represent the maximum regression coefficient among all sliding windows.
IC50 Calculations
We calculated the resistance of each strain using inhibitory concentration 50 (IC50) measurements, which represent the compound concentration at which growth rate is reduced by 50% relative to growth in the absence of the compound. Calculations of IC50 values were obtained as described elsewhere (Brown et al. 2010).
Analytical Methods
Analytical methods and simulations were carried out as described in the Results using custom scripts written in Mathematica. The null distribution for ranks across all triazine compounds was obtained using the RandomSample function, and the variance of ranks across all compounds calculated and compared with the observed variance of ranks.
Acknowledgments
We thank Daniel M. Weinreich for providing details for estimating Walsh coefficients. This study was supported by a National Institutes of Health grant (No. R01AI099105) to Dyann F. Wirth and D.L.H.