 MICOS subcomplexes assemble independently on the mitochondrial inner membrane in proximity to ER contact sites
The Journal of Cell Biology


- Altmetric
Tirrell et al. determine that subcomplexes of the cristae-organizing MICOS complex assemble independently of one another on the mitochondrial inner membrane in proximity to contact sites between mitochondria and the endoplasmic reticulum.
MICOS is a conserved multisubunit complex that localizes to mitochondrial cristae junctions and organizes cristae positioning within the organelle. MICOS is organized into two independent subcomplexes; however, the mechanisms that dictate the assembly and spatial positioning of each MICOS subcomplex are poorly understood. Here, we determine that MICOS subcomplexes target independently of one another to sites on the inner mitochondrial membrane that are in proximity to contact sites between mitochondria and the ER. One subcomplex, composed of Mic27/Mic26/Mic10/Mic12, requires ERMES complex function for its assembly. In contrast, the principal MICOS component, Mic60, self-assembles and localizes in close proximity to the ER through an independent mechanism. We also find that Mic60 can uniquely redistribute adjacent to forced mitochondria–vacuole contact sites. Our data suggest that nonoverlapping properties of interorganelle contact sites provide spatial cues that enable MICOS assembly and ultimately lead to proper physical and functional organization of mitochondria.
Introduction
To efficiently generate ATP, the inner mitochondrial membrane (IMM) is organized into distinct morphological domains (Cogliati et al., 2016; Zick et al., 2009). Assembled respiratory complexes reside in cristae, regions of the IMM that invaginate into the interior of the organelle (Appelhans et al., 2012; Stoldt et al., 2018; Vogel et al., 2006; Wurm and Jakobs, 2006). Cristae are continuous with boundary regions, segments of the IMM that are apposed to the outer mitochondrial membrane (OMM). Boundary and cristae membranes are connected via cristae junctions (CJs), narrow membrane tubules thought to act as diffusion barriers to prevent ions and assembled respiratory complexes from freely moving between domains (Mannella et al., 1994).
CJ organization is regulated by the mitochondrial contact site and cristae organizing system (MICOS), an approximately megadalton complex that concentrates at CJs (Fig. 1 A; Colina-Tenorio et al., 2020). MICOS is composed of six core subunits in yeast, and each subunit is conserved at either the sequence or structural level in human cells. MICOS is required for normal mitochondrial morphology and ultrastructure and, correspondingly, for optimal growth of cells in conditions that require mitochondrial respiration (Alkhaja et al., 2012; Balsa et al., 2019; Guarani et al., 2015; Harner et al., 2011; Hoppins et al., 2011; John et al., 2005; Ott et al., 2015; Rabl et al., 2009; von der Malsburg et al., 2011). Deletion of any MICOS subunit in yeast causes a drastic reduction in CJs, and mitochondria adopt an aberrant lamellar morphology, likely caused by parallel stacking of cristae membranes (Fig. 1 A).

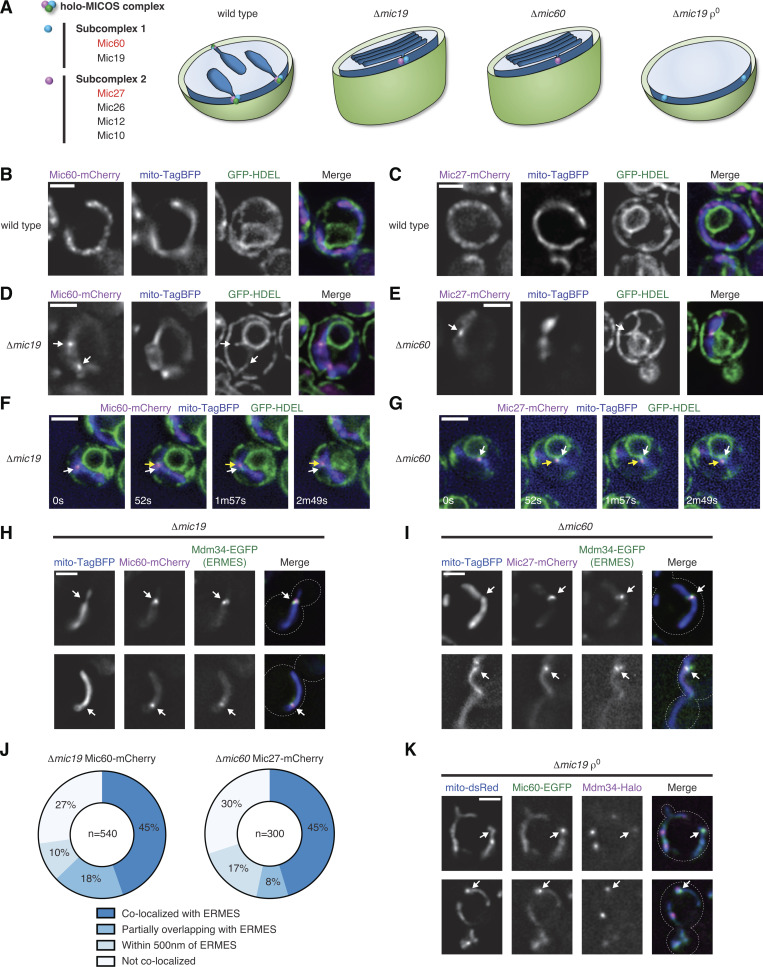
MICOS subcomplexes independently localize in proximity to ERMES-marked ER-mitochondria MCSs. (A) MICOS is organized into two subcomplexes that independently assemble when the holo-MICOS complex is disrupted. (B and C) Images of wild-type cells coexpressing Mic60-mCherry (B; magenta) or Mic27-mCherry (C; magenta), mito-TagBFP (blue), and GFP-HDEL (ER; green). (D and E) As in B and C for Δmic19 cells expressing Mic60-mCherry or Δmic60 cells expressing Mic27-mCherry, respectively. Arrows mark assemblies that localize in proximity to the ER. (F) Time-lapse images of a cell as in D highlighting a subcomplex that remains in proximity to the ER. White arrows indicate the original position and yellow arrows track its movement. See Video 1 and Video 2. (G) As in F for Δmic60 cells expressing Mic27-mCherry. See Video 3 and Video 4. (H) Images of Δmic19 cells expressing Mic60-mCherry (magenta), Mdm34-EGFP (green), and mito-TagBFP (blue). Arrows mark subcomplexes that colocalize with Mdm34. (I) As in H for Δmic60 cells expressing Mic27-mCherry. (J) Graph of colocalization between Mic60 and Mic27 assemblies and ERMES complexes from cells as in H and I. Data are the summation of the indicated number of foci from at least three independent experiments. See Fig. S1, A and B. (K) Images of Δmic19 ρ0 cells expressing Mic60-EGFP (green), Mdm34-HaloTag (magenta), and mito-dsRed (blue). Arrows mark Mic60 assemblies that localize in proximity to Mdm34. Cells are outlined with dashed lines. Scale bars = 2 µm.
MICOS subunits are organized into two subcomplexes, and deletion of the entire MICOS complex in yeast cells leads to more severe mitochondrial morphology and respiratory defects than loss of individual subunits (Anand et al., 2016; Bohnert et al., 2015; Friedman et al., 2015; Guarani et al., 2015; Zerbes et al., 2016). In yeast, the two subcomplexes, composed of Mic60 and its direct interacting partner Mic19, or the multisubunit subcomplex of Mic10/Mic12/Mic26/Mic27 (hereafter “Mic27 subcomplex”), are able to assemble independently when the holo-complex is disrupted (Fig. 1 A). Focal assemblies of the Mic27 subcomplex, which can form in the absence of Mic60 or Mic19, are dependent on the phospholipid cardiolipin and the maintenance of mitochondrial DNA (mtDNA; Friedman et al., 2015). In contrast, Mic60 can self-interact and assemble in the absence of all other MICOS components, including Mic19 (Friedman et al., 2015; Hessenberger et al., 2017; Rabl et al., 2009). However, upstream determinants of Mic60 assembly have yet to be identified. Mic60 assemblies uniquely persist in cristae-less ρ0 cells depleted of mtDNA, suggesting that their position could direct sites of cristae biogenesis (Friedman et al., 2015).
The spatial positioning of MICOS subcomplexes is nonrandom, as each assembly independently localizes adjacent to respiratory complexes found in individual MICOS deletion cells, likely at the remaining CJs (Friedman et al., 2015). To gain insight into MICOS assembly, we examined the positioning of MICOS subcomplexes relative to a spatial landmark: interorganelle membrane contact sites (MCSs) between the OMM and the ER. We find that each MICOS subcomplex on the IMM is independently juxtaposed to ER MCSs. However, each subcomplex differentially responds to either loss of the ERMES (ER–mitochondria encounter structure) complex or enhancement of vacuole–mitochondria MCSs. Our findings provide evidence that external spatial cues direct assembly of the MICOS complex and suggest that nonoverlapping functions of MCSs may contribute to cristae organization.
Results and discussion
MICOS subcomplexes independently localize in proximity to ER–mitochondria MCSs
To determine the spatial organization of MICOS subcomplexes relative to the ER, we coexpressed an ER lumen marker (GFP-HDEL) and a mitochondrial matrix marker (mito-TagBFP) in yeast cells where Mic60 and Mic27 were chromosomally tagged with mCherry. In wild-type cells, Mic60 and Mic27 were localized in a semifocal pattern that was frequently impossible to resolve and were widely distributed along mitochondria relative to apparent ER–mitochondria MCSs (Fig. 1, B and C). However, when the holo-MICOS complex is disrupted, Mic60 and Mic27 can each be visualized as a few discrete foci per cell (Friedman et al., 2015). In Δmic19 and Δmic60 cells, respectively, Mic60 and Mic27 subcomplexes could frequently be observed in proximity to sites where well-resolved ER tubules crossed mitochondria (Fig. 1, D and E).
We sought to determine if localization of MICOS assemblies near ER tubules was random by performing time-lapse fluorescence microscopy. We reasoned that if MICOS subcomplexes localized near ER tubules by chance, as the mitochondria and ER membranes moved within the cell over time, they would not remain in proximity. However, we found that Mic60 or Mic27 assemblies frequently remained in proximity to the ER for several minutes despite the dynamic movements of each (Fig. 1, F and G; Video 1; Video 2; Video 3; and Video 4).
Mic60 assemblies persistently localize in proximity to the ER membrane over time. Montage of deconvolved epifluorescence microscopy time-lapse images from a Δmic19 cell coexpressing Mic60-mCherry, mito-TagBFP, and GFP-HDEL (ER). Left: Overlay of mitochondria (blue) and Mic60 (magenta). Right: Overlay of Mic60 (magenta) and the ER (green). Time is indicated in min::s. Scale bar = 2 µm. Still images are shown in Fig. 1 F.
Mic60 assemblies persistently localize in proximity to the ER membrane over time. Montage of deconvolved epifluorescence microscopy time-lapse images from a Δmic19 cell coexpressing Mic60-mCherry, mito-TagBFP, and GFP-HDEL (ER). Left: Overlay of mitochondria (blue) and Mic60 (magenta). Right: Overlay of Mic60 (magenta) and the ER (green). Time is indicated in min::s. Scale bar = 2 µm. See also Video 1 and Fig. 1 F.
Mic27 assemblies persistently localize in proximity to the ER membrane over time. Montage of deconvolved epifluorescence microscopy time-lapse images from a Δmic60 cell coexpressing Mic27-mCherry, mito-TagBFP, and GFP-HDEL (ER). Left: Overlay of mitochondria (blue) and Mic27 (magenta). Right: Overlay of Mic27 (magenta) and ER (green). Time is indicated in min::s. Scale bar = 2 µm. Still images are shown in Fig. 1 G.
Mic27 assemblies persistently localize in proximity to the ER membrane over time. Montage of deconvolved epifluorescence microscopy time-lapse images from a Δmic60 cell coexpressing Mic27-mCherry, mito-TagBFP, and GFP-HDEL (ER). Left: Overlay of mitochondria (blue) and Mic27 (magenta). Right: Overlay of Mic27 (magenta) and ER (green). Time is indicated in min::s. Scale bar = 2 µm. See also Video 3 and Fig. 1 G.
In yeast, ER–mitochondria MCSs are predominantly mediated by the ERMES complex, an OMM-ER–spanning complex with four core components that, when tagged with fluorescent proteins, can be visualized as a few foci per cell (Kornmann et al., 2009). To determine the spatial positioning of Mic60 assemblies relative to ERMES, we tagged the ERMES subunit Mdm34 with EGFP in Δmic19 cells coexpressing Mic60-mCherry and mito-TagBFP. We detected a total of 540 Mic60 foci and observed that 44.6% colocalized with the ERMES marker (Fig. 1, H and J; and Fig. S1 A). Additionally, 18.1% of Mic60 foci exhibited partial colocalization with the ERMES marker, and 10% localized within close proximity (<500 nm apart).
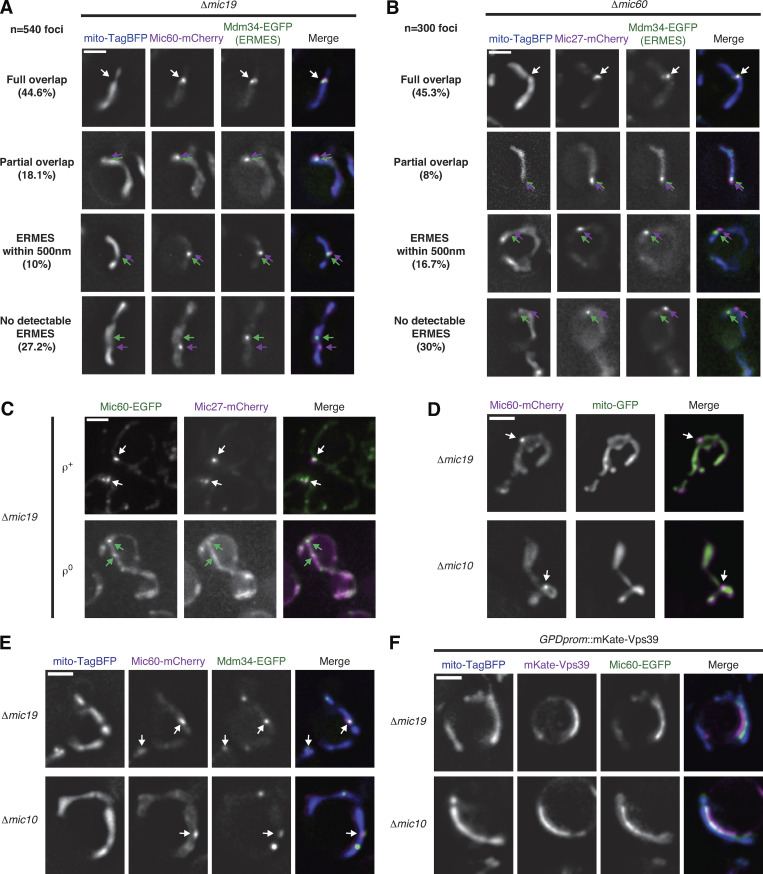
MICOS subcomplexes independently assemble and localize in proximity to ERMES foci. (A) Representative deconvolved fluorescence microscopy images of Δmic19 cells expressing Mic60-mCherry (magenta), Mdm34-EGFP (ERMES; green), and mito-TagBFP (blue). Examples are shown of each category of spatial relationships between Mic60 assemblies and ERMES complexes and their indicated frequency as in Fig. 1 J. Arrows depict either complete overlap (white) or the relative positioning of MICOS assembly (magenta) compared with ERMES (green). The full overlap example is redisplayed from Fig. 1 H. (B) As in A for Δmic60 cells expressing Mic27-mCherry (magenta). The full overlap example is redisplayed from Fig. 1 I. (C) Maximum-intensity projections of deconvolved fluorescence microscopy images are shown of Δmic19 cells expressing Mic60-EGFP (green) and Mic27-mCherry (magenta) in the presence (ρ+) and upon depletion (ρ0) of mtDNA. White arrows indicate colocalization of Mic60 and Mic27 assemblies and green arrows indicate Mic60 assemblies with no detectable Mic27 assembly colocalization. (D) Images are shown of Δmic19 (top) and Δmic10 (bottom) cells expressing Mic60-mCherry (magenta) and mito-EGFP (green). Arrows indicate Mic60 assemblies. (E) Images are shown as in D for cells coexpressing mito-TagBFP (blue) and Mdm34-EGFP (green). Arrows mark Mic60 assemblies that localize in proximity to ERMES. (F) Images are shown as in D for cells expressing mito-TagBFP (blue) and Mic60-EGFP (green) and constitutively overexpressing mKate-Vps39 (magenta). Scale bars = 2 µm.
We next asked if the Mic27 subcomplex assemblies localized in proximity to ERMES independently of the Mic60 subcomplex by examining its localization in Δmic60 cells where both Mic60 and Mic19 are destabilized (Harner et al., 2011; Hoppins et al., 2011; von der Malsburg et al., 2011). We determined the position of 300 Mic27 foci relative to Mdm34 in Δmic60 cells and found that 45.3% colocalized, similar to Mic60 assemblies (Fig. 1, I and J; and Fig. S1 B). An additional ∼25% of Mic27 assemblies partially overlapped or localized within 500 nm of ERMES complexes. ERMES foci frequently were difficult to detect, and we speculate these numbers underreport their association, although a subset of MICOS subcomplexes may not be localized near the ER.
To determine whether Mic60 assemblies rely on the Mic27 subcomplex for their localization in proximity to ER MCSs, we examined Mic60 localization in ρ0 cells, a condition in which the Mic27 subcomplex is unable to form (Fig. 1 A and Fig. S1 C; Friedman et al., 2015). We coexpressed Mic60-EGFP and Mdm34-HaloTag in Δmic19 ρ0 cells and labeled cells with Janelia Fluor 646 (JF646). In these cells, we frequently observed Mic60 assemblies that localized in proximity to Mdm34, indicating that the Mic60 subcomplex localizes in proximity to ERMES independently of the Mic27 subcomplex (Fig. 1 K).
Within the MICOS complex, Mic60 directly interacts with the Mic19 subunit, and purified Mic60 is able to deform liposomes in vitro in a manner modulated by Mic19 (Hessenberger et al., 2017; Tarasenko et al., 2017). We thus examined Mic60-mCherry localization in Δmic10 cells, where Mic27 is destabilized but Mic19 remains stably expressed (Harner et al., 2011; Hoppins et al., 2011; von der Malsburg et al., 2011). Discrete Mic60 focal assemblies persisted in Δmic10 cells and were observed in close proximity to ERMES sites labeled by Mdm34, indicating that expression of Mic19 does not prevent Mic60 focal assembly or its localization near ER MCSs (Fig. S1, D and E). Altogether, these data suggest that the majority of both the Mic60 and Mic27 subcomplex assemblies form and independently localize in proximity to ER–mitochondria MCSs.
ERMES function is differentially required for the formation of MICOS subcomplexes
We wanted to determine whether ERMES was required for the assembly of the MICOS subcomplexes. Deletion of any individual ERMES core subunit disrupts the complex and leads to cellular growth and mitochondrial morphology defects (Kornmann et al., 2009). Mitochondria frequently adopt a spherical appearance, with markers of cristae localized to the interior of the sphere and markers of the boundary region at the exterior (Wurm and Jakobs, 2006). To first determine the consequence of ERMES deletion on MICOS localization in otherwise wild-type cells, we visualized Mic60-EGFP or Mic27-EGFP and the cristae-localized ATP synthase subunit Atp2-mCherry in Δmmm1 cells. Consistent with the concentration of the holo-MICOS complex at CJs, Mic60 and Mic27 both localized to the rim of swollen mitochondria relative to Atp2 (Fig. S2 A). We then asked how loss of ERMES affected MICOS subcomplexes in Δmic19 Δmmm1 cells. While Mic60-EGFP assemblies were not dissipated in Δmmm1 Δmic19 cells, Mic27-EGFP became uniformly distributed along the boundary membrane (Fig. 2, A and B). Thus, while each subcomplex localizes in proximity to ERMES, loss of ERMES specifically affects focal assembly of Mic27.
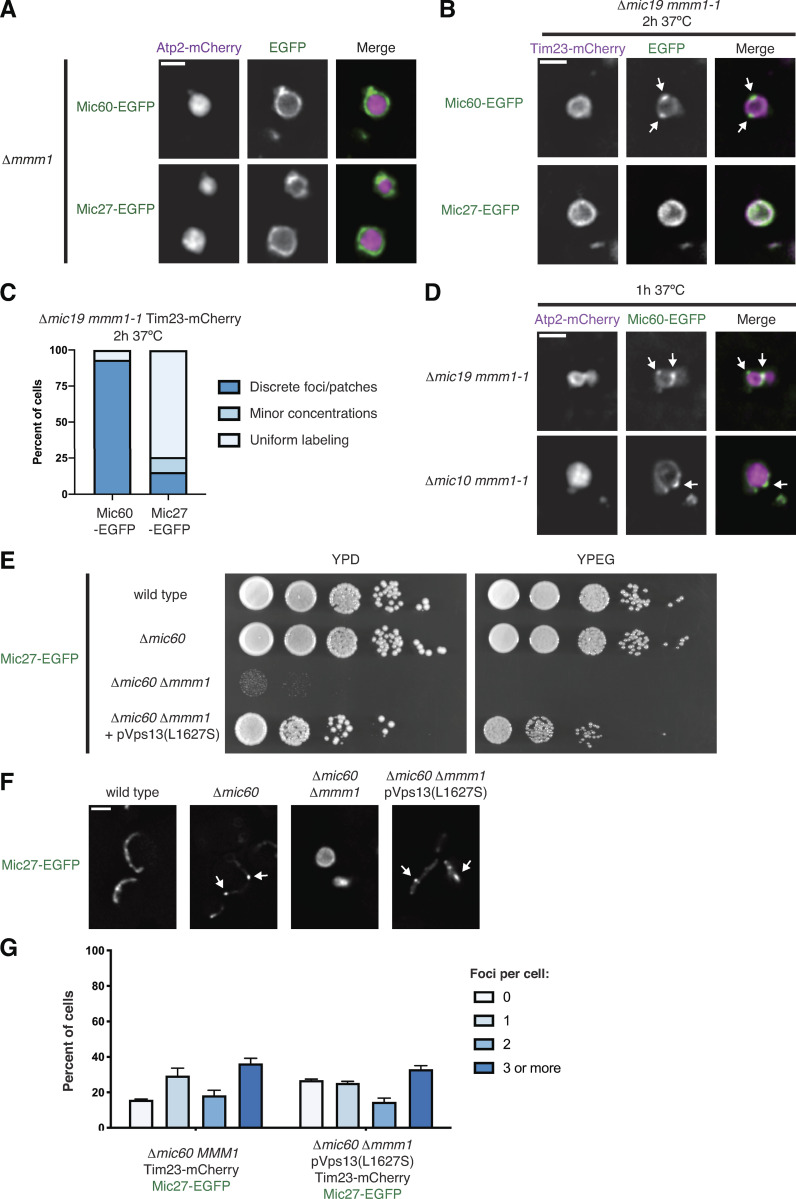
The Mic27 subcomplex is specifically dependent on ERMES for assembly but can be restored by ERMES bypass. (A) Representative single planes of deconvolved fluorescence microscopy images of Δmmm1 cells expressing either Mic60-EGFP or Mic27-EGFP (green) and Atp2-mCherry (magenta). (B) Images of Δmic19 mmm1-1 cells coexpressing Mic60-EGFP or Mic27-EGFP (green) and Tim23-mCherry (magenta) and grown at the nonpermissive temperature for the indicated time. (C) Graph depicting the percentage of cells from B with Mic60-EGFP (left) or Mic27-EGFP (right) observed in the indicated appearance relative to Tim23. Data displayed are the summation of three independent experiments with ≥50 cells counted per strain per experiment. (D) Images are shown of Δmic19 mmm1-1 cells (top) or Δmic10 mmm1-1 cells (bottom) coexpressing Atp2-mCherry (magenta) and Mic60-EGFP (green) and grown at the nonpermissive temperature for the indicated time. Arrows mark sites of Mic60 assembly. (E) Serial dilutions of the indicated yeast cells plated on medium containing dextrose (YPD, left) or the nonfermentable carbon source ethanol/glycerol (YPEG, right). (F) Representative images of the indicated strains expressing Mic27-EGFP from E. Arrows mark sites of Mic27 assembly. (G) Graph depicting the percentage of the indicated cells, as shown in Fig. 2 F, with the indicated number of Mic27-EGFP foci per cell. Data represent the average of three independent experiments, and ≥57 cells were counted per strain per experiment. Error bars indicate SEM. Scale bars = 2 µm.
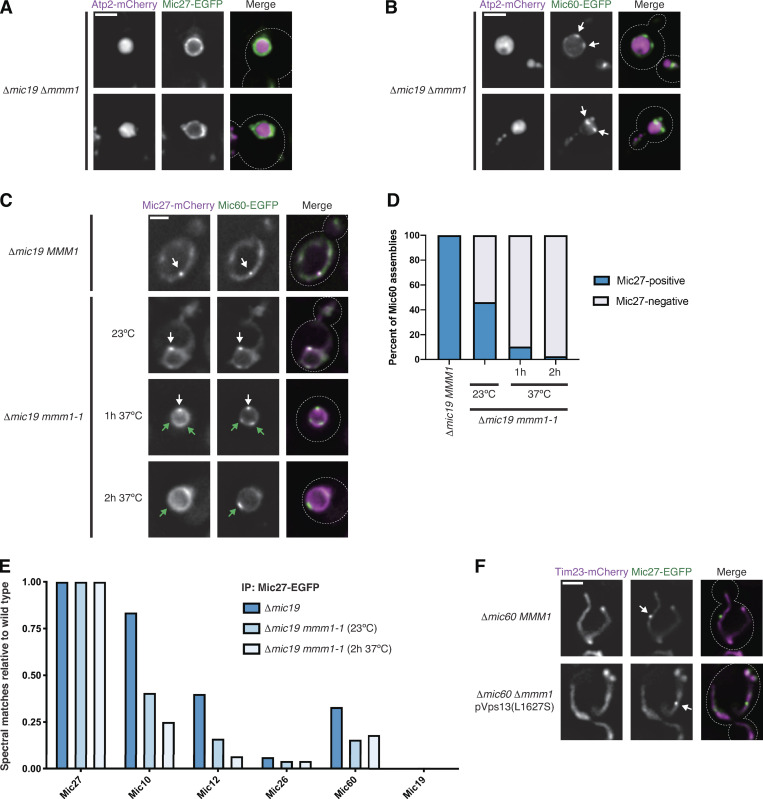
ERMES function is differentially required for formation of MICOS subcomplexes. (A) Images of Δmic19 Δmmm1 cells expressing Atp2-mCherry (magenta) and Mic27-EGFP (green). (B) As in A for cells expressing Mic60-EGFP (green). White arrows mark Mic60 assemblies. (C) Images of Δmic19 cells expressing Mic27-mCherry (magenta) and Mic60-EGFP (green) with wild-type MMM1 or the temperature-sensitive allele mmm1-1 and and grown at the indicated temperatures and times. White arrows mark colocalized Mic60 and Mic27 assemblies, and green arrows indicate Mic60 assemblies with no detectable Mic27 assembly colocalized. (D) Graph of the percentage of Mic60 assemblies that colocalize with Mic27 from cells grown as in C. Data are the summation of three independent experiments with >130 Mic60 assemblies per condition. (E) Graph of the total spectral matches identified by immunopurification (IP) of Mic27-EGFP and MS analysis for each MICOS subunit in the indicated strain backgrounds relative to wild-type cells. Spectral matches of Mic27 were used to normalize each strain background to wild type and data represent the average of two experimental replicates. See Table S1. (F) Images are shown of Δmic60 MMM1 cells (top) or Δmic60 Δmmm1 cells expressing pVps13(L1627S) (bottom) and coexpressing Tim23-mCherry (magenta) and Mic27-EGFP (green). See Fig. S3 G for quantification. Cells are outlined with dashed lines. Scale bars = 2 µm.
To avoid the pleiotropic effects of ERMES deletion and ascertain the effect of acute ERMES inactivation on MICOS subcomplex assembly, we used the temperature-sensitive variant mmm1-1 (Burgess et al., 1994). We coexpressed Mic60-EGFP or Mic27-EGFP as well as the boundary marker Tim23-mCherry (Wurm and Jakobs, 2006) in Δmic19 mmm1-1 cells. After growth at a nonpermissive temperature (37°C) for 2 h, we found that Mic60 assemblies localized to discrete assemblies, while Mic27 was uniformly distributed relative to Tim23 in most cells (Fig. S2, B and C). Mic60 was not obviously impacted by expression of Mic19, as it also localized to discrete assemblies in Δmic10 mmm1-1 cells (Fig. S2 D). To directly compare their assembly, we coexpressed Mic60-EGFP and Mic27-mCherry in Δmic19 cells with either wild-type or mutant ERMES (MMM1 or mmm1-1). In Δmic19 MMM1 cells, every Mic60 assembly we detected colocalized with a Mic27 assembly (Fig. 2, C and D). In contrast, even after growth at a permissive temperature (23°C), Mic27 was frequently not focal in Δmic19 mmm-1 cells, and at 37°C, Mic27 was dispersed relative to nearly all Mic60 foci.
To determine whether loss of Mic27 focal assembly upon ERMES inactivation corresponded to dissociation of the Mic27 subcomplex, we immunopurified Mic27-EGFP from cross-linked cell extracts from wild type, Δmic19, and Δmic19 mmm1-1 cells with α-GFP antibody and performed mass spectrometry (MS) analysis. Mic27-EGFP expressed in wild-type cells readily identified every subunit of the MICOS complex (Table S1). When the holo-MICOS complex was disrupted, Mic27-EGFP from Δmic19 cells robustly identified Mic10 and, to a lesser extent, Mic12 and Mic60, compared with the wild-type cells (Fig. 2 E). However, in Δmic19 mmm1-1 cells grown at 23°C, Mic27-EGFP identified fewer peptides of Mic10 and Mic12, and we observed a further reduction when cells were grown at 37°C for 2 h. These data indicate that disruption of ERMES leads to disassembly of the Mic27 subcomplex.
Cells are able to bypass the loss of ERMES by expression of a dominant allele of the MCS and lipid transport protein Vps13 (Lang et al., 2015; Li et al., 2020). To determine whether Vps13-mediated bypass of ERMES-defective cells restored focal assembly of the Mic27 subcomplex, we expressed Mic27-EGFP in Δmmm1 Δmic60 cells in the presence or absence of a dominant Vps13 allele (L1627S; Lang et al., 2015). While Mic27 uniformly localized to the boundary region of Δmmm1 Δmic60 cells, Vps13-mediated bypass of ERMES loss promoted the restoration of Mic27 to focal assemblies (Fig. 2 F and Fig. S2, E–G). Together, these data indicate that the Mic27 subcomplex specifically disassembles owing to consequences of loss of ERMES function rather than dissociation of ERMES itself.
Mic60 assemblies localize in proximity to the ER independently of known ER–mitochondria tethers
Despite the severe defects of ERMES deletions, ER–mitochondria MCSs can persist in these cells (Kakimoto et al., 2018). We therefore determined whether ERMES-independent Mic60 assemblies remained localized in proximity to the ER in Δmmm1 Δmic19 cells and frequently observed that patches of Mic60 on the IMM aligned with apparent ER–mitochondria contacts (Fig. S3 A). These data suggest that Mic60 assemblies remain in proximity to the ER by an ERMES-independent mechanism.
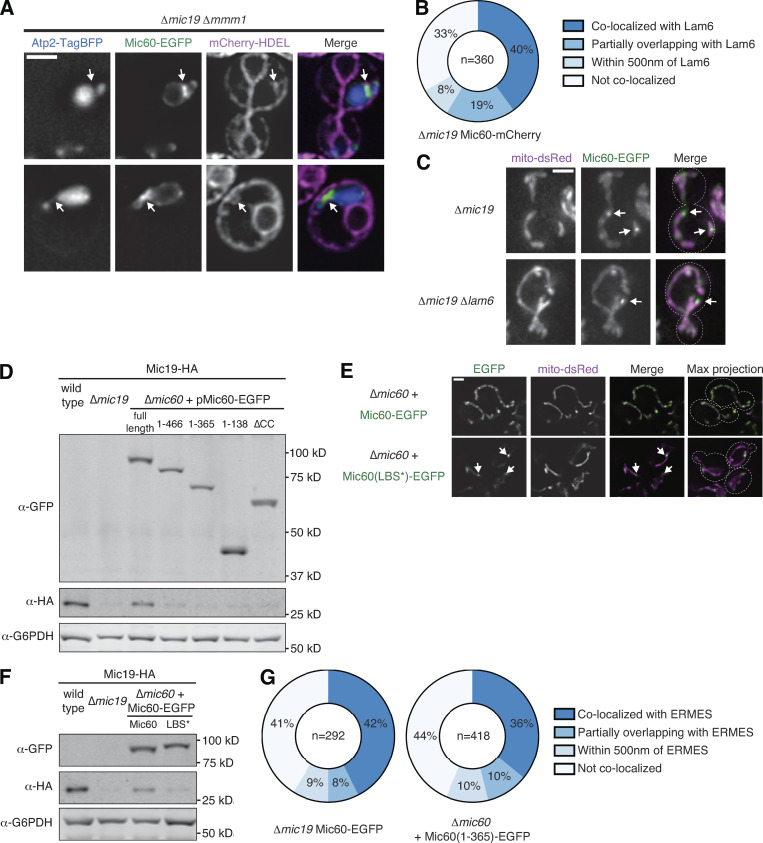
Mic60 assembles in proximity to the ER independently of known ER–mitochondria tethers and targets via an N-terminal region. (A) Deconvolved fluorescence microscopy images are shown of Δmic19 Δmmm1 yeast cells expressing Atp2-TagBFP (blue), Mic60-EGFP (green), and mCherry-HDEL (magenta). Arrows indicate regions of Mic60 assembly in proximity to the ER. (B) Graphical depiction of the extent of colocalization between assemblies of Mic60 and Lam6 from cells as in Fig. 3 A. Data displayed are the summation of the indicated number of foci from at least three independent experiments. (C) Maximum-intensity projections of images from the indicated strains expressing mito-dsRed (magenta) and Mic60-EGFP (green). Arrows mark examples of Mic60 assemblies. (D) Western blot analysis of whole-cell lysates prepared from the indicated strains coexpressing Mic19-HA tagged at its endogenous locus and probed with the indicated antibodies. (E) Images of Δmic60 cells expressing chromosomally integrated Mic60-EGFP (top) or Mic60(LBS*)-EGFP (bottom) and coexpressing mito-dsRed (magenta). Arrows mark focal Mic60(LBS*)-EGFP. (F) As in D for Δmic60 cells expressing chromosomally integrated wild-type or LBS* Mic60-EGFP. (G) Graphical depiction of the extent of colocalization between assemblies of Mic60 and Mdm34 from cells as in Fig. 3 G. Data displayed are the summation of the categorization of the indicated number of foci from at least three independent experiments. Cell boundaries are indicated with dotted lines. Scale bars = 2 µm.
The ER sterol transporter and StART family member Lam6/Ltc1 localizes to both ER–mitochondria and ER–vacuole MCSs and is thought to mediate lipid transfer between the organelles (Elbaz-Alon et al., 2015; Gatta et al., 2015; Murley et al., 2015). While ERMES colocalizes with a subset of Lam6 foci, mitochondria-localized Lam6 foci outnumber ERMES, suggesting that Lam6 may mark sites of ERMES-independent ER-mitochondria tethering (Murley et al., 2015). To test whether Mic60 assemblies localized in proximity to Lam6-marked ER–mitochondria MCSs more frequently than to ERMES sites, we imaged Δmic19 cells expressing Mic60-mCherry and Lam6-EGFP. We identified 360 Mic60 foci along the IMM and determined that 67% colocalized or localized in close proximity to Lam6, similar to Mic60 colocalization with ERMES (Fig. 3 A and Fig. S3 B). However, to explicitly test whether Lam6 is required for the formation of Mic60 assemblies, we examined Mic60-EGFP localization in Δmic19 Δlam6 cells and observed no deficiency in Mic60 focal assembly (Fig. S3 C).
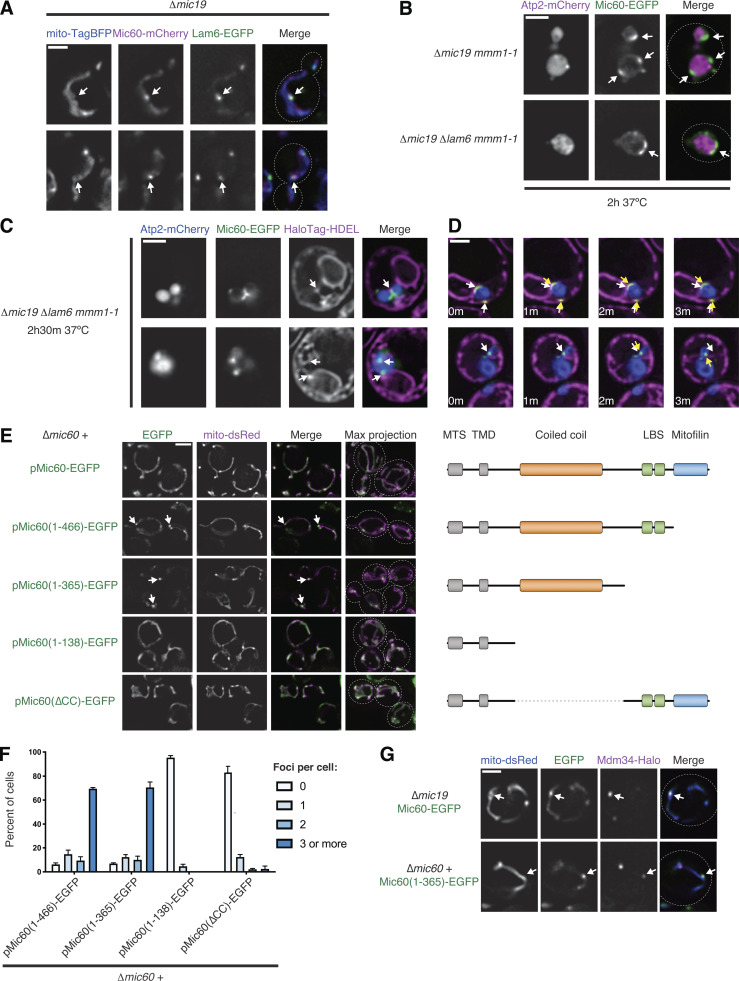
Mic60 assembles in proximity to the ER independently of known ER–mitochondria tethers and targets via an N-terminal region. (A) Images of Δmic19 cells expressing mito-TagBFP (blue), Mic60-mCherry (magenta), and Lam6-EGFP (green). Arrows mark examples of colocalization between Mic60 assemblies and Lam6. See Fig. S3 B for quantification. (B) Images of the indicated mmm1-1 strains expressing Atp2-mCherry (magenta) and Mic60-EGFP (green) after growth for 2 h at 37°C. Arrows mark examples of Mic60 assemblies. (C) Images of Δmic19 Δlam6 mmm1-1 cells expressing Atp2-mCherry (blue), Mic60-EGFP (green), and HaloTag-HDEL (magenta) after growth at 37°C for 2 h and 30 min. Arrows mark examples of Mic60 assemblies that appear in proximity to the ER. (D) Time-lapse images of cells as in C. White arrows indicate the original Mic60 assembly position, and yellow arrows track its movement. See also Video 5 and Video 6. (E) Single-plane and maximum-intensity projection images of Δmic60 cells expressing the indicated Mic60-EGFP variants (green) and mito-DsRed (magenta). Arrows indicate sites of EGFP assemblies. The schematic depicts the domain organization of Mic60 and each variant. (F) Graph of the frequency of cells as in E with the indicated number of foci per cell. Data are the average of three independent experiments with >45 cells per strain per experiment. Error bars indicate SEM. (G) Images of Δmic19 cells expressing Mic60-EGFP tagged at its endogenous locus or of Δmic60 cells expressing chromosomally integrated Mic60(1–365)-EGFP and coexpressing mito-dsRed (blue) and Mdm34-HaloTag (magenta). Arrows indicate sites of EGFP assembly colocalized with Mdm34. See Fig. S3 G for quantification. Cells are outlined with dashed lines. Scale bars = 2 µm.
We next considered that Lam6 and ERMES may act redundantly and tested whether their combined loss affected Mic60 assembly. To avoid the synthetic lethality of Lam6 and ERMES deletions (Murley et al., 2015), we generated a Δmic19 Δlam6 mmm1-1 strain that coexpressed Mic60-EGFP and Atp2-mCherry. After growth of cells at 37°C for 2 h, we saw no discernable difference in Mic60 assembly formation compared with cells expressing wild-type Lam6 (Fig. 3 B). We next tested whether ERMES- and Lam6-independent Mic60 assemblies were spatially linked to HaloTag-HDEL and, surprisingly, found they maintained close proximity to the ER over time (Fig. 3, C and D; Video 5; and Video 6). These data suggest that an additional ER–mitochondria tethering mechanism may exist and be sufficient to promote Mic60 localization adjacent to ER MCSs.
Mic60 assemblies persistently localize in proximity to the ER membrane over time in cells depleted of ERMES and Lam6. Deconvolved epifluorescence microscopy time-lapse images are shown from a Δmic19 Δlam6 mmm1-1 cell coexpressing Mic60-EGFP (green), Atp2-mCherry (blue), and HaloTag-HDEL labeled with JF646 (magenta) and grown at the nonpermissive temperature for 2 h and 30 min before imaging. Time is indicated in min::s. Still images are shown in Fig. 3 D.
Mic60 assemblies persistently localize in proximity to the ER membrane over time in cells depleted of ERMES and Lam6. Deconvolved epifluorescence microscopy time-lapse images are shown from a Δmic19 Δlam6 mmm1-1 cell coexpressing Mic60-EGFP (green), Atp2-mCherry (blue), and HaloTag-HDEL labeled with JF646 (magenta) and grown at the nonpermissive temperature for 2 h and 30 min before imaging. Time is indicated in min::s. Still images are shown in Fig. 3 D.
An N-terminal region of Mic60 promotes its focal assembly in proximity to the ER
Because Mic60 targets in proximity to ER–mitochondria MCSs and persists independently of ERMES and Lam6, we sought to mechanistically dissect how Mic60 targeted to foci. Mic60 localizes to the IMM via a mitochondrial targeting sequence and transmembrane domain, while the bulk of Mic60 faces the intermembrane space and consists of coiled-coil, lipid binding sequence (LBS), and sequence-conserved mitofilin domains (Colina-Tenorio et al., 2020). To attempt to identify a Mic60 targeting mechanism, we introduced plasmid-borne Mic60-EGFP truncations of each domain into Δmic60 cells.
Introduction of wild-type pMic60-EGFP rescued the mitochondrial morphology defect of Δmic60 cells and stabilized the Mic60 interacting partner Mic19 in cells coexpressing Mic19-HA (Fig. 3 E and Fig. S3 D). Each truncation we assayed, while stably expressed and targeted to mitochondria, failed to rescue Mic60 function or Mic19 stability, consistent with previous observations (Körner et al., 2012; Zerbes et al., 2012). However, the submitochondrial localization of each Mic60 truncation varied, and truncation of the mitofilin domain alone (pMic60[1–466]-EGFP) caused Mic60 to concentrate into focal structures in most cells (Fig. 3, E and F). Additional truncation of the LBS domain (pMic60[1–365]-EGFP), or introduction of a Mic60 allele with an LBS-specific mutation (RW432-433DD; pMic60[LBS*]-EGFP; Hessenberger et al., 2017), also caused Mic60 to concentrate into focal assemblies (Fig. 3, E and F; and Fig. S3, E and F).
While truncation of the C-terminal LBS and mitofilin domains caused localization of Mic60 to discrete assemblies, additional truncation of the coiled-coil domain of Mic60 (pMic60[1–138]-EGFP) led to a more uniform distribution and was rarely observed in focal structures (Fig. 3, E and F). To test if the coiled coil domain of Mic60 was specifically required for Mic60 assembly into foci, we generated an in-frame deletion of amino acids 139–365 (pMic60[ΔCC]-EGFP). This allele of Mic60, which still contains both the LBS and mitofilin domains, also failed to rescue Δmic60 function but was dispersed throughout mitochondria in the majority of cells and only occasionally localized to foci (Fig. 3, E and F).
We next asked if focal assemblies formed by the Mic60 N-terminus were targeted in proximity to the ER. We expressed a genome-integrated Mic60(1–365)-EGFP truncation in Δmic60 cells and compared its localization to the ERMES marker Mdm34-HaloTag. Mic60(1–365)-EGFP localized in proximity to Mdm34 to a similar extent (56% of foci colocalized or were in proximity) as Mic60-EGFP in Δmic19 cells (59% of foci; Fig. 3 G and Fig. S3 G). Together, these data suggest that the Mic60 coiled-coil domain is necessary to promote Mic60 focal assembly and that an N-terminal region of Mic60 (including the mitochondrial targeting sequence, transmembrane domain, and coiled coil) is sufficient to promote its targeting in proximity to the ER.
A subset of MICOS assemblies in wild-type cells are spatially linked to ER–mitochondria MCSs
While MICOS subcomplexes appear associated with the ER, the distribution of MICOS subunits does not appear specific to ER–mitochondria MCSs in wild-type cells (Fig. 1, B and C). Despite this, in wild-type cells a subset of MICOS assemblies are focal or clustered, particularly when visualized by superresolution microscopy (Friedman et al., 2015; Hoppins et al., 2011; Stoldt et al., 2019). We therefore considered the possibility that a subset of MICOS assemblies are stably linked to the ER in the context of the holo-MICOS complex. To interrogate this, we performed live-cell Airyscan microscopy of Mic60 or Mic27 tagged with 3xEGFP in wild-type cells coexpressing mito-DsRed and HaloTag-HDEL. Airyscan microscopy offered enhanced spatial resolution and also enabled us to nearly simultaneously image all fluorescent markers, affording us the opportunity to capture Mic60 and Mic27 dynamics relative to the ER. Using this approach, we were able to identify several examples of discrete Mic60 and Mic27 foci that appeared to stably associate with the ER (Fig. 4, A and B; Video 7; and Video 8). We also examined Mic60-3xEGFP localization relative to ERMES and observed several instances of focal Mic60 assemblies that maintained stable spatial association in proximity to Mdm34 foci (Fig. 4 C, Video 9, and Video 10). We therefore conclude that a small subset of MICOS assemblies formed in wild-type cells in the presence of intact MICOS complexes are stable and localize in proximity to the ER.
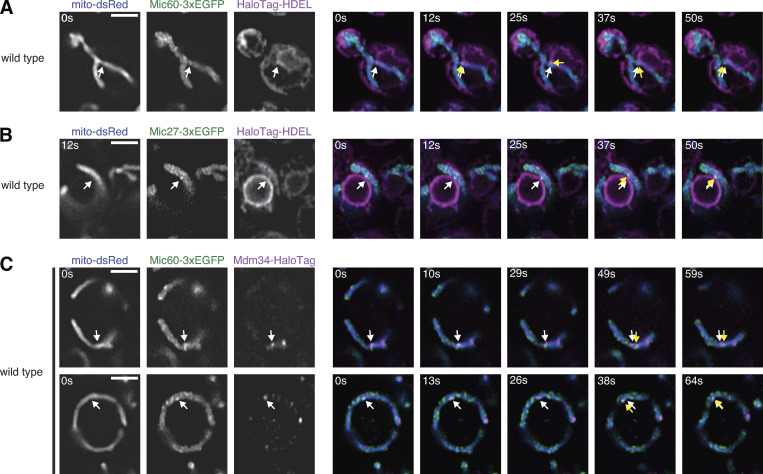
A subset of MICOS assemblies in wild-type cells are spatially linked to ER–mitochondria MCSs. (A) Left: Airyscan microscopy images of wild-type cells expressing Mic60-3xEGFP (green), mito-dsRed (blue), and HaloTag-HDEL (magenta). Right: Merged time-lapse images of the cell on the left. Arrows indicate a Mic60 assembly that remains in proximity to the ER membrane at the indicated times. White arrows indicate the original Mic60 assembly position and yellow arrows track its movement. See Video 7. (B) As in A for wild-type cells expressing Mic27-3xEGFP (green). See Video 8. (C) As in A for wild-type cells expressing Mic60-3xEGFP (green), mito-DsRed (blue), and Mdm34-HaloTag (magenta). See Video 9 and Video 10. Scale bars = 2 µm.
A subset of Mic60 assemblies in wild-type cells localize in proximity to the ER membrane over time. Montage of deconvolved Airyscan microscopy time-lapse images from a wild-type cell coexpressing mito-dsRed (top left; blue), Mic60-3xEGFP (top-middle; green), and HaloTag-HDEL labeled with JF646 (top-right; magenta). Overlays on bottom are merged images of the indicated channels. Time is indicated in min::s. Still images are shown in Fig. 4 A.
A subset of Mic27 assemblies in wild-type cells localize in proximity to the ER membrane over time. Montage of deconvolved Airyscan microscopy time-lapse images from a wild-type cell coexpressing mito-dsRed (top left; blue), Mic27-3xEGFP (top-middle; green), and HaloTag-HDEL labeled with JF646 (top-right; magenta). Overlays on bottom are merged images of the indicated channels. Time is indicated in min::s. Still images are shown in Fig. 4 B.
A subset of Mic60 assemblies in wild-type cells localize in proximity to the ERMES complex over time. Montage of deconvolved Airyscan microscopy time-lapse images of a wild-type cell coexpressing Mic60-3xEGFP (green), mito-dsRed (blue), and Mdm34-HaloTag labeled with JF646 (magenta). Overlays are merged images of the indicated channels. Time is indicated in min::s. Still images are shown in Fig. 4 C.
A subset of Mic60 assemblies in wild-type cells localize in proximity to the ERMES complex over time. Montage of deconvolved Airyscan microscopy time-lapse images of a wild-type cell coexpressing Mic60-3xEGFP (green), mito-dsRed (blue), and Mdm34-HaloTag labeled with JF646 (magenta). Overlays are merged images of the indicated channels. Time is indicated in min::s. Still images are shown in Fig. 4 C.
Mic60 assemblies specifically relocalize in proximity to induced mitochondria–vacuole MCSs
Given that Mic60 assemblies persist at ER MCSs independently of ERMES and Lam6, we hypothesized that a more general feature of MCSs may be sufficient to promote Mic60 targeting. We thus sought to enhance mitochondrial MCSs with a different organelle, the vacuole, and determine whether it affected Mic60 localization. Previously, vacuole–mitochondria contact sites (vCLAMPs) were identified as patches of vacuole–mitochondria MCSs promoted by the membrane trafficking protein Vps39. At endogenous levels of Vps39, mitochondria–vacuole MCSs are infrequently detected (<20% of cells at steady state; Gonzalez Montoro et al., 2018). However, when overexpressed, Vps39 drives the formation of vCLAMPs and concentrates in a patch on the vacuole surface, marking vacuole–mitochondria MCSs that can be visualized by fluorescence and electron microscopy (Elbaz-Alon et al., 2014; Gonzalez Montoro et al., 2018; Hönscher et al., 2014).
To determine the impact of vCLAMP formation on MICOS subcomplexes, we induced vCLAMP formation in Δmic19 or Δmic60 cells by replacing the endogenous VPS39 promoter with the relatively strong GPD1 promoter and tagged Vps39 with an N-terminal mKate fusion (Fig. 5, A and B). Strikingly, in Δmic19 cells coexpressing Mic60-EGFP and mito-TagBFP, the Mic60 assemblies frequently localized to foci or concentrated patches on the IMM that overlapped with the Vps39-labeled vCLAMP patch (78%) or, occasionally, localized immediately adjacent to it (15%; Fig. 5 C). Additionally, redistribution of Mic60 subcomplexes efficiently occurred in Δmic10 cells, indicating that coexpression of Mic19 did not impact Mic60 relocalization (Fig. S1 F). Next, to determine whether the effect was specific to Mic60, we visualized Mic27-EGFP in Δmic60 cells overexpressing mKate-Vps39. However, Mic27 assemblies more rarely associated with vCLAMPs (31% localized at or adjacent; Fig. 5, B and C). Together, these data indicate that modifying vacuole–mitochondria MCSs specifically alters the localization of Mic60 assemblies on the IMM to sites near vCLAMPs.
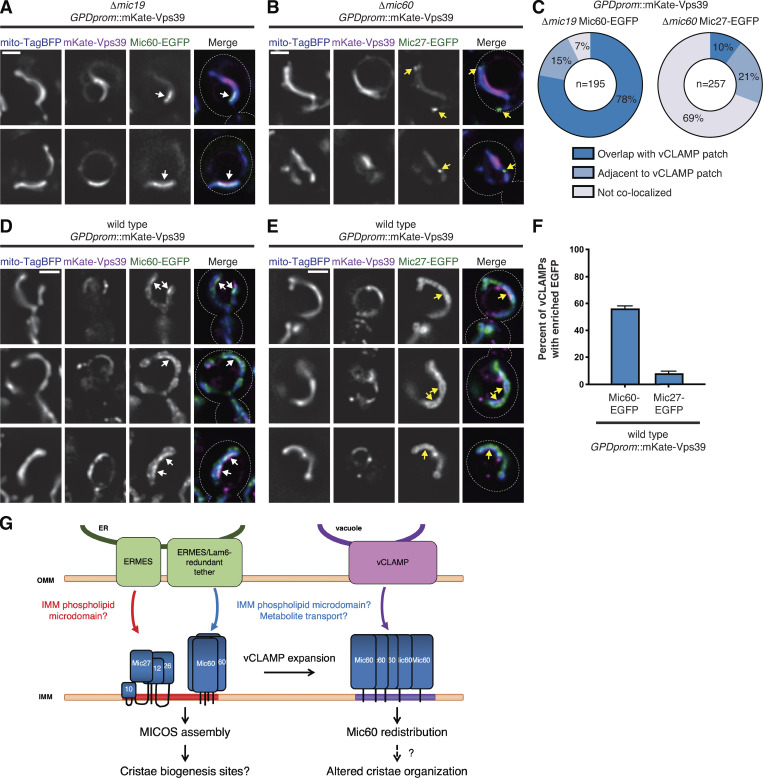
Mic60 assemblies specifically redistribute in proximity to induced vCLAMPs. (A) Images of Δmic19 cells constitutively overexpressing mKate-Vps39 (magenta) and expressing mito-TagBFP (blue) and Mic60-EGFP (green). White arrows mark Mic60-EGFP enrichment in proximity to the vCLAMP. (B) Images as in A for Δmic60 cells expressing Mic27-EGFP (green). Yellow arrows mark Mic27 assemblies not associated with a vCLAMP. (C) Graph of Mic60 and Mic27 assemblies that colocalize or localize adjacent to vCLAMPs from cells as in A and B. Data are the summation of the indicated number of MICOS assemblies from three independent experiments. (D) Images of otherwise wild-type cells constitutively overexpressing mKate-Vps39 (magenta) and expressing mito-TagBFP (blue) and Mic60-EGFP (green). White arrows mark Mic60 enrichment relative to mito-TagBFP in proximity to the vCLAMP. (E) Images as in D for cells expressing Mic27-EGFP (green). Yellow arrows mark vCLAMP sites with no discernable Mic27 enrichment. (F) Graph of vCLAMPs from cells as in D and E where Mic60-EGFP or Mic27-EGFP are discernably enriched compared with mito-TagBFP. Data are the average of three independent experiments, and >35 vCLAMPs were counted per experiment. Error bars indicate SEM. (G) Model for the role of interorganelle MCSs in MICOS subcomplex assembly and positioning. Cells are outlined with dashed lines. Scale bars = 2 µm.
Given that a subset of MICOS assemblies appear to localize in proximity to the ER in wild-type cells (Fig. 4), we next wanted to determine whether the formation of vCLAMPs affected holo-MICOS complex localization. We therefore constitutively overexpressed mKate-Vps39 in otherwise wild-type cells expressing Mic60-EGFP or Mic27-EGFP (Fig. 5, D and E). Mic60 retained its normal semipunctate appearance throughout the mitochondrial network, consistent with MICOS localization; however, we frequently observed Mic60 also enriched at sites that colocalized with Vps39 (56% of vCLAMPs colocalized with enriched Mic60; Fig. 5, D and F). In contrast, Mic27 rarely enriched at vCLAMP sites (8% of vCLAMPs had enriched Mic27) and instead remained in a semipunctate pattern throughout the mitochondria (Fig. 5, E and F). Thus, in cells with intact MICOS complexes, Mic60 is specifically redistributed to enhanced vacuole–mitochondria MCSs.
Conclusions
The MICOS complex is a critical determinant of mitochondrial architecture, but the spatial and mechanistic determinants of assembly of its two subcomplexes at CJs are poorly understood. Using conditions that disrupt the holo-MICOS complex, we have shown that MICOS subcomplexes independently assemble and localize in proximity to ER–mitochondria MCSs. Based on combined genetic and physical interactions between MICOS, ERMES, mtDNA nucleoids, and the OMM import SAM (sorting and assembly machinery) and TOM (translocase of the OMM) complexes, MICOS has previously been proposed to be part of an ER–mitochondria interaction network (ERMIONE; Pfanner et al., 2019; van der Laan et al., 2012). Using Airyscan microscopy, we provide evidence of a spatial link between a subset of MICOS assemblies and the ER. Further, we show that altering organelle contact sites by promoting mitochondria–vacuole interactions specifically causes the redistribution of the principal MICOS component Mic60. Our findings provide new insights into the spatial determinants that regulate assembly of the cristae-organizing MICOS complex and suggest that ER MCSs may directly contribute to mitochondrial ultrastructural organization.
In addition to cardiolipin and mtDNA, we now identify that the ERMES complex is a novel upstream determinant specifically of Mic27 subcomplex assembly. However, Mic27 assemblies can be restored when ERMES is bypassed by dominant Vps13, indicating that ERMES function rather than ERMES assembly per se promotes Mic27 subcomplex assembly. Biochemical and structural data indicate that ERMES subunits may form a channel to mediate lipid transport between the ER and mitochondria, and correspondingly, a phospholipid defect in ERMES-depleted cells has been observed in vivo (AhYoung et al., 2017; Jeong et al., 2017; Kawano et al., 2018; Kornmann et al., 2009). Additionally, Vps13 has a structure consistent with a role in lipid transport (Li et al., 2020). As cardiolipin is synthesized from precursor phospholipids that must be transported from the ER membrane to the IMM (Tatsuta and Langer, 2017), one model is that ER–mitochondria MCSs promote the formation of a cardiolipin-rich microdomain on the IMM that is favorable to promote Mic27 subcomplex assembly, thus leading to its position in proximity to the ER (Fig. 5 G). Recent work has shown that cardiolipin and an opposing relationship between Mic27 and Mic26 contribute to regulate Mic10 oligomerization (Rampelt et al., 2018), which would be consistent with the localization of the subcomplex to a cardiolipin-rich subdomain.
While Mic60 independently localizes to ERMES-positive ER–mitochondria MCSs, it likely does so via a distinct targeting mechanism from Mic27 assemblies, as it persists in proximity to the ER in the absence of ERMES and Lam6. Our analysis indicates that an N-terminal region of Mic60 is sufficient to promote ER targeting and that its coiled-coil domain is required. The coiled coil of Mic60 may promote self-interaction (Hessenberger et al., 2017) or interactions with other proteins that help stabilize Mic60 localization near these MCSs. Mic60 assemblies also specifically redistribute upon expansion of vCLAMP tethers, and while a physiological role for vCLAMPs remains to be determined, it is possible they indirectly promote lipid transfer by providing a platform between the organelles (Elbaz-Alon et al., 2014; Gonzalez Montoro et al., 2018; Hönscher et al., 2014; John Peter et al., 2017). One possibility consistent with our data is that Mic60 may sense a unique lipid microdomain on the IMM promoted by both ER MCSs and vCLAMPs (Fig. 5 G). Since cardiolipin synthesis is dispensable for Mic60 focal assembly (Friedman et al., 2015), Mic60 may sense a distinct phospholipid microdomain from Mic27 or even contain multiple distinct lipid sensing motifs. Alternatively, each MCS may perform additional functions, such as metabolite transport, that Mic60 can sense. Additional factors may also contribute, such as the curvature of the IMM found near MCSs, which may be favorable to promote assembly of both MICOS subcomplexes at these sites.
Our data have implications not only for MICOS assembly, but also for how cristae are positioned within the organelle. In wild-type yeast cells, where cristae outnumber ER MCSs, our data suggest that a subset of MICOS assemblies are juxtaposed to ER MCSs. While we do not yet understand their functional role, these sites may represent hot spots of MICOS assembly and/or cristae biogenesis. Indeed, in human cells, cristae are more frequently oriented toward the ER than would be expected by chance (Booth et al., 2016). Interestingly, in cells with overexpressed Vps39, the extended contact between mitochondria and the vacuole appears to promote IMM reorganization such that cristae appear excluded from the vCLAMP site (Hönscher et al., 2014). These data are consistent with our observations that Mic60, but not Mic27, redistributes to vCLAMP sites in the context of the holo-MICOS complex, and could indicate that alterations in MICOS may be responsible for the disruption of cristae organization in vCLAMP-forming cells. Given MICOS localization at the IMM/OMM interface, another possibility is that a subset of ER-linked MICOS complexes may play an organizational role, for example to couple matrix-localized processes such as mtDNA replication or coenzyme Q biogenesis that have previously been spatially linked to the ER (Eisenberg-Bord et al., 2019; Lewis et al., 2016; Subramanian et al., 2019).
Materials and methods
Plasmids and yeast strain construction
All yeast strains were constructed in the W303 genetic background (ade2-1; leu2-3; his3-11, 15; trp1-1; ura3-1; and can1-100), except in the case of ERMES bypass experiments (Fig. 2 F and Fig. S2, E–G), which were constructed using the BY4741 and BY4742 genetic backgrounds. All deletions were generated using PCR-based homologous recombination, replacing the complete open reading frame with selection cassettes amplified from pFA6a-NatMX, pFA6a-KanMX6, pFA6a-hphMX6, or pFA6a-His3MX6 (Longtine et al., 1998).
C-terminal protein fusions were integrated at the indicated endogenous chromosomal locus and driven by the native promoter. mCherry, EGFP, and HaloTag fusions were generated by PCR-based homologous recombination using pFA6a-link-yEGFP-SpHIS5, pFA6a-link-yEGFP-Kan, pFA6a-link-3x-yEGFP-ura, pFA6a-yEGFP-NatMX, pFA6a-mCherry-SpHIS5MX6, pFA6a-mCherry-NatMX, pFA6a-yoHalo::CaUra3, and pFA6a-yoHalo::NatMX (Graef et al., 2013; Lackner et al., 2013; Sheff and Thorn, 2004; Subramanian et al., 2019). pFA6a-yEGFP-NatMX, pFA6a-mCherry-NatMX, and pFA6a-yoHalo::NatMX were generated by cloning the NatMX cassette into the BglII/EcoRV sites of pFA6a-link-yEGFP-Kan, pFA6a-mCherry-KanMX, and pFA6a-yoHalo::CaUra3, respectively. To generate C-terminal TagBFP fusions, pFA6a-TagBFP-SpHIS5 was generated by PCR amplifying yeast codon–optimized TagBFP from pVT100-mtTagBFP (Friedman et al., 2015), digesting with AscI/PacI, and cloning into the PacI/AscI sites of pFA6a-link-yEGFP-SpHIS5. C-terminal 3x-HA fusions of Mic19 were generated by PCR-based homologous recombination using pFA6a-3HA-kanMX6 (Longtine et al., 1998).
To constitutively overexpress Vps39 and generate mKate-marked vCLAMP patches, PCR-based homologous recombination was performed using pYM-N17-mKate2, which was generated by PCR amplifying yeast codon–optimized mKate2 from pFA6a-link-yomKate2-SpHis5 (Lee et al., 2013), digesting with XbaI/EcoRI, and cloning into the XbaI/EcoRI sites of pYM-N17 (Janke et al., 2004), replacing EGFP.
Combinations of multiple tags and deletions were generated by backcrossing and tetrad dissection and/or by serial PCR-based homologous recombination. All ERMES deletions were generated by sporulation and tetrad dissection of a diploid MMM1/Δmmm1 strain, followed by selection of desired markers. ERMES bypass strains in the BY4741 and BY4742 strain backgrounds were generated as above by coexpressing dominant pVps13(L1627S) (Lang et al., 2015) during strain generation. Cells were made ρ0 by serial dilution in YPD medium (1% yeast extract, 2% peptone, and 2% dextrose) supplemented with 25 µg/ml ethidium bromide for 48–72 h.
Wild-type and mutant alleles of Mic60 were expressed ectopically or integrated at the ura3-1 locus under control of the native Mic60 promoter using plasmids described as follows. pRS316-Mic60-EGFP was generated by digesting Mic60-EGFP from pRS306-Mic60-EGFP (Friedman et al., 2015) with KpnI/NotI and cloning into the KpnI/NotI sites of pRS316. pRS316-Mic60(1–466)-EGFP, pRS306-Mic60(1–365)-EGFP, pRS316-Mic60(1–365)-EGFP, pRS316-Mic60(1–138)-EGFP, pRS306-Mic60(ΔCC)-EGFP, and pRS316-Mic60(ΔCC)-EGFP were generated by PCR amplifying the Mic60 promoter, the indicated coding regions of Mic60 fused to EGFP, and the ADH terminator from pRS306 Mic60-EGFP and cloning into either pRS306 or pRS316 by isothermal assembly and/or subcloning. Mic60(ΔCC) indicates an in-frame deletion of Mic60 amino acids 139–365. pRS306 Mic60(LBS*)-EGFP was generated by site-directed mutagenesis of pRS306-Mic60-EGFP to Mic60(RW432-433DD), as described previously (Hessenberger et al., 2017). All amino acid notations are based on the Mic60 coding sequence from the W303 strain.
To visualize mitochondria with a matrix-targeted fluorescent protein, the following plasmids were used: pYX142-mito-dsRed (Friedman et al., 2011), pVT100U-mt-TagBFP (Friedman et al., 2015), and pRS305-mito-dsRed::LEU/NAT (pLL19; Abrisch et al., 2020), which were all previously described. To visualize the ER with a lumen-targeted fluorescent protein, the following plasmids were linearized and integrated into the yeast genome: YIplac204/TKC-GFP-HDEL (Rossanese et al., 2001) and pRS305-mCherry-HDEL (Friedman et al., 2018) were previously described; pRS305-HaloTag-HDEL was generated by PCR amplifying yeast codon–optimized HaloTag from pFA6a-yoHalo:CaUra3 and replacing mCherry in pRS305-mCherry-HDEL by isothermal assembly.
Fluorescence microscopy
Fluorescence microscopy experiments were performed with (1) a Nikon Eclipse Ti inverted epifluorescence microscope equipped with either an Andor Zyla 4.2 sCMOS (scientific complementary metal–oxide–semiconductor) or a Photometrics Prime BSI sCMOS camera and a Nikon 100× 1.45-NA objective and acquired with Nikon Elements or (2) a Deltavision pDV inverted epifluorescence microscope equipped with a Photometrics CoolSnap HQ2 camera and a 60× 1.42-NA objective and acquired with SoftWoRx. All images were deconvolved using AutoQuant X3 (10 iterations, blind deconvolution, and low noise), and linear adjustments were made with Fiji. All data analysis/quantification was performed on nondeconvolved (raw) images using Fiji (see below). All z-series images were obtained using a 0.2-µm step size, and single-plane images are shown, except where noted in figure legends.
Airyscan microscopy images were acquired with a Zeiss LSM880 equipped with an Airyscan FAST module and a 63× 1.4-NA objective. Time-lapse series were acquired in SR mode with line-by-line acquisition and were processed in Zen Black using the automatic Airyscan processing settings. Processed images were deconvolved using AutoQuant X3 (10 iterations, blind deconvolution, and low noise), and linear adjustments were made with Fiji. All z-series images were obtained using a 0.17-µm step size, and single-plane images are shown.
All live-cell imaging for microscopy-based experiments was performed with cells grown to exponential growth phase in YPD (all strains involving Δmmm1 or mmm1-1 or experiments with no plasmid selection) or synthetic dextrose medium (0.7% yeast nitrogen base, 2% glucose, and amino acids) with appropriate auxotrophic selection. Cells were immobilized on either cavity microscope slides with a 3% agarose bed of synthetic dextrose with complete amino acid supplementation or glass-bottom microscope dishes (MatTek) precoated with concanavalin A. All strains were grown at 23°C or 30°C, except for temperature-sensitive strains, which were grown to exponential phase and subsequently incubated at 37°C for the indicated times immediately before imaging. HaloTag-expressing cells were labeled with JF646 HaloTag ligand (Promega; 1 µM final concentration in growth medium) for 30 min at room temperature, washed once with water, concentrated, and imaged. In the case of mmm1-1 strains incubated with JF646, these cells were labeled for the final 30 min of incubation at 37°C before imaging.
Image analysis and quantification
To quantify the proximity of Mic60 or Mic27 subcomplexes to Mdm34 (Fig. 1 J and Fig. S3 G) or Lam6 (Fig. S3 B) foci, MICOS assemblies were first identified blind to the presence or absence of Mdm34/Lam6. Assemblies were then determined to be overlapping or partially overlapping with Mdm34/Lam6 foci. In cases where assemblies were proximal to Mdm34/Lam6, the distance between the centers of foci was measured and categorized to be less than or greater than 500 nm. Images were collected from three to five independent experiments, and ≥80 foci were analyzed per experiment. Data depicted graphically are the collective sum of data from all experiments.
To quantify the effect of ERMES inactivation on Mic60 or Mic27 assembly formation in Δmic19 mmm1-1 cells (Fig. S2, B and C), cells were identified that exhibited spherical mitochondria indicative of ERMES inactivation and clear boundary localization of Tim23 blind to the Mic60 or Mic27 markers. Then, Mic60-EGFP and Mic27-EGFP expressed in those cells were manually categorized as having discrete assemblies, minor concentrations, or uniform labeling relative to Tim23-mCherry. Images were collected from both strains in three independent experiments, and ≥50 cells were analyzed per strain per experiment. Data depicted graphically are the collective sum of data from all experiments.
To quantify the number of Mic60 (Fig. 3 F) or Mic27 (Fig. S2 G) assemblies per cell, images from each strain were captured from cells grown in three independent experiments. The number of foci per cell were counted relative to the mitochondrial marker blinded to the identity of the strain. At least 45 cells were counted per strain per experimental replicate, and data depicted graphically are the average of the three experiments.
To determine the depletion of Mic27 assemblies relative to Mic60 assemblies in Δmic19 MMM1 and Δmic19 mmm1-1 strains (Fig. 2, C and D), Mic60 assemblies in each condition were identified blind to Mic27 and subsequently determined to be positive or negative for Mic27 assemblies. Images were collected from three independent experiments, and ≥35 foci were analyzed per condition per experiment. Data depicted graphically are the collective sum of data from all experiments.
To determine the localization of Mic60 and Mic27 subcomplex assemblies upon Vps39 overexpression in Δmic19 and Δmic60 cells, respectively (Fig. 5 C), Mic60 and Mic27 assemblies were blindly identified and categorized as overlapping, adjacent, or not colocalized with Vps39. Images were collected from three independent experiments, and ≥59 assemblies were analyzed per experiment. Data depicted graphically are the collective sum of data from all experiments.
To determine the enrichment of Mic60 and Mic27 at a vCLAMP marked by overexpressed mKate-Vps39 in otherwise wild-type cells (Fig. 5 F), images from each strain background were blinded. Then, vCLAMPS were identified blind to the Mic60-EGFP or Mic27-EGFP marker. Finally, the EGFP marker from each condition was manually examined relative to the mitochondrial marker and categorized as positive or negative for enrichment at the vCLAMP site. At least 35 vCLAMPs were counted per strain per experimental replicate, and data depicted graphically are the average of the three experiments.
Whole-cell extracts and Western blot analysis
Cells were grown to exponential phase in either YPD or synthetic dextrose medium, and whole-cell extracts were prepared from 0.25 OD600 cells by alkaline extraction (0.255 M NaOH and 1% 2-mercaptoethanol), followed by precipitation in 9% trichloroacetic acid. Precipitates were washed with acetone, dried, and resuspended in 50 µl MURB protein sample buffer (100 mM MES, pH 7.0, 1% SDS, 3 M urea, and 10% 2-mercaptoethanol) before Western analysis. Samples were boiled for 1–2 min, analyzed by SDS-PAGE, transferred to nitrocellulose, and immunoblotted with the following primary antibodies: mouse α-HA (26183; Thermo Fisher Scientific); rabbit α-GFP (ab290; Abcam), or rabbit α-G6PDH (A9521; Sigma-Aldrich). The appropriate secondary antibodies conjugated to DyLight 680 and 800 (Thermo Fisher Scientific) were used and visualized with the Odyssey Infrared Imaging System (LI-COR). Linear adjustments to images were made using Adobe Photoshop.
Cell growth analysis
Cells were grown to exponential phase in YPD, pelleted, washed with water, and resuspended at a concentration of 0.5 OD600/ml. Serial 1:10 dilutions of cells were plated on YPD or YPEG (1% yeast extract, 2% peptone, 3% ethanol, and 3% glycerol) plates, where indicated, and grown for 48–72 h at 30°C.
Immunopurification and MS analysis
Immunopurifications were performed as previously described (Hoppins et al., 2011), except 500 OD600 cells were used. Cells were grown to exponential phase at room temperature in YPD and either harvested or, where indicated, grown an additional 2 h at 37°C before harvesting. Cell pellets were washed with water and resuspended in lysis buffer (20 mM Hepes, pH 7.4, 150 mM KOAc, 2 mM Mg(Ac)2, 1 mM EGTA, 0.6 M sorbitol, and 1× Protease Inhibitor Mixture I [Calbiochem]), flash-frozen dropwise in liquid N2, and lysed using a Freezer/Mill (SPEX). Cell lysates were cleared by centrifugation, cross-linked for 30 min with 1 mM DSP (dithiobis(succinimidylpropionate); Thermo Fisher Scientific), solubilized with 1% digitonin (EMD Millipore) for 30 min, and pelleted again. The resulting supernatant was used for purifications with μMACS anti-GFP microbeads (Miltenyi Biotech), and beads were isolated with μ columns and a μMACS separator (Miltenyi Biotech). Samples were eluted using on-bead trypsin digestion by applying 25 µl elution buffer 1 (2 M urea, 50 mM Tris-Cl, pH 7.5, 1 mM DTT, and 5 µg/ml trypsin) for 30 min followed by 2× 50 µl elution buffer 2 (2 M urea, 50 mM Tris-Cl, pH 7.5, and 5 mM chloroacetamide) and incubated overnight. Samples were quenched by addition of 1 µl trifluoroacetic acid and submitted to the UT Southwestern Proteomics Core for liquid chromatography/tandem MS analysis.
The samples underwent solid-phase extraction cleanup with an Oasis HLB plate (Waters) and were subsequently dried and reconstituted into 10 µl of 2% ACN and 0.1% trifluoroacetic acid. 2 µl of these samples were injected onto a QExactive HF mass spectrometer coupled to an Ultimate 3000 RSLC-Nano liquid chromatography system. Samples were injected onto a 75-µm-inner-diameter, 15-cm-long EasySpray column (Thermo Fisher Scientific) and eluted with a gradient from 0 to 28% buffer B over 90 min with a flow rate of 250 nl/min. Buffer A contained 2% (vol/vol) ACN and 0.1% formic acid in water, and buffer B contained 80% (vol/vol) ACN, 10% (vol/vol) trifluoroethanol, and 0.1% formic acid in water. The mass spectrometer operated in positive ion mode with a source voltage of 2.1 kV and an ion transfer tube temperature of 275°C. MS scans were acquired at 120,000 resolution in the Orbitrap, and ≤20 tandem MS spectra were obtained for each full spectrum acquired using higher-energy collisional dissociation for ions with charges 2–8. Dynamic exclusion was set for 20 s after an ion was selected for fragmentation.
Raw MS data files were analyzed using Proteome Discoverer v2.4 (Thermo Fisher Scientific), with peptide identification performed using Sequest HT searching against the Saccharomyces cerevisiae protein database from UniProt. Fragment and precursor tolerances of 10 ppm and 0.02 D were specified, and three missed cleavages were allowed. Carbamidomethylation of Cys was set as a fixed modification, with oxidation of Met set as a variable modification. The false discovery rate cutoff was 1% for all peptides. For comparative analysis of MICOS interactions in different strain backgrounds, the number of spectra identified for each subunit was normalized between strain backgrounds based on the number of Mic27 spectra identified.
Online supplemental material
Fig. S1 shows examples of classification of MICOS subcomplex localization relative to the ER. It also shows the behavior of Mic60 subcomplex assemblies in the presence of Mic19. Fig. S2 shows the distribution of the holo-MICOS complex and subcomplexes in ERMES mutants and the effects of ERMES bypass on the Mic27 subcomplex. Fig. S3 shows additional experiments demonstrating that Mic60 assemblies localize in proximity to the ER and analysis of functional domains of Mic60 that target it in proximity to the ER. Table S1 shows raw data related to immunopurification and MS analysis of Mic27-EGFP. Video 1 and Video 2 show Mic60 assembly localization in Δmic19 cells relative to the ER over time. Video 3 and Video 4 show Mic27 subcomplex localization in Δmic60 cells relative to the ER over time. Video 5 and Video 6 show Mic60 subcomplex assemblies localize in proximity to the ER over time independent of ERMES and Lam6. Video 7 and Video 8 show that a subset of Mic60 and Mic27 assemblies, respectively, localize in proximity to the ER over time in the context of the holo-MICOS complex. Video 9 and Video 10 show that a subset of Mic60 assemblies localize in proximity to ERMES foci over time in the context of the holo-MICOS complex.
Acknowledgments
We thank Mike Henne, Laura Lackner, and Jodi Nunnari for suggestions and critical scientific discussions. pVps13(L1627S) was a kind gift from Benoit Kornmann, and pFA6a-yoHalo::CaUra3 was kindly provided by Kelly Subramanian and Jodi Nunnari. The UT Soutwestern Proteomics Core Facility performed proteomic analysis.
The UT Southwestern Live Cell Imaging Facility, which is supported in part by National Institutes of Health grant P30CA142543, provided access to the Zeiss LSM880/Airyscan microscope (purchased with National Institutes of Health grant 1S10OD021684-01 to KLP) and deconvolution software. J.R. Friedman is supported by funding from the National Institutes of Health (R00HL133372 and R35GM137894) and the Welch Foundation (I-1951-20180324).
The authors declare no competing financial interests.
Author contributions: P.S. Tirrell: investigation, formal analysis, and writing—review and editing. K.N. Nguyen: investigation and formal analysis. K. Luby-Phelps: investigation and formal analysis. J.R. Friedman: conceptualization, investigation, formal analysis, funding acquisition, supervision, writing—original draft, and writing—review and editing.