
Antibiotics in childhood have been linked with diseases including asthma, juvenile arthritis, type 1 diabetes, Crohn’s disease and mental illness. The underlying mechanisms are thought related to dysbiosis of the gut microbiome. We conducted a systematic review of the association between antibiotics and disruption of the pediatric gut microbiome. Searches used MEDLINE, EMBASE and Web of Science. Eligible studies: association between antibiotics and gut microbiome dysbiosis; children 0–18 years; molecular techniques of assessment; outcomes of microbiome richness, diversity or composition. Quality assessed by Newcastle–Ottawa Scale or Cochrane Risk of Bias Tool. Meta-analysis where possible. A total of 4,668 publications identified: 12 in final analysis (5 randomized controlled trials (RCTs), 5 cohort studies, 2 cross-sectional studies). Microbiome richness was measured in 3 studies, species diversity in 6, and species composition in 10. Quality of evidence was good or fair. 5 studies found a significant reduction in diversity and 3 a significant reduction in richness. Macrolide exposure was associated with reduced richness for twice as long as penicillin. Significant reductions were seen in Bifidobacteria (5 studies) and Lactobacillus (2 studies), and significant increases in Proteobacteria such as E. coli (4 studies). A meta-analysis of RCTs of the effect of macrolide (azithromycin) exposure on the gut microbiome found a significant reduction in alpha-diversity (Shannon index: mean difference −0.86 (95% CI −1.59, −0.13). Antibiotic exposure was associated with reduced microbiome diversity and richness, and with changes in bacterial abundance. The potential for dysbiosis in the microbiome should be taken into account when prescribing antibiotics for children.
Systematic review registration number: CRD42018094188
Research over recent years has emphasized the importance of the gut microbiome, and its association with health and the immune system. On the one hand, methods of enhancing the microbiome have proved effective. For example, probiotics have been used to reduce the incidence of severe necrotizing enterocolitis in preterm neonates as the gut microbiome is insufficiently developed to regulate the intestinal mucosa,1 and fecal microbial transplant (FMT) is being used successfully to treat patients with allergic colitis or Clostridium difficile infection.2,3 On the other hand, damage to the microbiome has been linked with conditions such as asthma,4–7 allergy,8 juvenile idiopathic arthritis,9,10 type 1 diabetes,11 obesity,12–17 celiac disease,18 mental illness,19 Crohn’s disease,20 and impaired neurocognitive outcomes.21
Although the mechanism of association for these diseases has not been fully explored, antibiotics, one of the most commonly prescribed drugs in children in western populations,22 appear to disrupt the normal maturation of the microbiome and destabilize it, altering basic physiological equilibria.23,24 Antibiotics also seem to affect gene expression, protein activity and overall metabolism of the gut microbiota which may directly influence major organ development and immune functioning.25 Antibiotic exposure has already been shown to alter the gut microbiome in adults and in neonates.26,27 This review sought to systematically examine the research into the association between antibiotic exposure and pediatric gut microbiome disruption.
The literature search identified 4,688 publications. The process of publication selection is described in Figure 1. Twelve studies met the eligibility criteria, were deemed good (nine studies) or fair (3 studies) in quality and were included in the final analysis. Meta-analysis was carried out on four RCTs that shared the Shannon Index as their outcome measure of the impact of antibiotics up to 14 days after administration. Quality assessments of RCTs are presented in Supplementary Data Figure S1 (Cochrane Risk of Bias Tool).28A high risk of bias was found in Wei et al.’s trial with respect to blinding of the outcome in the analysis done at 4 years but there was no such risk with respect to the analysis done at 14 days.29Quality assessments (Newcastle–Ottawa Scale) of observational cohort studies are presented in Supplementary Data Table S1 and of cross-sectional studies in Supplementary Data Table S2.30,31

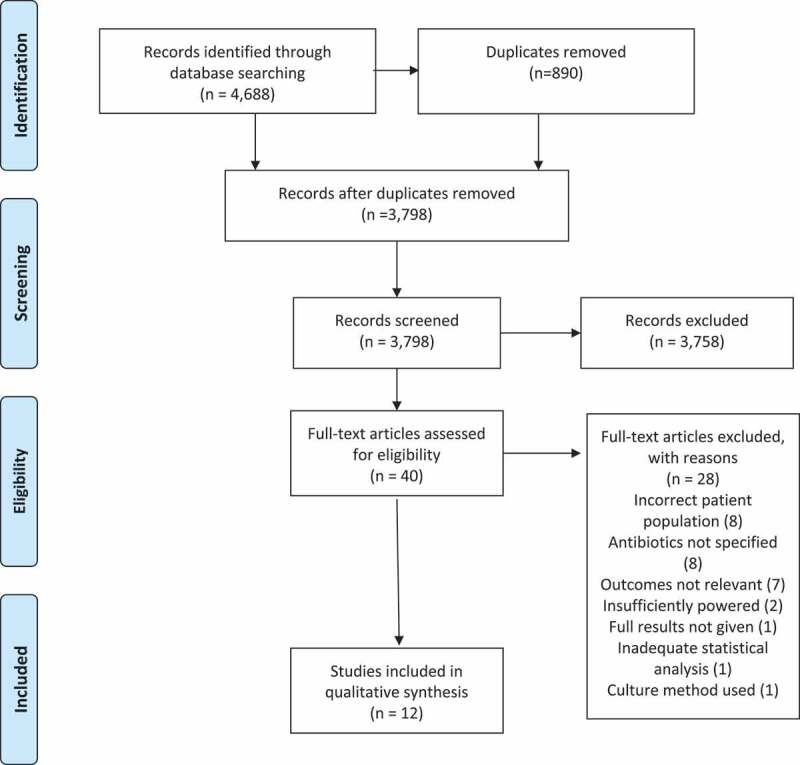
PRISMA flow chart. Preferred reporting items for systematic reviews and meta-analyses 2009
The main characteristics of the included studies are summarized in Table 1. There were five randomized controlled trials (RCTs), five cohort studies and two cross-sectional studies. All studies detected changes in composition of the microbiome following antibiotic exposure in 3 main outcomes: reduction in microbiome species richness; reduction in species diversity; and change in taxonomic composition (change in a specific phylum, genus or species). The primary aim varied between studies. The age of participants ranged from new-born to 12 years old. Nearly all studies reported the short-term associations between antibiotic exposure (up to 1 month) and microbiome composition; some also reported longer-term outcomes up to 2 years and 4 years.33,37,29,42

| Author, year, location | Design and reference group | Aim | Study participants (n), age | Antibiotic exposure (route; duration) | Exposure to outcome interval (sampling frequency) | Molecular technique | Key findings: Richness | Key findings: Diversity | Key findings: Taxonomical change |
|---|---|---|---|---|---|---|---|---|---|
| 1.Bai et al.32 China | Cross-sectional with (control group) | Added impact of antibiotics on microbiota changes in ALL | 33 healthy children; 10 received antibiotics 1–12 years | Cephalosporin Penicillin (oral + IV: 10 days) | 1–4 weeks (x1) | Next generation sequencing (NGS) | n/a | Reduction in α-diversity Shannon index, ~2.75 (antibiotics) vs ~3.25 (control), p < .05 # Simpson index ~0.15 (antibiotics) vs ~0.09 (control) p < .05 # a | Decreased Firmicutes/Bacteroidetes ratio by approximately one third (p < .05) No difference in abundances of Actinobacteria and Proteobacteria |
| 2. Bokulich et al,33 USA | Cohort (baseline assessment) | Microbiome development in first 2 years of life | 43 infants, 25 received antibiotics 0–2 years | Cephalosporin Beta-lactams Macrolides Quinolones Nitrofurantoin (route/duration not specified) | 3–139 days (x25) | PCR, 16s RNA gene amplification | n/a | No change in α-diversity after antibiotic exposure for median 52 days (13–139) Reduced β–diversity: UniFrac distance, Permutational MANOVA, R2 < 0.01, p < .001 | No effect on Bifidobacterium abundance |
| 3.Brunser et al.34 Chile | RCT (baseline assessment) | Impact on microbiome of prebiotic supplement following antibiotic | 130 infants, before and after antibiotics 1–2 years | Amoxicillin (oral; 7 days) | 1–3 weeks (x3) | FISH* and flow cytometry | n/a | n/a | Decrease in amoxicillin-associated fecal bacteria by 30% (p < .001) Increase in amoxicillin associated E. Coli Log count 4.77 ± 0.96 (baseline) vs 5.10 ± 1.39 after treatment (p = .015) No change in total counts of Bifidobacterium and Bacteroides |
| 4.Doan et al.35 Niger | RCT (control group) | Effects of azithromycin on gut microbiome diversity | 80 children, 40 received antibiotics 1–5 years | Azithromycin (oral; single dose) | 5 days (x1) | 16S rRNA sequencing | n/a | Reduction in α-diversity: Inverse Simpson’s α-diversity decreased (5.03 95% CI 4.08–6.14) vs placebo (6.91; 5.82 − 8.21) p = .03 Shannon’s α-diversity decreased (10.60; 95% CI 8.82–12.36) vs placebo (15.42; 13.24–17.80) p = .004 No change in β-diversity Decrease in Simpson’s community level γ diversity with azithromycin (10.10 95% CI 7.80–11.40) vs placebo (17.72;13.80–20.21) (p < .001) | n/a |
| 5.Fouhy et al.36 Ireland | Cohort study (control group) | Effect of antibiotics on gut microbiome | 18 children, 9 received antibiotics Newborn | Ampicillin and gentamicin (IV:2–9 days) | 4 and 8 weeks (x2) | High throughput sequencing of 16S rRNA | n/a | No change in α-diversity (Shannon Index) at 4 weeks (3.6) vs control (3.6) (p = .575) | Decreased Bifidobacterium (5% vs 25%; p = .013) and Lactobacillus (1% vs 4%; p < .009) in treated group at 4 weeks vs control; no difference at 8 weeks Increased Proteobacteria (44% vs 23%; p < .005) and Enterobacteriaceae (50% vs 32%; p = .006) at 8 weeks vs control. Increased Clostridium in treated infants than controls at week 8 (7% vs 2%, p < .035) |
| 6.Korpela et al.37 Finland | Retro-spective controlled cohort study | Antibiotic induced changes in microbiota composition | 142 children, 99 received antibiotics 2–7 years | Macrolides Penicillins (route/duration not specified) | Variable (<6 months to 2 years) (x1-2) | DNA extraction, 16s rRNA gene sequencing | Macrolides: Reduced richness up to 2 years (p < .05)# Penicillins: Reduced richness over 6 months# (p < .001)resolved by 12 months | n/a | Macrolides: Exposure over 6 months Reduced Bifidobacterium (0.23-fold change p < .004) and Lactobacillus (0.12-fold change p < .004) Increased Bacteroides (2.04-fold change p < .004) and Proteobacteria (1.96-fold change (p < .02). Penicillins: Decreased Lactobacillus (0.09 fold; p < .004) with exposure in previous 12 months |
| 7.Mangin et al.38 Chile | Cohort (baseline assessment) | Impact of amoxicillin on fecal bifidobacteria | 31 infants, all received antibiotics 12–24 months | Amoxicillin (oral: 7 days) | 0 days (x2) | Total DNA extraction, PCR | n/a | n/a | No change in total Bifidobacteria Disappearance of Bifidobacterium adolescentis species (0% vs 36.4% (p < .001) |
| 8. Oldenburg et al.39 Burkina Faso | RCT (baseline assessment) | Investigate effect of 3 antibiotics on microbial diversity | 124 children, 93 received antibiotics 6–59 months | Amoxicillin Azithromycin Cotrimoxazole (oral: 5 days) | 5 days (x2) | DNA extraction, deep gene sequencing | n/a | Reduced α- diversity with Azithromycin: Inverse Simpsons’ index decreased (6.6 95% CI 5.5–7.8) vs baseline (8.8 95% CI 7.5–10.1) (p < .001) Shannon index decreased (11.0 95% CI 9.3–12.7) vs baseline (14.6 95% CI 13.0–16.2) (p < .001) No reduction with Amoxicillin or Cotrimoxazole | n/a |
| 9.Parker et al.40 India | RCT (baseline assessment) | Assess microbiota changes following azithromycin | 114 infants, 56 received antibiotics 6–11 months | Azithromycin (oral: 3 days) | 12 days (x2) | 16s rRNA gene sequencing, DNA extraction PCR | Lower OTU with azithromycin: (68.1 ± 15.4) vs placebo (73.6 ± 13.7) (linear regression p = .027) c. 7% less | No significant change in α-diversity (Shannon index) azithromycin (2.6 95%CI 2.47–2.73) vs placebo (2.8 95%CI 2.8(2.67–2.93) (p = .087) | Decreased relative abundance of Proteobacteria (mainly Escherichia) mean % ± SD: 15.9 ± 13.2 vs 10.2 ± 15.4 FDR (p < .001) and Verrucomicrobia (genus Akkermansia muciniphilia) 0.5 ± 3.1 vs 0.0 ± 0.0 FDR (p < .012) No change in Actinobacteria, Bacteroides and Firmicutes, Bifidobacterium |
| 10.Penders et al.41 The Netherlands | Cross Sectional (control group) | Examine contribution of external influences to gut microbiota composition | 1032 infants, 28 received antibiotics 1 month | Mainly Amoxicillin (oral: duration not specified) | <1 month (x1) | DNA isolation, PCR | n/a | n/a | Decrease with antibiotics in Bifidobacteria. Antibiotics (10.29 CFU/g log10) vs Control (10.7 CFU/g log10 (p < .01) Decrease in Bacteroides fragilis. Antibiotics (6.39 CFU/g log10) vs Control (9.31 CFU/g log10) (p < .01) No change in Lactobacilli, Escherichia coli, Clostridium difficile |
| 11. Wei et al.29 Denmark | RCT (control group) | Examine short- and long-term impacts of azithromycin treatment on gut microbiota in children | 72 children, 33 episodes of asthma-like symptoms received antibiotics 12–36 months | Azithromycin (oral: 3 days) | 14 days and up to 4 years (x3) | DNA extraction and sequencing | Decrease in richness at 14 days: Observed richness: 23% reduction (177.8 ± 56.0 vs. 230.6 ± 61.2, p < .001); no difference by mean 233 days | Reduced α-diversity: at 14 days: Shannon index: 13% reduction; 2.96 ± 0.80 (mean ± SD) vs control 3.41 ± 0.58, p = .009) Reduced β–diversity: UniFrac distance, treatment accounted for variance (R2 = 3.8%, p = .027 (weighted) and F2 = 4.2% p < .001 (un-weighted) | Reduction, 50-fold, in genus Bifidobacterium at 14 days (p adjusted <0.011 (FDR p < .05) Long term (13–39 months) no differences seen between azithromycin and placebo groups |
| 12.Yassour et al.42 Finland | Cohort (control group) | Study development of infant gut microbiome and effect of antibiotics | 39 children, 20 received antibiotics 2–36 months | Amoxicillin Cefalexin Clarithromycin Amoxicillin and clavulanic acid Trimethoprim and sulfadiazine Azithromycin Cefaclor Penicillin G Netilmicin (oral: duration not specified) | <1 month (x28) | 16S rRNA gene and whole genome shotgun sequencing | n/a | Reduced microbiome strain (subspecies) diversity (diversity index 0.0003 vs 0.55 (control) (p < .001) | Decreased abundance of species from clostridium clusters IV and XIVa (T regulatory immune cells) at aged 3 (median abundance ~9% vs ~15% control)b (p = .037) Less stable gut microbiome following antibiotic treatment (Jaccard Index P = <0.001) |
Key: # – Approximate mean values taken from a Box and Whisker plot; ꝉ – statistical significance testing, confidence intervals, or standard deviations not given; a – higher the Simpson index, the lower the diversity; b -raw data not given, approximate values taken from graph
Abbreviations: n/a- data not available. ALL: acute lymphoblastic leukemia. CFU/g = Colony forming units per gram of sample. FISH: Fluorescent in-situ hybridization. FDR – False Discovery Rate correction. OTU count: operational taxonomical unit.
Microbiome richness (Table 6) data were available for 3 studies and are shown in Table 2. Microbiota richness in children exposed to antibiotics was statistically significantly reduced compared to that of children not exposed to antibiotics in all three studies.29,37,40 Measures of richness included Operational Taxonomic Unit (OTU) count (see Table 2) and a generic measure of ‘observed richness’. The time between exposure and analysis was ≤ 14 days in 2 studies,29,40 and ≤ 6 months in one study.37 The reduction in richness reported by Wei et al. had resolved by the time of a second analysis (mean of 223 days following exposure).29 Korpela et al., found that microbiome richness was reduced for up to 1 year following penicillin exposure and for up to 2 years following macrolide exposure.37 Parker reported that the significant reduction in species richness was driven through depletion of Proteobacteria (mainly the species Akkermansia mucinophilia) which were particularly susceptible to azithromycin.40 Three other authors also commented on richness but did not report raw data and hence are not included in Table 2.32,36,42
| Study | Type | Age group | Country | Antibiotic | Duration of treatment | Time from exposure to analysis | Index of richness used | Placebo or Control (mean ± SD) | Intervention (mean ± SD) | Percentage difference | Significance |
|---|---|---|---|---|---|---|---|---|---|---|---|
| Wei et al.29 | RCT | 1–3 years | Denmark | Azithromycin | 3 days | 14 days | Observed richness | 230.6 ± 61.2 | 177.8 ± 56.0 | −25.9% | p < .001 |
| Parker et al.40 | RCT | 6–11 months | India | Azithromycin | 3 days | 12 days | OTU count | 73.6 ± 13.6 | 68.1 ± 15.4 | −7.5% | p = .027 |
| Korpela et al.37 | Retro- spective cohort | 2–7 years | Finland | Macrolides (M) Penicillins (P) | n/a | <6 months | OTU count | 230# | 175# (M) 180# (P) | −23.91%(M) -21.74% (P) | p < .001 p < .001 |
# Approximate value taken from bar chart. Confidence intervals or standard deviations not available. n/a = not available.
SD = Standard Deviation.
Microbiome species diversity was reported by 8 studies.32,33,35,36,39,40,29,42 Data were available for 6.29,32,35,36,39,39,40 The main diversity outcome measure was alpha-diversity (Table 3). Antibiotic use was associated with a reduction in alpha-diversity (measured by Shannon or Simpson/Inverse Simpson indices) in 4 studies.29,32,35,39 Initial Shannon diversity indices varied substantially by geographical location (approximate index value of ‘3ʹ in studies in China, Denmark, India, and Ireland to approximate index value of ‘15ʹ in Burkina Faso and Niger). We carried out a meta-analysis of 4 RCTs examining the effect of azithromycin on the microbiome measured by the Shannon Index. We found a statistically significant overall reduction in alpha-diversity (mean difference −0.86 (−1.59 to −0.13, p < .001) (Figure 2).
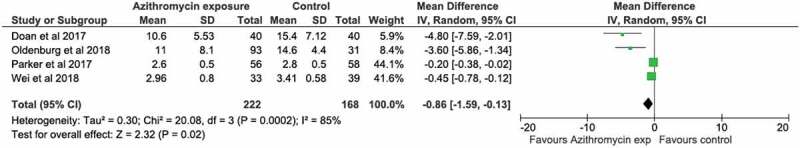
Meta-analysis of trials of azithromycin that used Shannon Index of microbiome alpha diversity as the outcome
| Study authors, year, type and setting | Age group | Antibiotic | Days of therapy | Time between exposure and analysis | Indices of alpha-diversity used | Placebo/Control Group mean (95% CI) | Intervention group mean (95% CI or SD) | Percentage difference | Significance |
|---|---|---|---|---|---|---|---|---|---|
| Doan et al.35 RCT Niger | 1–5 years | Azithromycin | Single dose | 5 days | Shannon Inverse Simpson | 15.42 (13.24–17.80) 6.91 (5.82–8.21) | 10.60 (8.82–12.36) 5.03 (4.08–6.14) | −31.25% -27.21% | p = .004 p = .03 |
| Oldenburg et al.39 RCT Burkino Faso | 6–59 months | Azithromycin | 5 days | 5 days | Shannon Inverse Simpson | 14.6 (13.0–16.2) 8.80 (7.5–10.1) | 11.0 (9.3–12.7) 6.6 (5.5–7.8) | −24.65% -25.0% | p < .001 p < .001 |
| Wei et al.29 RCT Denmark | 1–3 years | Azithromycin | 3 days | 14 days | Shannon | 3.41 (3.23–3.59) | 2.96 (2.69–3.23) | −13.19% | P = .009 |
| Parker et al.40 RCT India | 6–11 months | Azithromycin | 3 days | 12 days | Shannon | 2.8 (2.67–2.93) | 2.6 (2.47–2.73) | −7.14% | P = .087 |
| Bai et al.32 Cross-sectional China | 1–12 years | Cephalosporin, Penicillin | 10 days | 1–4 weeks | Shannon Simpson | 3.25* | 2.75* | −15.38% | P < .05 |
| Fouhy et al.36 Cohort Ireland | New-born | Ampicillin; gentamicin | 2–9 days | 4 weeks | Shannon | 3.8† | 3.6† | −5.26% | P = .575 |
† Confidence intervals or standard deviation not available*approximate values taken from box and whisker plot.
Beta-diversity was reported in 3 studies and significantly reduced in 2 of those.29,33,35 Bokulich examined the impact of exposure to several different classes of antibiotics: cephalosporins, beta-lactams, macrolides, quinolones, and nitrofurantoin.33 They found that although microbiome alpha-diversity was unchanged following antibiotic exposure, beta-diversity differed significantly between children exposed to antibiotics and those unexposed (UniFrac distance, permutational MANOVA, R2 < 0.01 p < .001).33 This means that although the individual diversity index did not change (i.e. wide species variety and abundance) there was a significant change in the types of species found. With regards to azithromycin exposure alone, Wei reported associations with reduced alpha and beta diversity.29 Doan however found that beta diversity was unaffected (i.e., similar types of species in the two groups) following azithromycin exposure. But there was a 43% decrease in Simpson’s community-level gamma diversity (p < .001) which reflected the overall reduction in bacterial diversity of the treatment group compared to the placebo group.35 Six of eight studies reporting on species diversity found a significant association between antibiotic use and a reduction in species diversity.
The major phyla reported in all studies were Actinobacteria, Bacteroidetes, Firmicutes, and Proteobacteria. One study reported the phylum Veruccomicrobia.40 A significant increase or decrease in the abundance of a particular phylum, genus or species was reported in 10 studies. These results are summarized in Table 4.
| Study Author, year, type of study, country, duration. | Antibiotic (days of treatment where given) | Time from exposure to analysis | Actinobacteria (includes genus Bifidobacteria) | Bacteroidetes | Firmicutes (gram positive) | Proteobacteria (gram negative) |
|---|---|---|---|---|---|---|
| Bai et al.32 Cross-Sectional China 1–12 years | Cephalosporin, Penicillin 10 days | 1–4 weeks | No change in Actinobacteria | F/B ratio decreased by approx. 1/3(p < .05) * (increase in Bacteroidetes) | F/B ratio decreased by approx. 1/3 (p < .05) * (decrease in Firmicutes) | No change |
| Bokulich et al.33 Cohort USA 0–2 years | Cephalosporin Beta lactams Macrolides Quinolones Nitrofurantoin | 3–139 days | No change in Bifidobacteria | Increased (p < .05) * | Clostridiales decreased from 3–9 months of age* | Increased (p < .05) * |
| Brunser et al.34 Cohort Chile 0–2 years | Amoxicillin 7 days | 1–3 weeks | No change in Bifidobacteria | No change | n/a | E. coli increased vs baseline (Log 4.77 ± 0.96 vs Log 5.10 ± 1.39 p = .015) |
| Fouhy et al.36 Cohort Ireland Neonates | Ampicillin; gentamicin 2–9 days | 4 weeks | Lower levels of Bifidobacteria at 4 weeks vs control (5% vs 25%; p = .013); no difference at 8 weeks | No change | Lower levels of Lactobacillus at 4 weeks vs control (1% vs 4%; p < .009); no difference at 8 weeks | Higher proportions of Proteobacteria (44% vs 23%; p < .005) and Enterobacteriaceae (50% vs 32%; p = .006) at 8 weeks vs control |
| Korpela et al.37 Retrospective cohort Finland 2–7 years | Macrolides (M) Penicillins (P) | <6 months | Exposure in previous 6 months M: Bifidobacterium (0.23-fold decrease p < .004) P: Bifidobacterium: no change | Exposure in previous 6 months M: Bacteroides increased (2.04-fold change p < .004) P: Bacteroides: no change | Exposure in previous 6 months M: Lactobacillus decreased (0.12-fold change p < .004), Clostridium increased (2.68-fold change p < .004) P: Lactobacillus decreased (0.11-fold change p < .004), Clostridium: no change | M: Proteobacteria increased (1.96-fold change p < .02) with exposure in previous 6 months P: no change |
| Mangin et al.38 Cohort Chile 6–59 months | Amoxicillin 7 days | 0 days | Total Bifidobacterium concentrations not significantly altered but complete disappearance of Bifidobacterium adolescentis species (0% vs 36.4% (p < .001) | n/a | n/a | n/a |
| Parker et al.40 RCT India 6–11 months | Azithromycin 3 days | 12 days | No change in Actinobacteria or Bifidobacterium | No change | No change | Proteobacteria reduced (relative abundance mean % ± SD: 15.889 ±13.207 (placebo) vs 10.200± 15.401 (azithromycin), FDR p < .001) E.coli reduced (relative abundance mean % ± SD:12.087± 12.457 (placebo) vs 7.309 ±13.258 (azithromycin), FDR p < .013) |
| Penders et al.41 Cross sectional Netherlands 1 month | Amoxicillin** | < 1 month | Bifidobacteria median count placebo log10 CFU/g feces 10.70 vs amoxicillin log CFU/g feces 10.29 (p < .01) | Bacteroides fragilis median count placebo log10 CFU/g feces 9.31 vs amoxicillin log10 CFU/g 6.39 (P < .01) | No change (lactobacilli) | No change in Clostridium difficile and E.Coli |
| Wei et al.29 RCT Denmark 1–3 years | Azithromycin 3 days | 14 days | 50 x reduction (fold change) in genus Bifidobacterium at 14 days (p adjusted < 0.011 (FDR p < .05) | n/a | n/a | n/a |
| Yassour et al.42 Cohort Finland 2–36 months | Amoxicillin Cefalexin Clarithromycin Amoxicillin and clavulanic acid Trimethoprim and sulfadiazine Azithromycin Cefaclor Penicillin G Netilmicin | < 1 month | n/a | n/a | Decrease in abundance of species from clostridium clusters and 14XIVa IV (T regulatory immune cells) at aged 3 (median abundance ~9% vs ~15% control) b (p = .037) | n/a |
Key: †Confidence intervals or Standard Deviation not available. # Approximate value taken from bar chart. No confidence intervals or SD available. *no raw data. ** authors state that the antibiotics taken were ‘mainly amoxicillin’. b raw data not given; approximate values taken from graph.
Abbreviations: CFU/g = Colony forming unit/gram; F/B ratio = Firmicutes/Bacteroidetes ratio. FDR – false discovery rate correction. M = macrolides . P = penicillins. n/a = Data not available.
The association between antibiotics and the abundance of genus Bifidobacterium (phylum Actinobacteria) was examined in 9 studies (Table 4). In five studies, antibiotics were significantly associated with reduced abundance of Bifidobacteria.29,36–38,41 Both penicillins and macrolides were associated with a decrease in Bifidobacteria although in some studies there was no change. Comparing macrolides with penicillins, Korpela et al. found that exposure to macrolides was associated with a fourfold decrease in Bifidobacteria but that exposure to penicillins was not associated with Bifidobacteria levels.37 Fouhy et al. found that a combination of ampicillin and gentamicin was associated with reduced Bifidobacteria initially, but that by 8 weeks levels had returned to that of the control group.36 At species level, Mangin et al. found amoxicillin exposure was associated with complete disappearance of Bifidobacterium adolescentis but that overall concentrations of Bifidobacteria were not altered.38
The association between antibiotics and the abundance of Bacteroidetes phylum (which includes the genus Bacteroides) was examined in seven studies (Table 4). There was a statistically significant change in 4 studies. The 3 studies that reported an increase in Bacteroidetes examined exposure to a combination of antibiotics including cephalosporins and macrolides.32,33,37 One study examining only amoxicillin exposure reported a decrease of the species Bacteroides fragilis.41 In 3 studies there was no change (studies examining amoxicillin, ampicillin/gentamicin and azithromycin).34,36,40
The association between antibiotics and the abundance of Firmicutes phylum (which includes the genera Lactobacillus and Clostridium) was examined in seven studies (Table 4).32,33,36,40,41,42 A statistically significant decrease was seen in 4 studies following antibiotic exposure.32,36,37,42 Korpela et al. reported that Lactobacillus levels were reduced for up to 12 months following penicillin use and for up to 24 months following macrolide use.37 The same study found a nearly 3-fold increase in Clostridium within 6 months of exposure to macrolides only (details of specific species not given).37 Yassour et al reported a 40% decrease in Clostridium spp. belonging to clusters IV and XIVa (inducers of T regulatory immune cells) in children aged 3 who had had antibiotics.42
The abundance of Proteobacteria following antibiotic exposure was examined in six studies (Table 4). In 5 studies there was a statistically significant change in Proteobacteria following exposure to a variety of antibiotics, however the direction of association was not consistent. At phylum level, 4 studies reported an increase in Proteobacteria following exposure to different antibiotics including penicillins, cephalosporins and macrolides.33,34,36,37 One study reported a decrease in Proteobacteria following azithromycin exposure only.40 At species level, a statistically significant increase in E.coli was reported following amoxicillin exposure in children aged 1–2 years,34 but a statistically significant decrease in E.coli was reported following azithromycin exposure in children aged 6–11 months.40
The association between azithromycin and a reduction in the abundance of phylum Verrucomicrobia was examined in one study (Table 4). This phylum has relatively few species described. Parker et al. examined the association between azithromycin and the species Akkermansia mucinophila which completely disappeared with azithromycin use (p < .003).40
As far as we are aware this is the first systematic review to synthesize the evidence of the association between antibiotic exposure and changes in the microbiome specifically in children. We found evidence of microbiome disruption characterized by changes in richness, diversity, and taxonomic composition. We cannot be sure of the duration of these changes from the data presented as most studies only presented short-term data. The studies were heterogeneous, with variation between studies in participant age, setting, duration of antibiotic exposure, type of antibiotic given, mode of delivery, outcome measures and time between exposure and analysis. These factors may influence the association between antibiotic use and microbiome composition. Evidence of change in a wide range of microbiome characteristics associated with antibiotic exposure requires further investigation and explanation.
We found evidence that antibiotic exposure was associated with a reduction in both richness and diversity. In particular azithromycin exposure reduced microbiome alpha-diversity by a mean reduction in Shannon index of 0.86. The studies looked at a variety of antibiotics covering narrow to broad-spectrum antibiotics, with macrolides and penicillins representing the antibiotics most commonly studied. Although no specific change in richness or diversity emerged according to antibiotic class, we found evidence that macrolides were associated with more changes in the microbiome than penicillins and with effects that persisted for longer.37,39
We also found evidence that antibiotic use was associated with a reduced number of gut bacteria thought to be beneficial. Bifidobacteria (phylum Actinobacteria) and Lactobacilli (phylum Firmicutes) are producers of short-chain fatty acids which have positive effects on mammalian energy metabolism and form the basis of probiotic supplements.45 The majority of studies, however, did not report changes in these genera at species level which limits our appreciation of the changes in specific species associated with antibiotics. We also found evidence that changes in other beneficial bacteria were associated with antibiotic use. One study reported a decrease in Clostridium clusters IV and XIVa which are inducers of T regulatory immune cells which have a role in regulating or suppressing other cells in the immune system.42 A second found that Azithromycin was statistically significantly associated with reduced numbers of Akkermansia Mucinophilia.40 This species has previously been recognized as having anti-inflammatory and immunostimulant properties, and improving intestinal barrier function, endotoxinaemia and insulin sensitivity.46
We found evidence that antibiotics were associated with a rise in Bacteroidetes and Proteobacteria following antibiotic exposure. These phyla include species which have been implicated in serious infection. Although Bacteroides spp. may provide some level of protection from invasive pathogens as a gut commensal, Bacteroides have also been associated with bloodstream infections and abscess formation.47 However, it cannot be assumed that higher levels of Bacteroides in the gut are the source of these infections. E.coli (Proteobacteria) is a common cause of urinary tract infections and sepsis and a major source of antimicrobial resistance.48
Our review highlights important findings regarding the relationship between antibiotic exposure and microbiome disruption in children. A strength of our study is that we only included studies with named antibiotics which included specific details of antibiotic administration, rather than exposure to ‘antibiotics’ in general. However, several studies included more than one named antibiotic, so in these cases it was not possible to associate a particular change with a specific antibiotic or class. In the majority of studies, the indication for antibiotic use was infection. In one study there was no clinical indication for antibiotic use but associations with changes in the microbiome were still present. This supports the independent association between antibiotic exposure and microbiome disruption, although further studies of this relationship are required.400
The use of different outcome measures limited our ability to make comparisons between studies. Although the primary outcomes reported in the RCTs were similar, the applicability of the meta-analysis result may be limited by variation in initial Shannon index scores which in turn might reflect microbiome diversity by geographical location. We could find no evidence of agreement in the literature on the definition of a normal Shannon Index. This substantial difference in variation by geographical location does not seem to have been highlighted in the literature previously and may be worth further investigation. Outcomes in observational studies covered a number of indices of richness, diversity, and taxonomical changes which precluded meta-analysis of all studies. This variation is likely to reflect a lack of consensus among researchers about the most suitable outcome measures in addition to the complexity of the microbiome itself.
The majority of the studies included in the review focussed on microbiome changes over a short time following antibiotic prescription, i.e. less than 1 month. There was limited evidence therefore of the duration of the changes following exposure. Studies that examined effects over time, found that microbiome disruption lasted between 1 and 2 years,29,37 depending on the antibiotic studied. In this interval some children will receive a further course of antibiotics potentially disrupting microbiome recovery.37,49 Further studies are necessary to determine the duration of microbiome disruption.
A systematic review of antibiotic prescribing in neonates (up to 44 weeks gestational age) looked at the effects of antibiotics on the neonatal microbiome and similarly found that antibiotic exposure was associated with reduced gut microbial diversity and reduced colonization rates of protective commensal bacteria, although the quality of evidence was low.27 A study looking at the gut microbiota of adults also found that antibiotic exposure was associated with a decrease in beneficial bacteria such as Bifidobacterium and butyrate producers and an increase in Enterobactericae (phylum Proteobacteria). The majority of the changes lasted for approximately 45 days, but the microbiome had not fully recovered by 180 days.26 Studies in mice support the findings of more reduced diversity following macrolide exposure compared to amoxicillin exposure. Cumulative effects on the microbiome of multiple antibiotic courses, delayed microbiome maturation following antibiotics and fewer changes associated with narrow-spectrum antibiotics have all been observed.50,51
In conclusion this review has gathered compelling evidence that antibiotic exposure in children is associated with a reduction in richness and/or diversity, and a change in the balance of species in the microbiome with reductions in the numbers of commensal bacteria thought to be beneficial. Studies that looked at the impact on the microbiome for more than 1 month were limited but there is evidence that antibiotics are associated with disruption to the microbiome for up to 2 years. Macrolide antibiotics cause immediate and longer term damage. More detailed understanding of the strength and duration of antibiotic-specific associations with microbiome dysbiosis in children is needed. Evidence should be sought of a causal relationship between antibiotic use in children, gut dysbiosis and subsequent risk of local or systemic pathological changes with repeated courses of antibiotics. In the meantime, healthcare practitioners should consider the potential for damage to the gut microbiome when prescribing antibiotics for children.
Procedures used in this review were consistent with Preferred Reporting Items for Systematic Reviews and Meta-Analyses (PRISMA) guidelines.
A review protocol was submitted in advance to PROSPERO, a database of systematic review protocols (registration ID: CRD42018094188).
Our inclusion criteria were: studies of any design-assessing change in the microbiome associated with named antibiotic exposure; participants aged from 0 to <18 years (excluding pre-term babies); assessment of composition and diversity of the microbiome using a genetic analysis technique; comparable reference group or baseline assessment and adequate statistical analysis. Our exclusion criteria were non-original research; studies investigating the impact of antibiotics in labor on neonates; studies investigating exposure to any intervention which was not a named antibiotic; studies assessing the impact of antibiotics on other systemic microflora only, e.g. skin, nasal; conference abstracts where insufficient data were given and where the study authors did not reply to further enquiries; and non-English language articles.
The literature search was performed in February 2019. The databases searched were MEDLINE, EMBASE and Web of Science. No restrictions were placed on the publication period. Search terms included both text words and MESH terms. The full search strategy can be viewed in Supplementary data Table S3.
Papers were screened using Covidence software (Melbourne, Australia) to efficiently identify the most relevant and appropriate papers. The first reviewer (LM) conducted the literature search and imported the references. Duplicate articles were removed. Two reviewers (LM and AG) screened titles and abstracts with respect to eligibility criteria. Full-text articles of potentially relevant studies were independently assessed for eligibility by two reviewers (LM and VR). Any disagreements were reviewed by another reviewer (PW) and resolved through discussion.
Information was extracted from included studies on the study type, purpose, characteristics of study participants (age, co-morbidities), details of the antibiotic exposure (name, route of administration), time between exposure and microbiome analysis, molecular technique used and study outcomes. Molecular techniques used included Fluorescent in-situ hybridization (FISH) and flow cytometry, 16s RNA sequencing, DNA extraction, Next Generation Sequencing (NGS) and whole-genome shotgun sequencing (see Table 5). We excluded papers that did not name the antibiotic as we could not guarantee that the participants had been exposed to antibiotics.
| Technique name | Definition |
|---|---|
| Fluorescent in-situ hybridization (FISH) | Molecular cytogenic analysis using fluorescent probes to detect, quantify and map genetic material. |
| Flow cytometry | Analysis of the frequency and other properties of cells stained with specific fluorochrome conjugated antibodies to identify bacteria, their viability, and their DNA content. |
| 16s rRNA sequencing | Amplification of a piece of RNA (amplicon) and sequencing to identify and compare bacteria within a sample. |
| DNA extraction | Purification of DNA using physical and chemical methods |
| Next Generation Sequencing (NGS) | Sequencing of DNA and RNA with different technologies |
| Whole genome shotgun sequencing | Comprehensive sampling of all genes in all organisms present to evaluate diversity and study ‘difficult to culture’ microorganisms. |
eta-analysis was performed where studies shared the same outcome and where output data were available to include in the analysis. We performed a meta-analysis of four RCTs including 390 patients looking at the mean difference in Shannon Index before and after antibiotic exposure. Continuous outcomes were analyzed using an inverse variance model with a 95% CI. Values were reported as mean differences. P-values were two-tailed and statistically significant if p < .05. Statistical heterogeneity quantification was performed using the I2 statistic. Degrees of heterogeneity were defined as none (I2 0–20%), low (I2 25–49%), moderate (I2 50–74.9%) and high (I2 > 75%). When heterogeneity was quantified as low or above, a random-effects model was used. The meta-analysis was performed using review manager (Revman) for MAC (Version 5.3. Copenhagen: The Nordic Cochrane Center. The Cochrane Collaboration, 2014).
Observational study quality (cohort and cross-sectional studies) was assessed using a modified version of the Newcastle–Ottawa scale.30,31 The Newcastle–Ottawa scale is used to assess quality and biases. Points are assigned on a nine-point scale. LM and PW independently assessed quality factors including: i) comparability of exposed and non-exposed groups; ii) evidence of microbiome assessment prior to exposure; iii) record of antibiotic exposure; iv) confounding factors; and v) statistical analysis. RCT quality was assessed using the Cochrane Risk of Bias Tool.28 LM and PW independently applied the risk of bias assessments to each RCT. Disagreement was resolved through discussion.
Additional quality features for RCTs included clear description of inclusion/exclusion criteria and of withdrawals/dropouts.
The primary outcome measure was the change in bacterial composition of the microbiome. This was measured as the changes in microbiome richness, alpha-diversity or taxonomic composition.29,33,35 Secondary outcome measures were beta- and gamma-diversity.29,33,35 Microbiome richness score measures the total number of species found in a single sample. Microbiome alpha-diversity score measures the number of individual bacteria from each of the bacterial species isolated from a single sample. Beta-diversity examines the differences in species composition between 2 samples.29,33,35 Gamma-diversity measures diversity across many samples taking into account the different species found in each sample.35 With regards to change in taxonomic composition, the four main phyla reported were Actinobacteria, Bacteroidetes, Firmicutes and Proteobacteria. The various different indices used by authors to quantify these measures are summarized in Table 6.
| Measures | Definition and example indices |
|---|---|
| Species Richness43 | Total number of bacterial species in sample Example indices: Operational Taxonomic Unit (OTU) count OTUs are organisms defined by similarity in DNA sequences, usually 97% Observed Richness/Richness score Chao 1 score |
| Alpha Diversity | The number of individual bacteria from each bacterial species present in sample Example indices: Shannon Index Simpson Index* Inverse Simpson index* |
| Beta diversity | Difference in microbial composition between two samples Example index: Weighted and unweighted UniFrac distances (a distance metric used for comparing microbial communities)44 |
| Gamma diversity | The overall total species diversity of a range of samples (incorporating the range of different species found in each sample) Example index Simpson’s community-level gamma diversity |
*Simpson’s Index is an inverse scale i.e. the higher the score the lower the diversity. It is therefore often reported as the Inverse Simpson Index so that higher scores indicate higher diversity.
We are grateful to the library staff at King’s College London for their advice on the literature search strategy, and to Dr Iain Marshall for his advice on the quality assessment of included studies.
The authors report no conflicts of interest
LM conceived the research. LM, DA, MA and PW all contributed to the design of the study. LM, AG, VR and TH reviewed the research papers identified at each stage. LM and PW reviewed the quality criteria. LM drafted the paper and all authors contributed to the writing of the paper.
1.
2.
3.
4.
5.
6.
7.
8.
9.
10.
11.
12.
13.
14.
15.
16.
17.
18.
19.
20.
21.
22.
23.
24.
25.
26.
27.
28.
29.
30.
31.
32.
33.
34.
35.
36.
37.
38.
39.
40.
41.
42.
43.
44.
45.
46.
47.
48.
49.
50.
51.
 Association between antibiotics and gut microbiome dysbiosis in children: systematic review and meta-analysis
 Facebook
 Twitter
 Linkedin
 Whatsapp

