 Allosteric interactions in the parathyroid hormone GPCR–arrestin complex formation
Nature chemical biology

Author contributions. L.J.C. performed and analyzed NMR studies with V.B. and P.T., and MD simulations with J.K., P.D., and I.B. J.Y.L. performed ANM calculations. A.D.W. performed signaling studies. T.B. and I.C. generated arrestin mutants and developed photo-crosslinking assays. I.S., F.J.-A., S.L., F.F., and H.X optimized and performed photo-crosslinking coupled to MS assays. I.S. designed and optimized purification for the PTH(1–34) construct. T.J.G. provided guidance for radioligand binding studies. J.P.V. was responsible for the overall conceptual composition and supervision of the study in collaboration with I.B, and wrote the manuscript with L.J.C. and I.S.
Contributed equally to this study.

- Altmetric
Peptide ligands of class B G protein-coupled receptors (GPCRs) act via a two-step binding process, but the essential mechanisms that link their extracellular binding to intracellular receptor–arrestin interactions are not fully understood. Using NMR, crosslinking coupled to mass spectrometry, signaling experiments, and computational approaches on the parathyroid hormone (PTH) type 1 receptor (PTHR), we show that initial binding of the PTH C-terminal part constrains the conformation of the flexible PTH N-terminal signaling epitope before a second binding event occurs. A “hot spot” PTH residue, His9, that inserts into the PTHR transmembrane domain at this second step allosterically engages receptor–arrestin coupling. A conformational change in PTHR intracellular loop 3 permits favorable interactions with β-arrestin’s finger loop. These results unveil structural determinants for PTHR–arrestin complex formation and reveal that the two-step binding mechanism proceeds via cooperative fluctuations between ligand and receptor, which extend to other class B GPCRs.
Introduction
The PTHR is a prototypical member of GPCR class B, which includes receptors for many medically important peptide hormones (e.g., secretin, vasoactive intestinal peptide, glucagon, glucagon-like peptide, calcitonin, corticotropin-releasing factor, gastric inhibitory peptide, growth hormone-releasing hormone, pituitary adenylate cyclase-activating peptide) regulating vital functions in human body systems (e.g., skeletal, endocrine, gastrointestinal, cardiovascular). Class B GPCR peptide ligands consist of two common structural components, each with a distinct role: the more structured (α-helical) C-terminal part is critical for binding to the large N-terminal extracellular domain (ECD) of the receptor, and the more flexible N-terminal part of the ligand inserts into the receptor’s transmembrane (TM) domain (TMD) and is critical for engaging signaling via G proteins and β-arrestins1,2. The kinetics of this two-step binding process were initially analyzed for PTH(1–34)3, the fully functional N-terminal fragment of PTH that is currently used to treat osteoporosis4,5. Fluorescence resonance energy transfer (FRET) experiments indicated that in the first step, the C-terminal part of PTH(1–34) (i.e., residues 16–34) binds to the ECD with fast kinetics (time constant ≈ 140 ms); in the second step, the PTH N-terminal part (residues 1–15) binds to the TMD with slower kinetics (time constant ≈ 1 s)3. This two-step mechanism has been extended to other class B GPCRs, supported structurally through the crystal structures of class B GPCR ECDs in complex with peptide C-terminal helices as well as full-length receptor structures in which each peptide is a continuous α-helix1,6. However, once the binding to the receptor N-terminal domain takes place during the first step, how the information is transmitted to trigger the second binding event at the TMD, which, in turn, leads to the intracellular interaction with G proteins and β-arrestins, is largely unknown. Here, we describe how the receptor ECD works to favor the formation of the peptide α-helical structure, which permits optimal insertion of the peptide signaling domain into the receptor’s TMD. This mechanism is changing the view of the classical two-state binding model for class B GPCRs and how PTHR signaling and its coupling to arrestin occur.
Results
Effects of PTHRECD on PTH(1–34) conformation.
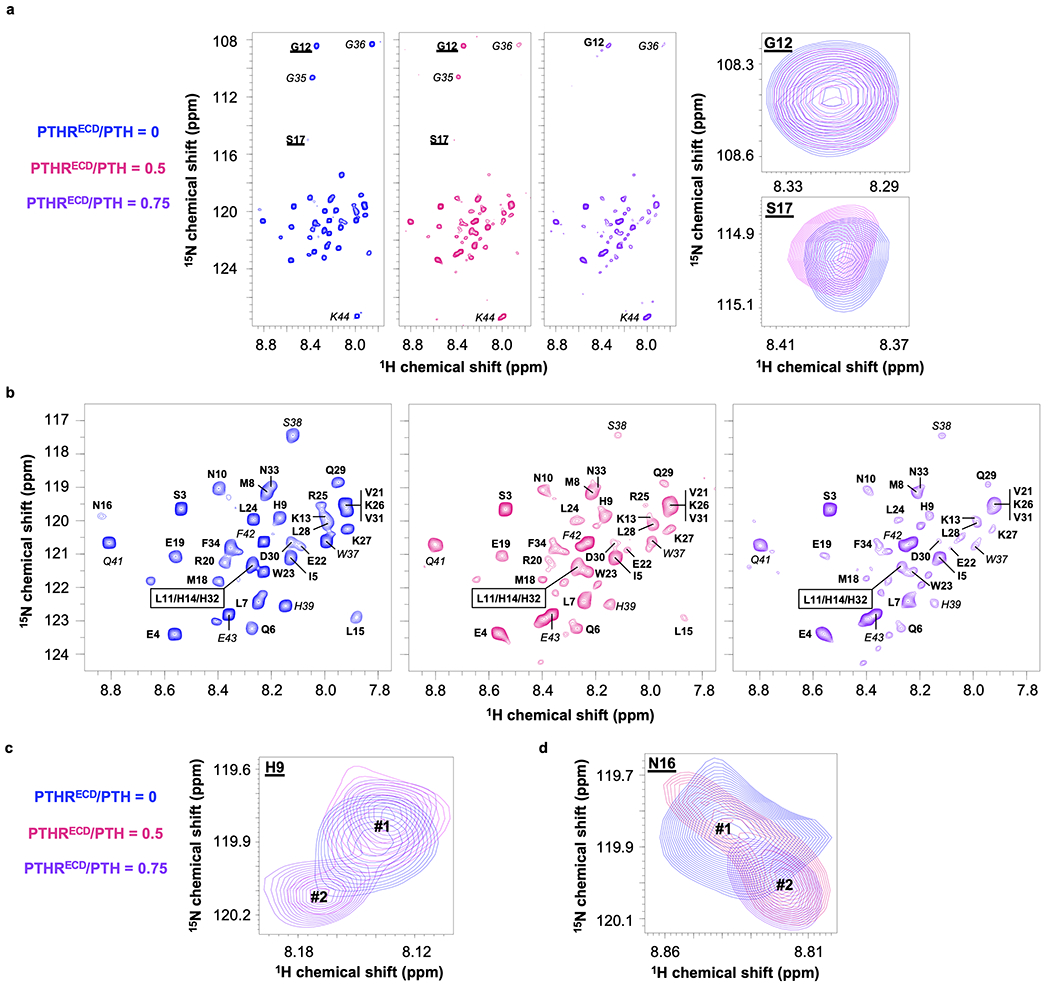
We tested the hypothesis that the initial binding of the PTH C-terminal part (residues 16–34) to the receptor ECD (PTHRECD) induces a conformational change within its N-terminal part (residues 1–15), which facilitates its engagement with the receptor TMD (PTHRTMD) during the second binding step3. To this end, we collected two-dimensional 1H-15N transverse relaxation optimized spectroscopy (TROSY) nuclear magnetic resonance (NMR) spectra of purified and fully functional 15N-labeled PTH(1–34) in the absence and presence of a submolar ratio of unlabeled PTHRECD (Fig. 1a, Extended Data Fig. 1, and Supplementary Fig. 1). To promote folding and facilitate purification, PTHRECD was expressed and purified as PTHR(29–187) with an N-terminal maltose-binding protein fusion, as previously described7.
Binding of 15N-PTH to PTHRECD significantly reduces the peptide’s molecular tumbling, thus decreasing NMR peak intensity as measured by peak height (Extended Data Fig. 2a). To quantitatively account for these changes, the peak intensity for each PTH residue was normalized with respect to that of PTH Ser3, which did not change significantly in the presence of PTHRECD (Fig. 1a, b, orange bar). In these experiments, PTH residues that experience reduced mobility upon binding to PTHRECD, either through direct interactions with PTHRECD or through induced conformational changes, show a relatively larger reduction in peak intensities. The extent of reduced mobility for a residue is estimated by calculating the ratio of peak intensities in the presence and absence of PTHRECD (Ibound/Ifree, Fig. 1b, d). In addition, the change in chemical shift upon addition of PTHRECD (i.e., chemical shift perturbation, Δδ) estimates the relative modification of that residue’s chemical environment upon binding to PTHRECD (Fig. 1c, e) (see Methods). The overall trends of Ibound/Ifree and chemical shift perturbation with 0.5 molar ratio PTHRECD (Fig. 1b–e) were mirrored in NMR data collected in the presence of 0.75 molar ratio PTHRECD, thus indicating that an increased concentration of PTH–PTHRECD complex did not alter how PTH interacts with PTHRECD (Extended Data Fig. 2b, c). Note that PTH residues 15–17 at 0.75 PTHRECD/PTH molar ratio were not included in the quantitative data analysis because of their extremely weak NMR signal (Extended Data Fig. 1, 2).
In the previously reported NMR structural ensemble of free PTH(1–34) (PDB 1ZWA)8, residues Glu19–Asp30 form an α-helix, and a stable helical turn is detected at Gln6–His9, while the other regions of the peptide are highly flexible. The C-terminal residues Glu19–Asp30 generally exhibit small Ibound/Ifree values and modest changes in chemical shifts, suggesting that this region interacts with PTHRECD and maintains its helical structure (Fig. 1b, c and Extended Data Fig. 2b, c) as seen in the crystal structure of PTHRECD bound to PTH(15–34) (PDB 3C4M)7. Glu22 (Fig. 1c, red bar) exhibits a large shift, suggesting a change in chemical environment. Based on the structures of PTH in free (PDB 1ZWA) and bound (PDB 3C4M) states, this shift may be caused by breaking an ionic interaction between Glu22 and Arg25 upon PTHRECD binding7,8, as Arg25 interacts with the main chain carbonyl of PTHR stalk residue Leu1747. Changes in position/orientation of nearby Met18, Val21, and Trp23 side chains may also account for the large chemical shift perturbation. However, the chemical environment of Glu22 does not result in a significant change in its mobility (Fig. 1b, green bar), as the Glu22 sidechain is still facing solvent after PTH binding7,8. Leu28 also retains its mobility after PTH binding to PTHRECD (Fig. 1b, green bar). Hydrophobic Leu28 faces the PTHRECD in the PTH–PTHRECD structure, but these interactions may not significantly change Leu28 mobility, as Leu28 is α-helical in both free and bound forms7,8.
PTH Ser17 stands out as having an Ibound/Ifree ratio close to 1 (Fig. 1b and Extended Data Figs. 1a and 2b), indicating that its mobility is minimally affected by binding. In the aforementioned NMR ensemble8, Asn16–Met18 participate in the central flexible region that connects the N- and C-terminal portions of the peptide, and the conformational flexibility at this site is largely maintained after binding to PTHRECD, as supported by our NMR data. The mobility of residues His9–Leu15, on the other hand, is dramatically decreased in the presence of PTHRECD. Larger chemical shift perturbations in the same region (except Gly12) are also induced, with His9 experiencing the largest change. These data demonstrate that PTH binding to PTHRECD triggers a distinct and more structured conformation in the N-terminal region of PTH, independent of the interaction with PTHRTMD.
Expanded mechanism of PTH binding to PTHR.
We further investigated the PTH binding mechanism using molecular dynamics (MD) simulations and modeling. Using the 3.0 Å cryo-EM structure of active full-length PTHR bound to the stimulatory G protein (Gs) and a long-acting PTH analog (LA-PTH) (PDB 6NBF)9, we generated models of ligand-free (apo) and PTH-bound PTHR, embedded in a lipid bilayer composed of 75% POPC and 25% cholesterol. POPC is a standard lipid for MD simulations of GPCRs10–12. We included high percentage of cholesterol to mimic the plasma membrane composition13,14. Furthermore, cholesterol is required to stabilize purified GPCRs, including PTHR9. For each model, we performed 200 ns atomistic MD simulations in triplicate. Simulations showed that the PTHRECD mobility was significantly high in the absence of ligand but suppressed upon peptide binding (Fig. 2a, b). Also, the interactions observed between the PTH C-terminal helix and the PTHRECD during the course of simulations mirrored closely those in the PTH(15–34)-bound PTHRECD crystal structure (Supplementary Fig. 2)7. We docked the free PTH conformers observed in the NMR structural ensemble onto PTHRECD based on the position of the C-terminal helix in the PTH(15–34)–PTHRECD crystal structure and determined that PTHRECD must be oriented away from PTHRTMD to permit PTH(16–34) binding while minimizing clashes between PTH(1–15) and extracellular loops 1 and 2 (ECL1, ECL2) of the PTHRTMD (Extended Data Fig. 3).
From these data, along with the NMR results, we propose an expanded two-step model of PTH binding to PTHR (Fig. 2c). First, initial contacts take place between the C-terminal part of PTH and PTHRECD (Fig. 2c, Step 1a). Residues Glu19–Asp30, which preferentially form an α-helix even in isolation, maintain their α-helical state, now further stabilized by interfacial contacts with the PTHRECD and likely extending up to Phe34 (Step 1b in Fig. 2c, and Supplementary Fig. 2), as evidenced by the small Ibound/Ifree values of these residues (Fig. 1). Our NMR data further showed that the flexibilities of residues Gln6–Leu15 decreased in the presence of PTHRECD (Fig. 1b). Since residues Gln6–His9 already form a helical turn in the free peptide (Fig. 1d, e), the helix may propagate to adjacent residues Asn10–Leu15 in the presence of PTHRECD (Fig. 2c, Step 1b). The helix-forming capability of Asn10–Leu15 has been previously demonstrated in the crystal structure of PTH(1–34) (PDB 1ET1)15. Residues Asn10–Lys13 are also α-helical in the NMR structure of PTH(1–34) in the presence of helix-stabilizing 20% trifluoroethanol (PDB 1HPY)8. Although Gly12 experiences small chemical shift perturbation in the presence of PTHRECD (Fig. 1b), it does encounter a significant reduction in peak intensity (Fig. 1b). The small Ibound/Ifree values and relatively large chemical shift perturbations of flanking residues (i.e., His9–Leu11, Lys13–Leu15) suggest that the Gln6–His9 α-helix propagates continuously to Leu15.
The conformational change near His9 could explain the new NMR peak observed in the presence of PTHRECD (Extended Data Fig. 1c). Also, the conformational change in Leu15 could explain the new peak observed at the adjacent residue Asn16 in the presence of PTHRECD (Extended Data Fig. 1d). Next, the relatively loose packing at the interface between the ECD and TMD domains of PTHR, along with the conformational flexibility of the PTH central residues Asn16–Met18, especially Ser17, permits the insertion of the N-terminal helix into the PTHRTMD (Fig. 2c, Step 2a). Ultimately, this step results in a continuous PTH helix that connects PTHRECD and PTHRTMD and can account for the slow kinetics observed in live-cell FRET experiments measuring PTH binding during the second step (Fig. 2c, Step 2b)3.
Hot-spot PTH residue for biased signaling.
Using this binding model as a guide, we sought to investigate the functional role of PTH His9, which experienced the largest chemical shift perturbation among the PTH residues that are interacting with the PTHRTMD (Fig. 1c, e). In our binding model, His9 comes into proximity of PTHR ECL2 (Ala347–Gly357, colored light orange in Fig. 2c) and could assist in positioning the PTH helix within the PTHRTMD to permit receptor activation.
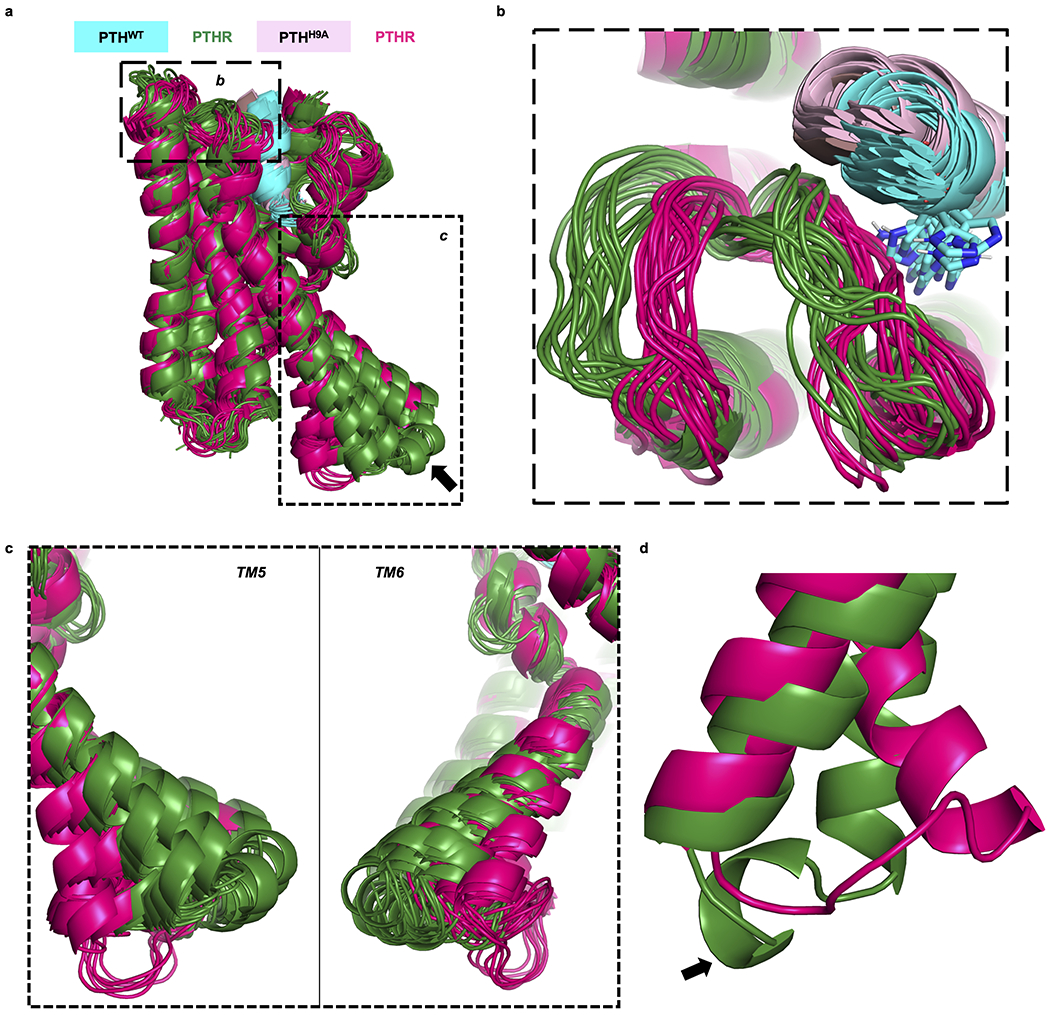
To determine whether the overall PTHR architecture intrinsically favors an allosteric coupling between the PTH binding region and the intracellular region, we performed an anisotropic network model (ANM) analysis on a membrane-embedded PTH–PTHR model16–18. In brief, the ANM provides a unique analytical solution for the spectrum of collective motions intrinsically accessible to each biomolecular system; and among the modes of motions predicted by the ANM, the lowest frequency modes, also called global modes, usually represent the coupled movements of the overall system including allosteric changes in structure, while high frequency modes describe local fluctuations19–21. ANM analysis of the 20 lowest frequency modes of motion of PTH–PTHR in the presence of membrane indeed revealed several modes (modes 3, 4, 8, 14, 16–18, 20 in Supplementary Fig. 3) where the PTH-binding region was coupled to the cytoplasmic ends of PTHRTMD. In particular, modes 3, 14, and 18 were distinguished by large opposite direction fluctuations of TM5/TM6 cytoplasmic ends (and connecting intracellular loop 3, ICL3) relative to the C-terminal helix (referred to as helix 8), in concert with PTHRECD movements that engaged the PTH (see the respective Supplementary Videos 1a–c). The cross-correlation map from one such mode (mode 14) is illustrated in Figure 3a. The map shows which pairs of residues move in a correlated (coupled, same direction; red), anti-correlated (coupled, opposite direction; blue), or uncorrelated/orthogonal (green) manner. To help understand whether structural alterations at PTHR residues near PTH His9 would elicit cooperative responses consistent with PTHR activation, we examined the cross-correlation between PTH His9 and all other residues, as well as that between T392 (at the cytoplasmic end of TM5) and all other residues. The results are displayed by the color-coded PTH-bound structures in Figure 3b. The ECL2 residues (including Leu354), which interact with PTH His9, as well as the region from Ala369 to His442 (indicated by the dashed black curve on the right ribbon diagram) exhibit strong correlations with His9 and Thr392. These results indicate that PTH His9 interactions with PTHR can cooperatively drive a conformational change near Thr392, which would be accompanied by accommodating movements at the adjacent loop ICL3. Also, the C-terminal region Val455–Leu481 (solid blue curve in Fig. 3b) is anticorrelated with Thr392, i.e., these two regions undergo concerted opposite direction (opening/closing) movements, as illustrated in Supplementary Video 1a. This analysis suggests that the opening/closure of the intracellular region is allosterically coupled to the structural changes at residues interacting with His9.
To further determine the role of His9, we assayed the effects of the His9 ➔ Ala point mutation (PTHH9A) for ligand binding affinity and PTHR signaling. Time course recordings of cAMP production in HEK293 cells revealed that PTHH9A, unlike wild-type PTH (PTHWT), did not sustain cAMP signaling after ligand washout (Fig. 3c), which is consistent with the failure of PTHH9A to engage PTHR internalization or coupling to β-arrestin-1/2 (Fig. 3d and Extended Data Fig. 4a, b). No significant differences were detected in the capacities of PTHWT and PTHH9A to bind the G protein-dependent state of PTHR (RG) (Extended Data Fig. 4c, d and Extended Data Table 1)22, which is consistent with the similar transient cAMP production induced by each ligand (Fig. 3c). A significant (P = 0.02) reduction in PTHH9A binding to the G protein-independent state of PTHR (R0)22, a conformation thought to promote β-arrestin coupling23, was also observed. Thus, PTHH9A signals exclusively from the plasma membrane and cannot trigger the previously discovered endosomal PTHR signaling via cAMP23,24. Our data also indicate that the PTH His9 → Ala point mutation stabilizes a distinct receptor conformation that selectively engages acute plasma membrane cAMP signals while preventing endosomal cAMP signaling.
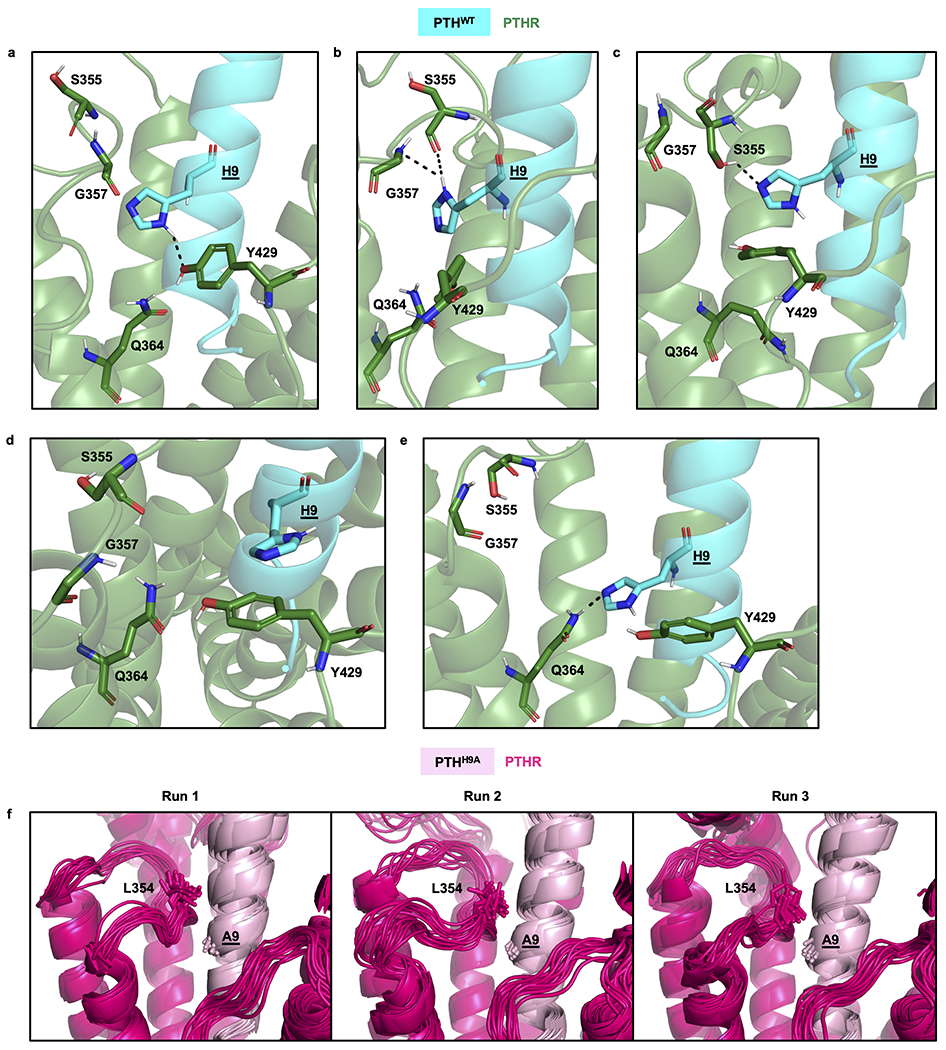
To discover structural signatures of PTHH9A-stabilized receptor, we also performed 200 ns MD simulations of PTHH9A-bound PTHR in triplicate and compared them to those of PTHWT-bound PTHR. During the simulations of PTHWT-bound PTHR, His9 formed polar interactions with multiple PTHR residues: Ser355 and Gly357 on ECL2, Gln364 on TM helix 5 (TM5), and Tyr429 on ECL3 (Fig. 3e and Extended Data Fig. 5a–e). His9 was also observed to form aromatic-aromatic interactions with Tyr429 on ECL3. In contrast, Ala9 in PTHH9A appears to interact with Leu354 on ECL2 (Fig. 3e and Extended Data Fig. 5f), leading to a distinct ECL2 conformation (Extended Data Fig. 6a, b) and a bending of the PTHH9A peptide toward TM2 (Supplementary Fig. 4a). As a result, PTHH9A shifts the overall position of PTHRECD relative to PTHRTMD such that PTHRECD α1-helix is further away from ECL2 (Supplementary Fig. 4b). Therefore, we predict that the extensive interactions between His9 and PTHR are critical for properly positioning the PTH peptide within the PTHRTMD.
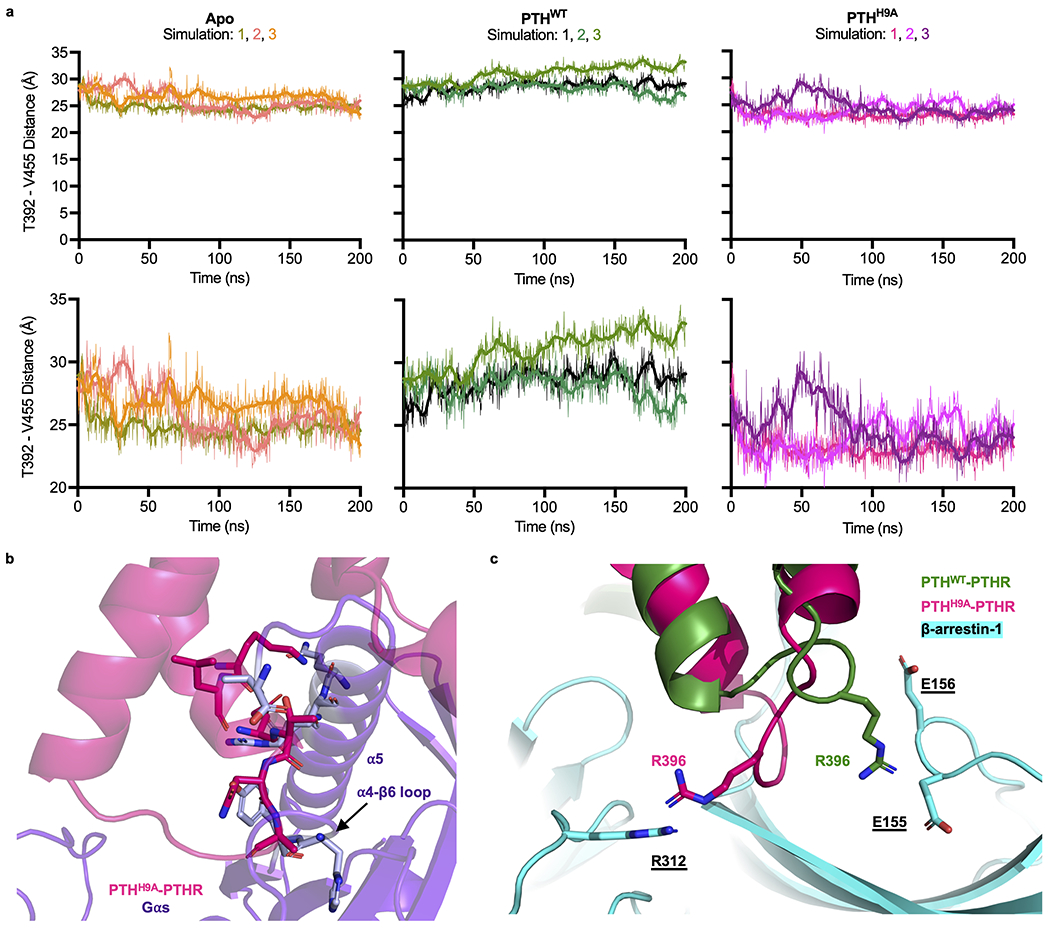
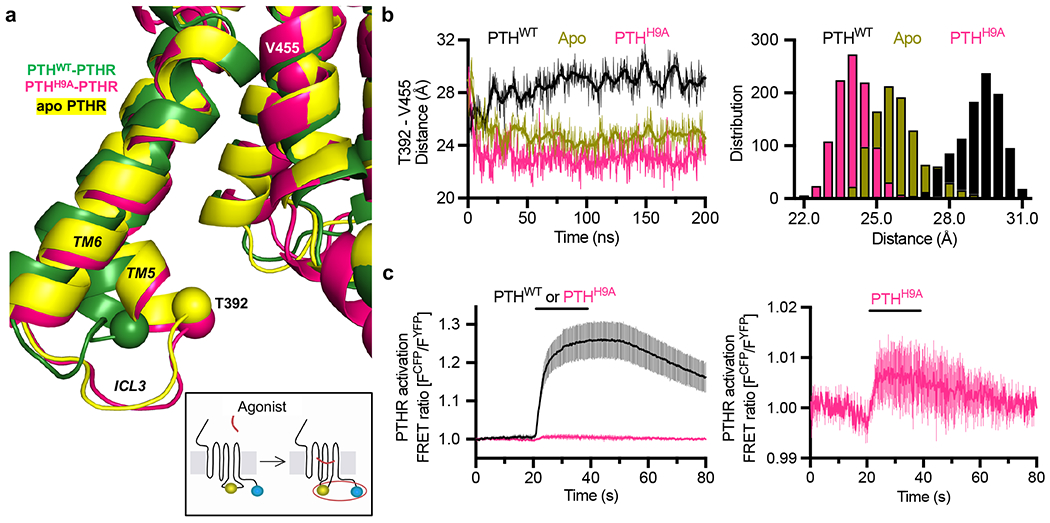
Remarkably, PTHH9A stabilized an inward kink in the cytosolic extension of TM5 (residues V3825.58–T3925.68, referred to as ‘kink 5’, Fig. 4a), which is correlated with a slightly inward movement of TM6 in MD trajectories (Extended Data Fig. 6c). Also present in the apo PTHR simulations, kink 5 is further predicted to be stabilized by PTHH9A as evidenced by calculating the distances between the Cα atoms of Thr3925.68 (in kink 5) and Val4557.53 (in TM7; serving as reference as a residue with minimal displacements between PTHWT- and PTHH9A-bound PTHR) throughout the simulations (Fig. 4a, b and Extended Data Fig. 7a). Kink 5 also promoted the unraveling of the helical residues 394–397 in ICL3 and an inward movement of the loop (Extended Data Fig. 6d).
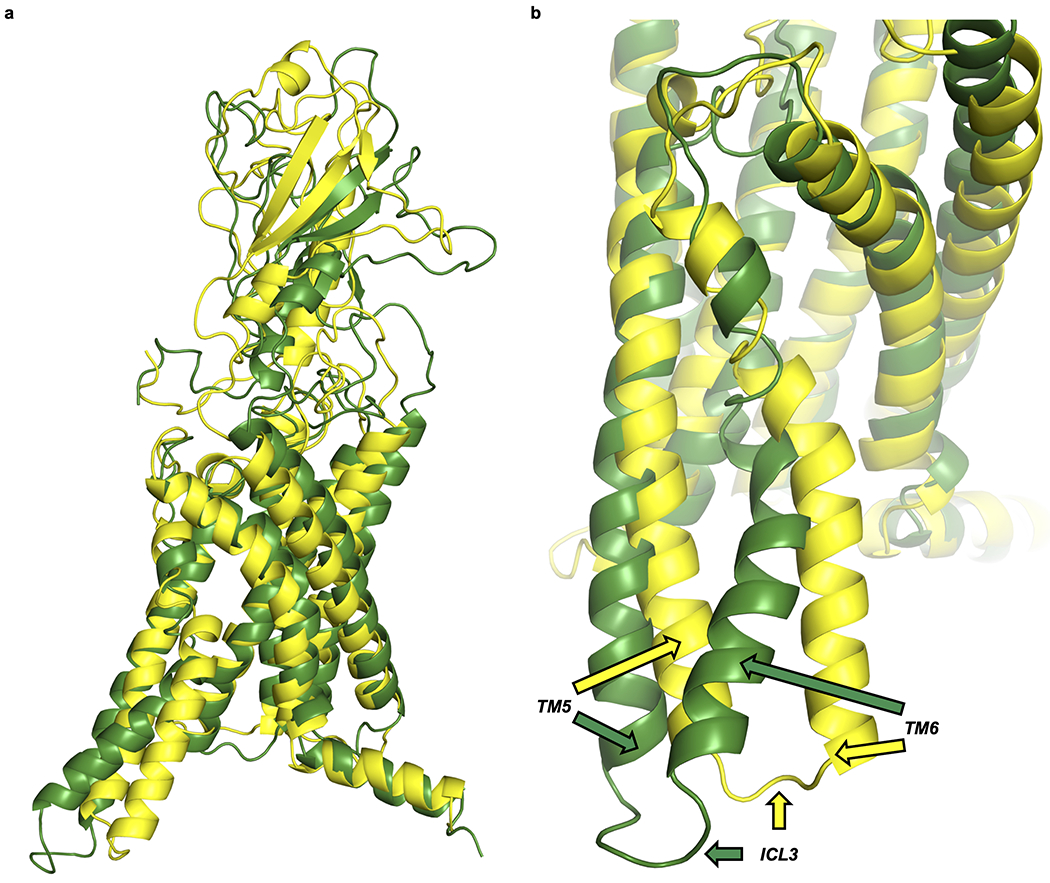
All unbiased simulations began with PTHR in an active conformation, as the LA-PTH–PTHR–Gs structure was used as a template to generate initial models9. This structure was a more favorable starting point than the inactive crystal structure of PTHR25, which contained several thermostabilizing mutations and a 196-residue Pyrococcus abysii glycogen synthase fusion to ICL3 that promoted the crystallization of an inactive conformation24,25. While the inward movement of ICL3 in apo and PTHH9A-bound PTHR simulations could be viewed as a first step toward transitioning to inactive state, the outward position of TM6, a signature of class B GPCRs in the active state, was maintained in these simulations. Previous studies with specialized hardware showed that unbiased MD simulations starting from the active state would require tens of microseconds to simulate the transition to the active state26. In order to possibly observe conformational changes toward the inactive state, we carried out an additional 100 ns accelerated MD (aMD) run of apo PTHR. The lower energy barriers between side chain rotational isomeric states help accelerate the sampling of conformational transitions27,28. This additional run revealed the high mobilities of TM5 and TM6, as well as the connecting loop ICL3 (Extended Data Fig. 8). However, the observed TM6 conformations differed from that of the inactive PTHR structure25. These results confirm that the simulations of the active-to-inactive transition in GPCRs is beyond the reach of conventional MD, and requires specialized hardware or adoption of adaptive/biased sampling methods, as performed in recent studies of β2 adrenergic receptor and apo adenosine receptor29,30 or earlier ANM-guided simulations of rhodopsin photoactivation31.
The unique PTHR conformation stabilized by PTHH9A according to unbiased MD was supported experimentally using a FRET-based PTHR sensor, PTHRCFP/YFP, which specifically reports intramolecular conformational rearrangements of ICL3 via FRET changes32. As previously reported32, a short perfusion of PTHWT to cells expressing PTHRCFP/YFP induced a rapid decline of FRET signal (corresponding to an increased FRET emission intensity ratio, FCFP/FYFP) that persisted even after washout of the ligand (Fig. 4c). These data reflect the stabilization of the active PTHR conformation by PTHWT, which involves an ICL3 conformation outward from the cytoplasmic receptor core. Since stabilization of kink 5 by PTHH9A moved ICL3 inward, PTHH9A did not induce a significant change in FRET ratio (Fig. 4c). Given that PTHH9A changed the FRET ratio slightly (Fig. 4c, right panel) and maintained Gs signaling at the plasma membrane, we conclude that PTHH9A induces a unique receptor conformation instead of merely stabilizing the apo state. When the TMD of the PTHH9A–PTHR complex stabilized after 200 ns simulation was aligned with the structurally resolved TMD from the PTHR–Gs cryo-EM structure, the kink 5/ICL3 region was observed to clash with the Gs α5 helix and α4-β6 loop (Extended Data Fig. 7b), suggesting that the interactions of the PTHR with Gs would be disrupted upon complexation with PTHH9A, consistent with the small reduction of acute cAMP in response to PTHH9A (Fig. 3c).
Mechanism of deficient β-arrestin recruitment by PTHH9A.
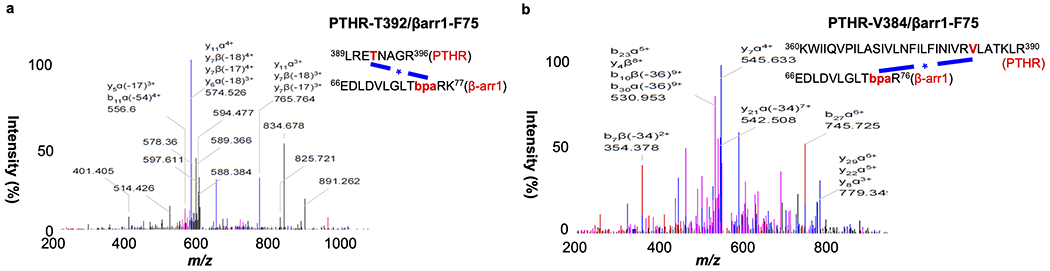
To determine the cause of deficient β-arrestin recruitment in response to PTHH9A, we first sought to identify contacts between PTHWT-activated receptor and β-arrestin using photo-crosslinking coupled to mass spectrometry (MS) experiments. Although we used β-arrestin-1 in these experiments, class B GPCRs have similar affinities to both β-arrestin isoforms33. We selected five residues located in the β-arrestin-1 finger loop that were in close proximity to bound vasopressin receptor-2 phosphopeptide (PDB 4JQI)34. In the crystal structure of rhodopsin bound to mouse visual arrestin-1 (PDB 4ZWJ)35, the finger loop interacts with the receptor residues located in TM5 and TM6. Hemagglutinin (HA)-tagged β-arrestin-1 constructs in which these residues were individually substituted with UV-crosslinkable p-benzoyl-L-phenylalanine (Bpa) were tested for its ability to crosslink with PTHR transiently expressed in HEK293 cells36. After photoactivation, β-arrestin-1 was pulled down via co-immunoprecipitation, and the sample was subjected to Western blot against the HA tag (Fig. 5a). The Phe75Bpa mutant generated the most PTHR–β-arrestin-1 complex, as indicated by an intense band at ~180 kDa on the Western blot. In contrast, a photo-crosslinked band was not visible in the PTHR sample stimulated with PTHH9A (Fig. 5b–d), which supported the previously determined lack of β-arrestin recruitment (Fig. 3d and Extended Data Fig. 4a, b). In time course experiments (Fig. 5c, d), the extent of photo-crosslinking between PTHR and β-arrestin-1 Phe75Bpa increased with the time of photoactivation post PTHWT stimulation, from when receptor is at the plasma membrane (t = 1 min) to when receptor is internalized into endosomes (t = 15 min).
To identify the residues of PTHR interacting with Phe75 of β-arrestin-1, the PTHWT-induced PTHR–β-arrestin-1 SDS-PAGE band was digested and subjected to liquid chromatography coupled to tandem MS (LC/MS-MS) (Fig. 5a and Extended Data Fig. 9). The MS analysis identified crosslinks between β-arrestin-1 Phe75Bpa and PTHR residues Val3845.64 and Thr3925.71 (Extended Data Fig. 9). Val3845.64 and Thr3925.71 are located at the cytoplasmic end of TM5 (at the above-mentioned kink 5 region), supporting a conformation in which the β-arrestin-1 finger loop is engaging with the receptor cytosolic core. We investigated these identified interactions by structurally aligning the TMD of PTHWT–PTHR complex observed after 200 ns simulation with the TMD of rhodopsin from the rhodopsin/arrestin crystal structure35. Next, we generated a homology model of β-arrestin-1 in the receptor core conformation using the visual arrestin-1 structure34,37. Finally, this β-arrestin-1 model was aligned with visual arrestin-1. Distances between PTHR side chains Val3845.64 and Thr3925.71 and β-arrestin-1 Phe75 Cα were 13.8 Å and 8.1 Å, respectively (Fig. 5e), which were compatible with Bpa photo-crosslinking36. We aligned the last PTHH9A–PTHR snapshot against that of PTHWT–PTHR, and ICL3 clashed with β-arrestin-1, including Thr3925.71 with Phe75 Cα (Fig. 5f). In our models, ICL3 Arg3965.75 in PTHWT-bound receptor interacted ionically with Glu155 and Glu156 in β-arrestin-1 (Extended Data Fig. 7c). In PTHH9A-bound receptor, Arg3965.75 was instead near Arg312 of β-arrestin-1 and could cause additional repulsion between PTHR and β-arrestin-1.
Discussion
This study proposes an updated two-step mechanism of PTH binding to PTHR that could serve as a model for class B GPCRs. We utilized a combination of NMR experiments and MD simulations to describe how the initial binding of the PTH C-terminal part to PTHRECD increases structural rigidity to the PTH N-terminal part independently from interactions with PTHRTMD. We predict that these changes prime the interactions between the PTH N-terminal portion and PTHRTMD that stabilize the active receptor conformation given that N-terminal PTH residues 1–4 are essential to trigger receptor coupling to G proteins and activation of cAMP production9,24,38.
We also demonstrate the existence of structure-encoded allosteric coupling between PTHR ECL2 and PTH residue His9 that determines direct interaction between PTHR’s intracellular loop 3 (ICL3) and β-arrestins and duration of cAMP signaling. PTH His9 engages in a network of key contacts with PTHR residues belonging to ECL2, ECL3, and TM5, independently of binding affinity, to trigger PTHR conformational rearrangements in favor of its coupling to β-arrestin. The PTH His9 ➔ Ala point mutant (PTHH9A) peptide lacks these key contacts and is predicted by MD simulations to adopt a distinctive binding pose within PTHRTMD, which ultimately eliminates β-arrestin coupling by stabilizing the inward movement of PTHR ICL3. It appears that the stabilization of a kink in the cytoplasmic extension of TM5 (kink 5) by PTHH9A decreases the exposed area within the receptor cytosolic core for G proteins and β-arrestins to bind. Since the PTHH9A-bound receptor retained Gs signaling but eliminated β-arrestin coupling, the exposure of a suitable binding epitope at the cytoplasmic surface of PTHR may be particularly critical for β-arrestin recruitment. Gs could also be more amenable to conformational changes upon initial clashing with kink 5/ICL3 that permit Gs activation by PTHH9A-bound receptor. This mechanism of reduced β-arrestin signaling may extend to other class B GPCRs, as chemical properties of residues 3825.58–3895.65 in kink 5 are highly conserved amongst class B GPCRs (Supplementary Fig. 5)39. Kink 5 has not been previously observed in structurally resolved class B GPCRs, as these structures are either in the inactive state or in complex with Gs1, which would block the TM5 movement due to inward TM6 movement or Gαs occupation, respectively. In the thermostabilized intermediate state structure of GLP1R20, the cytosolic portion of TM5 is stabilized by contacts with another receptor monomer via crystal packing. Nevertheless, structures containing peptide ligands display stabilization of ECL2 by one or more ligand residues. Mutating the only PTH residue that interacts with ECL2 causes remarkable structural and signaling changes in PTHR.
The connection between PTH interactions with ECL2 and β-arrestin recruitment to PTHR was further strengthened by a recent study identifying a PTHRECD-binding antibody that inhibited β-arrestin-2 coupling40. Hydrogen-deuterium exchange-MS experiments suggested this antibody primarily binds to the α1-helix of PTHRECD 40. Potentially, antibody binding to α1-helix could alter the conformation of nearby ECL2 to more closely resemble that of PTHH9A-stabilized receptor (Supplementary Fig. 4b), thus leading to conformational changes in the receptor intracellular region that would prevent β-arrestin-2 interaction.
In summary, we utilized a combination of NMR experiments and MD simulations to propose an updated two-step mechanism of PTH binding to PTHR that could serve as a model for class B GPCRs. We determined that binding of the PTH C-terminal part to the PTHRECD restricts the mobility accessible to the PTH N-terminal part in favor of the formation (or propagation) of an α-helical structure, which permits optimal insertion of the PTH signaling domain into the PTHRTMD. PTH His9 engages in a network of key contacts with PTHR residues belonging to ECL2, ECL3, and TM5, independently of binding affinity, to trigger PTHR conformational rearrangements in favor of its coupling to β-arrestin. The existence of a structure-encoded allosteric coupling between PTHR residues near PTH His9 and the cytosolic ends of TM5 and TM6 (and connecting loop ICL3) is shown by the ANM analysis. The PTH His9 ➔ Ala point mutant (PTHH9A) peptide lacks these key contacts and is predicted by MD simulations to adopt a distinctive binding pose within PTHRTMD, which ultimately eliminates β-arrestin coupling by stabilizing the inward movement of PTHR ICL3. Such observations will advance the development of therapeutic biased ligands for PTHR.
Online Methods
Cell culture and transfection.
Cell culture reagents were obtained from Corning (CellGro). Human embryonic kidney (HEK293; ATCC, Georgetown, DC) cells stably expressing the recombinant human PTHR were grown in selection medium (DMEM, 5% FBS, penicillin/streptomycin 5%, 500 μg/ml neomycin) at 37°C in a humidified atmosphere containing 5% CO2. For transient expression, cells were seeded on glass coverslips coated with poly-D-lysine in six-well plates and cultured for 24 hours prior to transfection with the appropriate cDNAs using Fugene-6 (Promega) or Lipofectamine 3000 (Life Technologies) for 48–72 h before experiments. We optimized expression conditions to ensure the expression of fluorescently labeled proteins was similar in examined cells by performing experiments in cells displaying comparable fluorescence levels.
Peptides and chemicals.
PTH(1–34) was synthesized and characterized as previously described41. PTH(1–34)H9A was synthesized by LifeTein and received in lyophilized form. PTHH9A was resuspended in 10 mM acetic acid to make 1 mM peptide aliquots. Forskolin (#344270) was purchased from EMD-Millipore.
Protein expression and purification.
15N-PTH(1–34). We expressed 15N-PTH(1–34) in E. coli as a construct containing an N-terminal maltose binding protein (MBP) and a C-terminal Strep-tag plus glycine linker (GGWSHPQFEK) to enhance protein stability and purification. Culture was grown in Luria Broth at 37°C, 220 rpm, until OD600 ~ 0.6 and then was centrifuged at 900xg, 15 min. Pellets were gently washed with M9 media without glucose or (15NH4)2SO4 and centrifuged at 900xg, 15 min. Cell pellets were resuspended in M9 media (500 mL M9 media per 2 L LB culture) and incubated for 30 min at 37°C. Temperature was reduced to 18°C, and expression of 15N-MBP-PTH was induced with 0.8 mM IPTG 30 min later. Culture was grown overnight at 18°C, 220 rpm. M9 media consists of 7 g/L Na2HPO4, 3 g/L KH2PO4, 0.5 g/L NaCl, 1 g/L (15NH4)2SO4, 10 g/L glucose, 1 mM MgSO4, 0.1 mM CaCl2, 50 mg/L thiamine, and ~4 mg/L FeCl3.
Harvested cells were resuspended in buffer consisting of 20 mM Tris pH 8.0, 200 mM NaCl, 1 mM EDTA, and 1X Protease Inhibitor Cocktail. Cells were lysed via sonication, and supernatant was isolated via ultracentrifugation. Supernatant was subjected to multiple rounds of amylose resin purification using a wash buffer of 20 mM Tris pH 8.0, 200 mM NaCl, 1 mM EDTA, and 1X Protease Inhibitor Cocktail. MBP-PTH(1–34) was eluted in 25 mM HEPES pH 7.5, 50 mM NaCl, 2 mM CaCl2, and 10 mM maltose. Amylose eluate was concentrated to >1 mg/mL, and Tween 20 was added to 0.1%. To cleave MBP from PTH(1–34), 0.4 μg enterokinase (BioVision) per mg protein was added to the sample, and sample was rotated at room temperature for 20 hr. To separate cleaved MBP from PTH(1–34), sample was purified via 5 mL StrepTrap HP (GE), using a wash buffer of 25 mM HEPES 7.5, 150 mM NaCl, 1 mM CaCl2. PTH(1–34) was eluted using wash buffer plus 2.5 mM D-desthiobiotin (Sigma Aldrich). Eluate was pooled and concentrated using 3 kDa MWCO Amicon Ultra centrifugal filter (EMD Millipore) prior to size exclusion chromatography (Superdex Peptide 10/300, GE). After SDS-PAGE analysis, pure fractions were pooled, concentrated, and aliquoted. Aliquots were flash frozen in liquid nitrogen and stored at −80 °C. Prior to NMR experiments, some aliquots were thawed, and size exclusion chromatography was performed. Pooled fractions were concentrated to 166 μM.
PTHRECD. We purified PTHR(29–187) (i.e., PTHRECD) N-terminally fused to maltose binding protein (MBP) to enhance protein stability and solubility in detergent-free buffer. This strategy was previously used to determine a crystal structure of PTH(15–34) bound to PTHRECD 7. In brief, MBP-PTHRECD was expressed in E. coli Shuffle cells via induction by 0.4 mM IPTG. Harvested cells were resuspended in buffer consisting of 50 mM Tris pH 8.0, 150 mM NaCl, 5 mM reduced glutathione (GSH), 1 mM glutathione disulfide (GSSG), 10% glycerol, and 2X Protease Inhibitor Cocktail. Cells were lysed via sonication, and supernatant was isolated via ultracentrifugation. MBP-PTHRECD was purified using Ni Sepharose 6 Fast Flow resin, followed by amylose resin, and finishing with size exclusion chromatography (Superose 6 10/300 GL). Prior to NMR experiments, pure fractions were combined and concentrated to 526 μM using 15 kDa MWCO Amicon Ultra centrifugal filter (EMD Millipore).
NMR data acquisition, processing, and analysis.
All NMR samples also contained 6% D2O for deuterium lock and 16 µM DSS (sodium trimethylsilylpropanesulfonate) for chemical shift calibration. NMR experiments were carried out at 10°C using Bruker Avance 700, 800 and 900 NMR spectrometers equipped with a triple-resonance inverse-detection cryoprobe, TCI (Bruker Instruments, Billerica, MA). For assignment of PTH 15N and 1H chemical shifts, two-dimensional (2D) 1H-15N HSQC, 1H homonuclear NOESY and TOCSY, and three-dimensional (3D) 15N-edited NOESY-HSQC were collected. The 1H-15N HSQC spectra were acquired with a spectral width of 12 and 25 ppm in the 1H and 15N dimension, respectively and 2048 (1H) × 256 (15N) total data points. The 2D NOESY and TOCSY spectra were recorded at the 1H resonance frequency of 800.3 MHz using 2048 × 400 data points and a spectral window of 11 ppm in both 1H direct and indirect dimensions. 3D 15N-edited NOESY was collected at 700.13 MHz with a spectral width of 12 (1H) × 25 (15N) × 12 (1H) ppm and 2048 (1H) × 48 (15N) × 128 (1H) data points. A mixing time was set at 200 ms in the 2D and 3D NOESY experiments. A relaxation delay of 1 s was used in all NMR experiments.
For the PTHRECD/15N-PTH titration experiment, 2D 1H-15N TROSY-HSQC spectra were acquired at 900 MHz with a spectral window of 12 ppm for 1H and 25 ppm for 15N and 2048 (1H) × 256 (15N) data points. The receptor-to-peptide molar ratios of 0, 0.1, 0.25, 0.5 and 0.75 were used with increased numbers of scans 12, 12, 24, 36, and 72, respectively, to compensate the loss of peak intensities. A relaxation delay of 1 s was set in all NMR experiments.
The NMR data were processed using NMRPipe 9.6 and NMRDraw 9.642. The NMR spectra analysis was performed in CcpNmr43. The 1H and 15N chemical shift assignment was completed for all PTH residues except Ser1 and Val2. Assignment was carried out manually based on chemical shift connectivity using the acquired NMR spectra (Supplementary Fig. 6 and Supplementary Table 1). The previously published 1H chemical shifts of PTH(1–34) at pH 6.8 and 5°C were also used as a guide8. Titration TROSY spectra with 0.5 and 0.75 of PTHRECD/15N-PTH molar ratios generated more observable changes in peak intensity (peak height) and chemical shift. The peak intensity in these spectra was normalized by Ser3 intensity prior to calculation of Ibound/Ifree for each residue. Chemical shift perturbation () for each residue was calculated via the equation:
These data were analyzed and plotted in GraphPad Prism (version 8, version 8 for Mac, GraphPad Software, La Jolla California USA). PTH structures were colored according to Ibound/Ifree and chemical shift perturbation values in PyMOL (Version 2.1, Schrödinger) (Fig. 1d, e and Supplementary Fig. 2a, b).
MD simulations.
System preparation.
The 3.0 Å cryo-EM structure of LA-PTH–PTHR–Gs–Nb35 complex (PDB 6NBF)9 was used to generate initial PTHR models. I-TASSER was then used to model flexible loops absent in the cryo-EM structure: ECD residues 56–104, ECL1 residues 247–275, and ICL3 residues 394–39844. In PyMOL, structures of Gs, Nb35, palmitic acid, and cholesterol were removed. The LA-PTH was also removed to generate an initial apo PTHR model. For the PTH-bound model, LA-PTH residues were mutated to the corresponding PTH residues, as necessary, using the PyMOL Mutagenesis Wizard. His9 on PTH was then mutated to alanine using the PyMOL Mutagenesis Wizard to generate the PTHH9A–PTHR model. Each initial model was oriented in a model membrane using the Orientations of Proteins in Membranes (OPM) PPM Server45. Using oriented models, inputs for Nanoscale Molecular Dynamics (NAMD) were generated using CHARMM-GUI Membrane Builder46,47. Disulfide bonds Cys48-Cys117, Cys108-Cys148, Cys131-Cys170, and Cys281-Cys351 were specified to ensure correct formation. A heterogeneous lipid bilayer consisting of 75% POPC and 25% cholesterol was assembled around the receptor model using the Replacement Method. The system was solvated in a box of TIP3P waters, and ions were added to a concentration of 150 mM NaCl using Monte Carlo sampling.
Unbiased MD simulations.
All-atom simulations were performed in triplicate for apo, PTH-bound, and PTHH9A-bound models using NAMD with the CHARMM36m force field48,49. Prior to production simulations, 10,000 steps of conjugate gradient energy minimization were performed followed by 0.675 ns equilibration in which restraints were applied and then slowly released over six steps following the protocol established by the CHARMM-GUI group46. Next, 200 ns production simulation with 2 fs timestep was performed. Non-bonded interactions were cut off at 12.0 Å, and van der Waals force switching was applied between 10.0 Å and 12.0 Å. Langevin dynamics and Langevin piston were used to maintain temperature at 303.15 K and pressure at 1 atm.
Accelerated MD simulations.
Accelerated MD (aMD) simulations was performed using NAMD for apo PTHR27,28,48, starting with the receptor system after equilibration (see above). In NAMD48, aMD was performed in dual boost mode, meaning independent boost potentials were applied to dihedral potential and (Total – dihedral) potential. The threshold energy Ed and acceleration factor αd for the dihedral potential were calculated using the relations Ed = 1.3Vd and αd = 0.06Vd where Vd is dihedral energy. The threshold energy ET-d and acceleration factor αΤ−d for (Total – dihedral) were calculated using ET-d = VT + 0.2 Na and αT-d = 0.2Na where VT is total potential energy, and Na is total number of atoms in the system. All other simulation parameters were the same as in unbiased MD.
MD trajectory analysis.
MD trajectories were analyzed in Visual Molecular Dynamics (VMD) and PyMOL50. PTHR snapshots were aligned using receptor TM helices (PTHRTMD without ECLs or ICLs: residues 180 to 211, 218 to 246, 280 to 311, 317 to 343, 359 to 392, 399 to 425, 435 to 460). RMSD of PTHRECD (residues 27 to 179) and PTHR TM helices were acquired for each trajectory. Distances between PTHR T392 Cα (in kink 5) and Val455 Cα (in TM7) were calculated using the VMD distance.tcl script. Val455 Cα was chosen as a reference atom because it experienced little movement throughout the 200 ns simulation (RMSD = 0.55 Å). RMSD and distance data were analyzed and plotted in GraphPad Prism.
Structural Modeling.
To investigate the position of PTHRECD required for PTH(1–34) binding, we first acquired snapshots every 10 ns from the apo PTHR 200 ns simulation. In PyMOL, the PTH(15–34)–PTHRECD crystal structure (PDB 3C4M)7 was aligned with the PTHRECD of an apo snapshot. Next, residues 19–29 of the PTH(1–34) NMR structural ensemble (PDB 1ZWA)8 were aligned with PTH(19–29) from the crystal structure. The process was repeated for all snapshots. The extent of steric clashes between PTH(1–34) and the receptor were assessed for each snapshot. The apo receptor snapshot and PTH(1–34) NMR structure that generated the least steric clashes between PTH and PTHR were selected to represent initial binding of PTH C-terminal helix to PTHRECD (Step 1a). For Step 1b, the same apo receptor snapshot was used. To model the increased rigidity of PTH residues 19–34, PTH(19–34) from the NMR structure was replaced by PTH(19–34) helix from the crystal structure. Also, the secondary structure of PTH(6–15) was changed to α-helix in PyMOL. To show engagement of PTH N-terminal part with PTHRTMD (Step 2a), we selected an apo receptor snapshot in which PTHRECD is bent down toward PTHRTMD. The PTH model from Step 2a was docked to PTHRECD as described above. For Steps 1b and 2a, the PTH models were minimized using the clean command in PyMOL. The PTH–PTHR models were additionally optimized using sculpting in PyMOL. The Step 2b model (i.e., continuous PTH helix formation) is the snapshot of PTHWT–PTHR after 200 ns simulation.
The models of PTHR bound to Gs were generated in PyMOL using snapshots of PTHWT/PTHH9A–PTHR after 200 ns simulation and the cryo-EM structure of LA-PTH–PTHR–Gs–Nb35 complex (PDB 6NBF)9. Receptor TMDs (residues 180–460) of PTHWT–PTHR and LA-PTH–PTHR were aligned. PTHH9A–PTHR snapshot was then aligned with PTHWT–PTHR.
The model of PTHR bound to β-arrestin-1 was generated using a snapshot of PTHWT–PTHR after 200 ns simulation and the crystal structure of rhodopsin bound to mouse visual arrestin-1 (PDB 4ZWJ)35. PyMOL was used to perform structural, sequence-independent alignment of the TMD of PTHR (residues 180 to 460) to the TMD of rhodopsin (residues 34 to 305, RMSD = 5.193 Å). PTHH9A–PTHR snapshot was then aligned with PTHWT–PTHR. Finally, a homology model of β-arrestin-1 in the receptor core conformation was generated in SWISS-MODEL using the structure of visual arrestin-1 as a template35,37. The β-arrestin-1 model was aligned with visual arrestin-1 in PyMOL.
ANM analysis.
In the ANM, the protein is represented as a network where residues serve as the nodes, the positions of which are identified by those of the α-carbons. We used the 3.0 Å cryo-EM structure of LA-PTH–PTHR–Gs–Nb35 complex (PDB ID 6NBF)9 to generate an initial PTH–PTHR model, composed of a total of 455 residues for receptor and 34 residues for PTH (the same as the initial structure in our MD simulations). We built a membrane using an SC lattice with an edge length of 6.2 Å between nearest neighbors with 5 layers and a circular shape with 100 Å radius from the center of the protein (a total of 3,953 nodes for membrane). The protein was positioned into the membrane using the OPM database45. Our network model (receptor, ligand and membrane) had a total of N = 4,442 nodes and 3N-6 (13,320) normal modes that form a complete basis set for all possible motions of the 3N-dimensional structure. The overall potential is represented as the sum of harmonic potentials between pairs of nodes within an interaction range (Cα-Cα distance <15Å). The spring constants for the 3N × 3N interactions (N nodes in 3D) are given by the elements of the Hessian matrix H. The inverse H−1 is proportional to the covariance matrix C. i.e. the cross-correlations between residue fluctuations away from their mean position. C can be written as a sum of correlations contributed by normal modes which are calculated by eigenvalue decomposition of H. Fig. 3a displays the normalized correlation matrix corresponding to mode 14, evaluated by dividing the off-diagonal elements of C by the corresponding diagonal elements. Individual rows or columns corresponding to PTH residue H9 or PTHR residue T392 were extracted from this matrix and equivalent ones for other modes to produce the colored structures in Fig. 3a and plots in Supplementary Fig. 3. To generate a conformation along a given ANM mode k, we use the following equation: R(k) = R (0) ± sλk−1/2 uk, where R0 is a 3N-dimensional vector representing initial coordinates, λk is the eigenvalue for mode k, and uk is the corresponding eigenvector. In Supplementary Videos 1a–c, we choose s such that RMSD from the original conformer remained less than 4 Å. All computations were performed using the ProDy API16,51.
Immunoprecipitation and Western blots.
HEK293 cells stably expressing hemagglutinin (HA)-tagged PTHR and cultured on a 10-cm dish were stimulated with PTH(1–34)-NH2 or analogues at 100 nM for 5 min. Cells were then washed with ice-cold PBS prior to crosslinking for 2 h with dithiobis (succinimidyl propionate) DSP (Covachem, #13301) in PBS at 4 °C. The reaction was stopped by addition of 10 mM Tris–HCl for 10 min and cell lysates were prepared using lysis buffer (1% Triton X-100, 50 mM Tris–HCl pH 7.4, 140 mM NaCl, 0.5 mM EDTA) containing protease and phosphatase inhibitors (Roche, #11873580001). Protein concentration was determined using BCA protein assay kit (ThermoFisher, #23225), and lysates were incubated with anti-HA agarose antibody beads (Sigma-Aldrich; #A2095 clone HA-7) overnight at 4 °C. Elution was done using LDS loading buffer (Life Technologies) and samples were loaded on 10% SDS-PAGE and transferred to nitrocellulose membrane. We used primary antibodies against HA (Covance, clone 16B12, Mouse IgG1) and β-arrestin1/2 (Cell Signaling; #4674, clone D24H9, Rabbit IgG); anti-Mouse HRP and anti-Rabbit HRP (Dako, Goat polyclonal) secondary antibodies were then used. Immunoreactive bands were visualized with Luminata Forte (EMD Millipore) and autoradiography film.
Radioligand binding.
Data are the average of n = 4 to 5 independent assays. Each assay consists of 11 analog concentrations per analog, with duplicate wells for each concentration point. Binding to the RG and R0 conformations of the human PTH1R was assessed by competition reactions performed in 96-well plates by using transiently transfected COS-7 cell membranes as previously described22,52. In brief, binding to R0 was assessed by using 125I-PTH(1–34) as tracer radioligand and including GTPγS in the reaction (1 × 10⁻⁵ M). Binding to RG was assessed by using membranes containing a high-affinity, negative-dominant GαS subunit (GαS ND)53, and 125I-M-PTH(1–15) as tracer radioligand.
Time-course measurements of cAMP production, and PTHR recruitment of β-arrestin in live cells.
Cyclic AMP was assessed using FRET-based assays. Cells were transiently transfected with the FRET-based biosensors, Epac1-CFP/YFP54 for measuring cAMP and PTHR-CFP with βarr2-YFP for measuring arrestin recruitment. Measurements were performed and analyzed as previously described41. In brief, cells plated on poly-D-lysine coated glass coverslips were mounted in Attofluor cell chambers (Life Technologies), maintained in Hepes buffer containing 150 mM NaCl, 20 mM Hepes, 2.5 mM KCl and 0.1–10 mM CaCl2, 0.1% BSA, pH 7.4, and transferred on the Nikon Ti-E equipped with an oil immersion 40X N.A 1.30 Plan Apo objective and a moving stage (Nikon Corporation). CFP and YFP were excited using a mercury lamp. Fluorescence emissions were filtered using a 480 ± 20 nm (CFP) and 535 ± 15 nm (YFP) filter set and collected simultaneously with a LUCAS EMCCD camera (Andor Technology) using a DualView 2 (Photometrics) with a beam splitter dichroic long pass of 505 nm. Fluorescence data were extracted from single cell using Nikon Element Software (Nikon Corporation). The FRET ratio for single cells was calculated and corrected as previously described41. Individual cells were perfused with buffer or with the ligand for the time indicated by the horizontal bar.
Receptor internalization/recycling.
Live-imaging trafficking of SEP-PTHR was done using a Nikon A1 confocal microscope as previously described55. Briefly, HEK293 cells stably expressing a pH-sensitive GFP variant, pHluorin, inserted in the N-terminal domain of the human PTHR (SEP-PTHR) were seeded on glass coverslips coated with Poly-Lysine D (Sigma #P7280) for 24 hours. Experiments were carried out at 37 °C in FRET buffer used for cAMP experiments. Cells were stimulated by the ligand for 10 minutes then washed out to allow recycling. Images were acquired every 30 sec.
Photometric FRET recordings of receptor activation kinetics.
FRET experiments were performed as previously described41. In brief, cells grown on glass coverslips were maintained in buffer A (137 mM NaCl, 5 mM KCl, 1 mM MgCl2, 20 mM HEPES, pH 7.4) at room temperature and placed on a Zeiss inverted microscope (Axiovert 200) equipped with an oil immersion X100 objective and a dual emission photometric system (Till Photonics, Germany). Cells were excited with light from a polychrome V (Till Photonics). To minimize photobleaching, the illumination time was set to 5–15 ms applied with a frequency between 1 and 75 Hz.
For receptor activation, individual cells were perfused with buffer or with the ligand for the time indicated by the horizontal bar. The emission fluorescence intensities were determined at 535±15 and 480±20nm (beam splitter dichroic long-pass (DCLP) 505 nm) upon excitation at 436±10 nm (DCLP 460 nm) and were corrected for the spillover of CFP into the 535-nm channel, the spillover of YFP into the 480-nm channel, and the direct YFP excitation to give a corrected FRET emission ratio FCFP/FYFP. Changes in fluorescence emissions due to photobleaching were systematically subtracted.
Statistical analysis.
Data were processed using Excel 2013 (Microsoft Corp., Redmond, WA) and Prism 7.0 or 8.0. Data are expressed as mean ± s.e.m. Curves were fit to the data using a four-parameter, non-linear regression function. Statistical analyses were performed using unpaired, 2-tailed Student’s t tests for comparisons between 2 groups. For binding, data from binding dose–response assays were analyzed by using a sigmoidal dose–response model with variable slope. Paired data sets were statistically compared by using Student’s t test (two-tailed) assuming unequal variances for the two sets.
Photo-crosslinking in cells.
Cell culture.
The photo-activatable amino acid p-Benzoyl-L-phenylalanine (Bpa) was incorporated into position 75 of β-arrestin-1 in response to the amber stop codon according to the expanded genetic code technology56–58. For each photo-crosslinking experiment, nine 10 cm dishes of HEK293 cells were needed. One day before transfection, the exponentially growing cells were collected and plated at a density of 2×10⁶ cells/dish to each poly-D-lysine pretreated plates with the appropriate complete medium. HEK293 cells for transfection were cultured at 37°C in a humidified incubator with an atmosphere of 5% CO2, in DMEM high glucose medium (pH 7.4, Gibco) supplemented with 5% inactivated fetal bovine serum (5% FBS, Invitrogen), and 100 U/ml penicillin and 100 µg/ml streptomycin (1% Pen-Strep, Invitrogen). Before transfection, the medium was changed to fresh medium containing 250 µM of the unnatural, UV-crosslinkable amino acid Bpa and cultured for another 1 h. Cells were transfected using the lipofectamine 3000 transfection kit (Invitrogen) at 80–90% confluence with three plasmids: one carried the gene of the hPTH1R (3.2 ug); another contained the human β-arrestin-1 gene bearing a TAG codon instead of the triplet encoding for Phe75 under the control of the CMV promoter (pcDNA3.1 vector, 3.2 ug); the third plasmid, pIRE4-Bpa, contained the humanized gene of the BpaRS derived from the E.coli TyrRS56 under control of the PGK promoter and 4 tandem repeats of the amber suppressor tRNA derived from the B. stearothermophilus tRNATyr under control of the U6 promoter, similar as previously described (4 ug)59. Twenty-four hours after transfection, cells were stimulated with the desired agonists for the desired time, washed twice and irradiated with UV light (365 nm) for 15 min in cold PBS using UVP crosslinker (Analytik Jena) with 2000× 100 microjoules per cm2 energy exposure at a 2.5 cm distance.
Calcium phosphate mediated transient transfection.
The calcium phosphate-DNA co-precipitate transient transfection method was used. The following solutions were prepared for transfection experiments, including sterilized CaCl2 (2 M) and 2x HBS-buffered saline (280 mM NaCl, 1.5 mM Na2HPO4, 50 mM HEPES, 10 mM KCl, 12 mM Dextrose, pH 7.05). For each 15-cm dish, 960 µL of ddH2O, 140 µL of 2 M CaCl2 and 45 µl of plasmid DNA (PTHR, β-arrestinF75Bpa, and pIRE4-Bpa, 1 mg/mL for each) were mixed, followed by the drop-wise addition of 1.125 mL of HBS buffered saline (at a ratio of 1:1). Mixture was allowed to incubate at room temperature for 30 min, and the total of 2.25 mL of calcium phosphate-DNA particles complex was added to each plate. 16 hours after transfection, the medium was gently aspirated and pre-warmed fresh medium containing 250 µM Bpa was added to the plates.
Co-IP and Proteolytic digestion.
The cells were cultured for another 36 hours and stimulated with 200 nM PTH(1–34) for 10 min. After washing with PBS, the cells in PBS were irradiated by ultraviolet for 15 min. Then, the PBS was aspirated and 1 mL of RIPA buffer containing 50 mM Tris, pH 8.0, 150 mM NaCl, 1% NP-40, 0.1% SOC, 2 mM EDTA and 1% protease inhibitor was added to each plate, and incubated at 37 °C for 15 min. Using a 1 mL pipette, the cells were scraped and gently lysed by pipetting up and down 5–8 times. The total cell lysate from 9 plates was transferred to a 15-ml Eppendorf tube and the supernatant was collected after centrifugation at 14 000×g for 15 min, then vortexed for 3–5 seconds and kept on ice.
For co-IP experiments, 150 µL of anti-HA agarose was added to the supernatant and incubated with gentle end-over-end mixing overnight at 4 ºC. Using centrifugation at 1000×g for 5 min at 4 ºC and aspiration of the supernatant, the beads were washed with RIPA buffer six times. The protein complex was eluted from the beads by incubating with 3 mg/mL HA peptide solution at for 30 min at 25 ºC. After centrifugation at 1000×g for 5 min at 4 ºC, the supernatant was collected for subsequent in-gel digestion.
General mass spectrometric analysis.
The obtained peptides were separated by C18 Columns (10.5 cm; particle size, 3 μm; pore size, 120 Å; New Objective) using a nano-LC ACQUITY high-performance liquid chromatography system (Waters). The two eluent buffers were H2O with 2% ACN and 0.1% FA (A), and ACN with 2% H2O and 0.1% FA (B), and both were at pH 3. The gradient of the mobile phase was set as follows: 2%−35% B in 44 min, 35%−98% B in 1 min and maintained at 80% B for 3 min. The flow rate was 350 nL/min.
LC-MS/MS data was collected using an LTQ Orbitrap Velos mass spectrometer equipped with an ESI probe Ion Max Source with a microspray kit. The system was controlled by Xcalibur software version 1.4.0 from Thermo Fisher (Waltham, MA, USA) in the data-dependent acquisition mode. The capillary temperature was held at 275 ºC, and the mass spectrometer was operated in positive ion mode. Full MS scans were acquired in the Orbitrap analyzer over the m/z 350–1,600 range with a resolution of 30,000 and the AGC target was 1e6. The 20 most intense ions were fragmented, and tandem mass spectra were acquired in the ion trap mass analyzer. The dynamic exclusion time was set to 30 s, and the maximum allowed ion accumulation times were 60 ms for MS scans.
Data analysis.
Raw data files were first converted to mzXML files using ProteoWizard 3.0.18199 and subjected to StavroX (v3.6.6) analysis for identification of cross-linked products60. MS/MS spectra were matched with a Uniprot Homo sapiens database (entries downloaded at July 24, 2018), using the following parameters: full trypsin digest with maximum 3 missed cleavages, static modification carbamidomethylation of cysteine (+57.021 Da), as well as dynamic modification oxidation of methionine (+15.995 Da), acetylation of protein N-term (+42.010565) and phosphorylation of serine, threonine and tyrosine (+79.966331). Precursor mass tolerance was 10 ppm and product ions fragment ion tolerance were 0.5 Da. Peptide spectral matches were validated using percolator based on q-values at a 1% false discovery rate (FDR).
Extended Data

Two-dimensional 1H-15N transverse relaxation optimized spectroscopy (TROSY) spectra of 15N-PTH(1–34)
Spectra were obtained in the absence (blue) or presence of PTHRECD, 0.5 (pink) or 0.75 (purple) molar ratio. a, On the left panel, full spectra showing all peaks of PTH(1–34). On the right panel, spectra of Gly12 and Ser17. Ser17 peak was too weak to be seen at 0.75 molar ratio. b, Zoomed-in spectra showing most peaks of PTH(1–34). PTH(1–34) peaks are labeled with bold text, and peaks corresponding to attached Strep-tag are labeled with italicized text. c, Zoomed-in spectral region of PTH His9. The conformation of His9 in free PTH is marked by Peak #1. Peak #2 represents the new conformation of His9 that occurred in the presence of 0.5 molar ratio PTHRECD and becomes stronger at 0.75 molar ratio PTHRECD. d, Zoomed-in spectral region of PTH Asn16, showing PTH conformational changes in the presence of PTHRECD. Peak #1 represents the conformation of Asn16 in the free PTH. Peak #2 represents the new conformation of Asn16 when PTH is bound to PTHRECD.
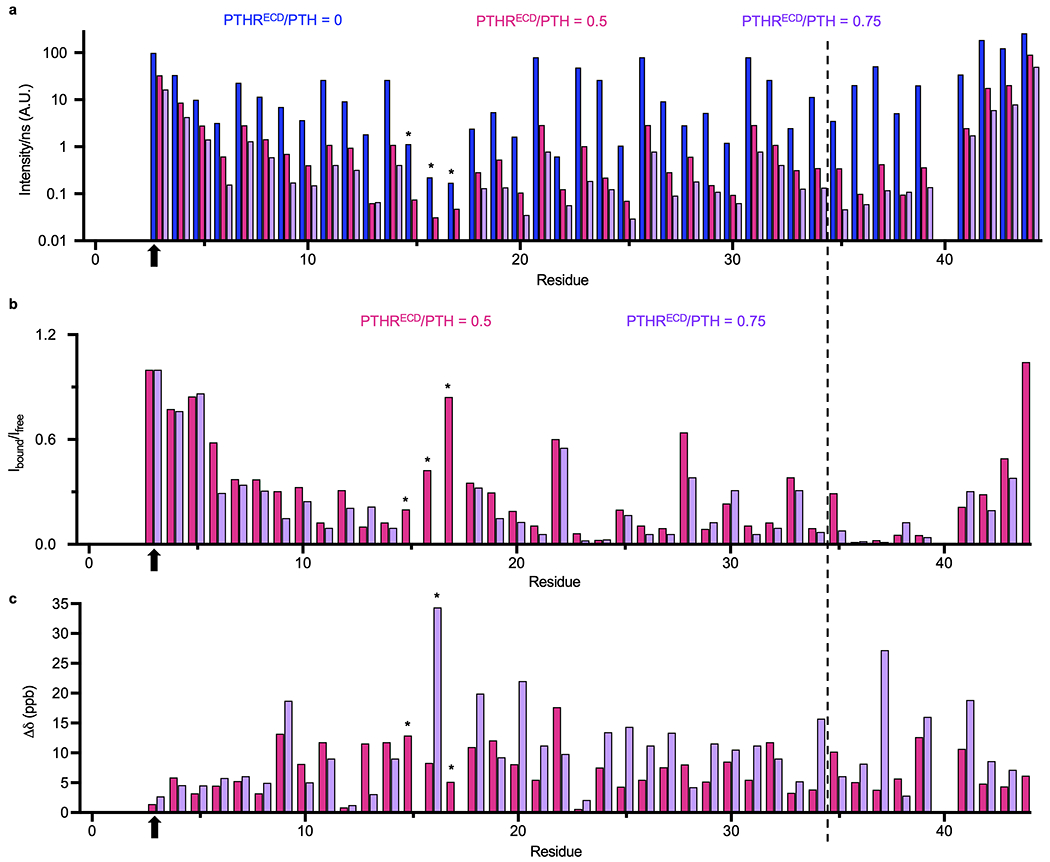
TROSY peak intensity (height), peak intensity ratio (Ibound/Ifree), and chemical shift perturbation (Ää).
a, Peak intensities (normalized with respect to the number of scans in TROSY experiments) varied along the PTH sequence and the variations increased upon binding to 0.5 and 0.75 molar ratios of PTHRECD due to reduced PTH flexibility. b, Peak intensity ratio (Ibound/Ifree) and c, Chemical shift perturbation (∆δ) of individual residues upon binding to 0.5 or 0.75 molar ratios of PTHRECD. Residue intensities from the same experiment were normalized with respect to the intensity of Ser3 (indicated by an arrow) prior to calculations in b. Residues 15–17, indicated by asterisks, do not have visible peaks in the presence of 0.75 molar ratio PTHRECD. The new peak at Asn16 in the presence of 0.75 molar ratio PTHRECD was not used for Ibound/Ifree analyses but is displayed in the chemical shift perturbation plot. PTH(1–34) is separated from residues in the linker and Strep-tag by a thin dashed line.
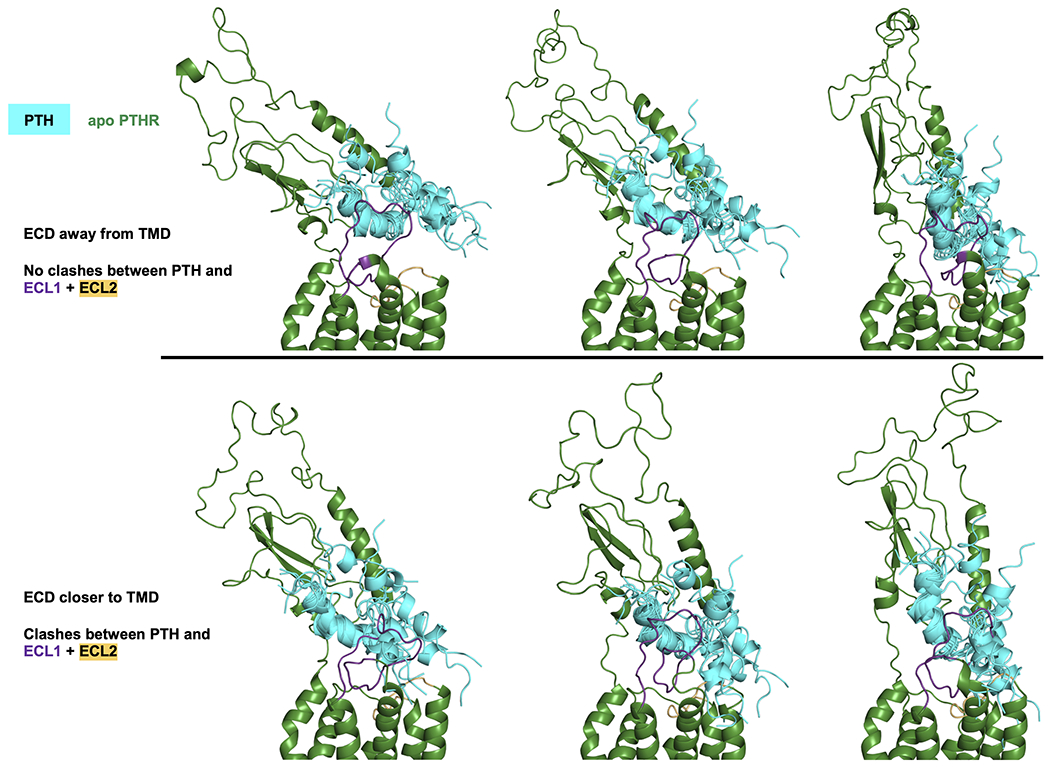
Docking of PTH onto PTHRECD in the apo state using conformers from MD.
The NMR structural ensemble of free PTH(1–34) (cyan, PDB 1ZWA) was docked onto MD snapshots of apo PTHR (dark green, see Methods for docking protocol). When the PTH ensemble is docked onto PTHRECD oriented toward PTHRTMD, the N-terminal portion of PTH clashes significantly with extracellular loops 1 and 2 (ECL1 and ECL2, colored purple and light orange, respectively). These clashes are reduced when the PTH ensemble is docked onto PTHRECD oriented away from PTHRTMD.
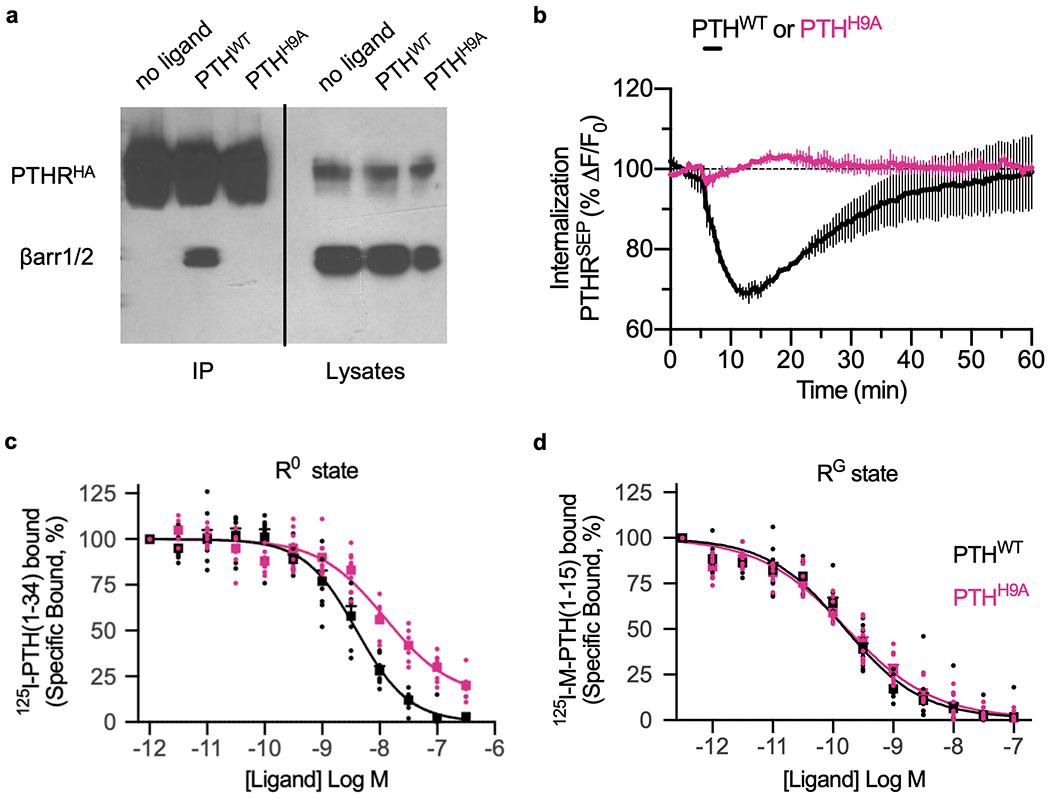
Binding, trafficking and signaling properties of PTHH9A.
a, Co-immunoprecipitation of HA-tagged PTHR and β-arrestins from HEK293 cells after stimulation with PTHWT. Stimulation with PTHH9A does not immunoprecipitate β-arrestin with PTHRHA. b, Averaged time courses of PTHR internalization after 60 s stimulation with 100 nM PTHWT or PTHH9A in HEK293 cells stably expressing PTHRSEP. Data represent the mean ± s.d. of N = 2 experiments with n = 18 cells per experiment (independent biological replicates). c, Radioligand competition assays of PTHWT and PTHH9A binding to PTHR R0 (G protein-free) conformation. d, Radioligand competition assays of PTHWT and PTHH9A binding to PTHR RG conformation. For c and d, data are averaged from N = 4 and N = 5 independent experiments, respectively. Square points and error bars represent mean ± s.e.m. Individual data points are also shown.
Interactions between PTHWT His9 side chain and PTHR residues, and comparison with the interactions of the mutant PTHH9A.
Panels a-e display MD snapshots of PTHWT-bound receptor, and panel f, those for the mutant H9A-bound receptor. PTHWT is cyan, and PTHR is green in panels a-e, and PTHH9A is light pink, and PTHR is hot pink in panel f. MD snapshots of PTHWT-bound receptor showing different interactions. a, His9 hydrogen bond with Tyr429 (ECL3). b, Hydrogen bonds with Ser355 and Gly357 main chain (ECL2). c, Hydrogen bond with Ser355 side chain (ECL2). d, Aromaticaromatic interactions between His9 and Tyr429 (ECL3). e, Hydrogen bond with Gln364 (TM5). f, Interactions between PTHR Leu354 and PTHH9A Ala9 in triplicate simulations. MD snapshots were collected every 10 ns during the last 50 ns of each simulation are aligned by PTHRTMD (residues 180 to 460).
Receptor conformations stabilized by PTHWT and PTHH9A.
Snapshots of PTHWT- and PTHH9A-bound receptor collected during the last 50 ns of triplicate simulations (10 ns intervals), aligned by PTHR transmembrane helices. a, Aligned receptor structures, with dashed boxes indicating areas shown in b and c. The arrow points to the helical turn (residues 394 to 397) in ICL3. ECD (residues 27 to 179), ECL1 (residues 247 to 275), TM3 residues 276 to 280, and peptide residues 14 to 34 are hidden for clarity. b, ECL2 conformation. c, Left, relative inward movement of PTHH9A–PTHR TM5. Right, relative inward movement of PTHH9A–PTHR TM6. d, ICL3 conformations in PTHWT- and PTHH9A-bound receptor snapshots after one 200 ns simulation. The helical turn in ICL3 stabilized by PTHWT is indicated by an arrow.
PTHH9A-stabilized kink 5 and its consequences.
a, Thr392-Val455 distance distributions over triplicate 200 ns simulations of apo, PTHWT-bound, and PTHH9A-bound receptor. Raw data are shown as thin lines. Second-order smoothed data (over 30 neighbors) are shown as thick lines. Top, plots starting at y = 0. Bottom, plots starting at y = 20. b, Alignment of PTHH9A-bound receptor (hot pink) TMD with the TMD of the PTHR–Gs cryo-EM structure. Gás is colored purple. Clashing residues are shown as sticks. c, Interaction of PTHR Arg3965.75 with â-arrestin-1. In the PTHWT-bound model (green), positively charged Arg396 engages with negatively charged Glu155 and Glu156 from â-arrestin-1. In the PTHH9A-bound model (hot pink), Arg396 is oriented away from â- arrestin Glu155–156, toward Arg312. Since arginine side chains are flexible, Arg396 in the PTHH9A-bound model would reorient away from Arg312.
Accelerated MD (aMD) of apo PTHR.
Two snapshots from 100 ns aMD simulation of apo PTHR were aligned by their transmembrane helices. The snapshot exhibiting the largest TM6 movement is colored dark green. The snapshot with the smallest TM6 displacement is colored yellow. a, Full receptor structures. b, Zoomed-in structures, with TM5, ICL3, and TM6 of each receptor indicated by colored arrows.
LC-MS/MS data identifying photocrosslinking between PTHR and ®- arrestin-1 F75Bpa in PTH-stimulated cells.
a, PTHR Thr392. b, PTHR Val384.

| R0 State (n = 4) | RG State (n = 5) | |||
|---|---|---|---|---|
| IC50, nM | P | IC50, nM | P | |
| PTHWT | 3.84 ± 0.91 | 1.00 | 0.16 ± 0.02 | 1.00 |
| PTHH9A | 13.70 ± 2.24 | 0.02 | 0.19 ± 0.06 | 0.60 |
Acknowledgments.
Research reported in this publication was supported by the National Institute of Diabetes and Digestive and Kidney Disease (NIDDK), the National Institute of General Medical Sciences (NIGMS), the National Institute of Arthritis and Musculoskeletal and Skin Diseases (NIAMS), and the National Institute on Drug Abuse (NIDA) of the US National Institutes of Health (NIH) under grant Awards Number R01-DK111427, R01-DK116780, and R01-DK122259 (to J.P.V.), DK011794 (to T.J.G.), P41-GM103712 and P30-DA035778 (to I.B), R01-DA046939 (P.T.), and F31-AR074843 (to L.J.C.).
Abbreviations:
| ANM | anisotropic network model |
| Bpa | p-benzoyl-L-phenylalanine |
| ECD | extracellular domain |
| ECL | extracellular loop |
| FRET | fluorescence resonance energy transfer |
| FSK | forskolin |
| GPCR | G protein-coupled receptor |
| HA | hemagglutinin |
| ICL | intracellular loop |
| LA-PTH | long-acting PTH analog |
| MD | molecular dynamics |
| MS | mass spectrometry |
| NMR | nuclear magnetic resonance |
| PTH | parathyroid hormone |
| PTHR | PTH receptor type 1 |
| TMD | transmembrane domain |
| TROSY | transverse relaxation optimized spectroscopy |
References
1
2
3
4
5
6
7
8
9
10
11
12
13
14
15
16
17
18
19
20
21
22
23
24
25
26
27
28
29
30
31
32
33
34
35
36
37
38
39
40
41
42
43
44
45
46
47
48
49
50
51
52
53
54
55
56
57
58
59
60
Floating objects
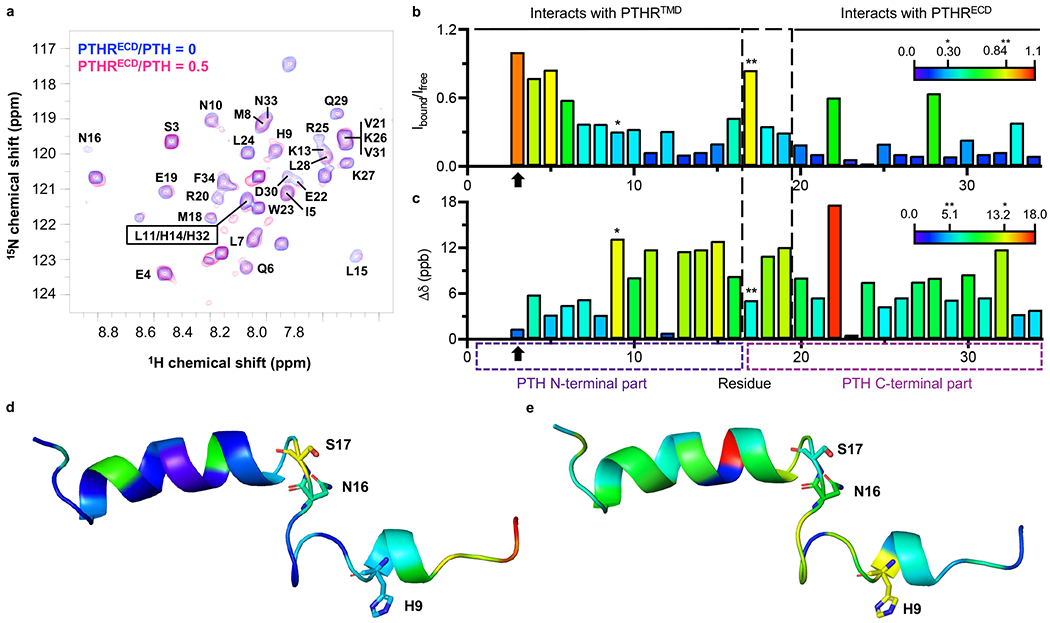
NMR analysis uncovers new molecular aspects of the PTH–PTHR binding mechanism.
a, Two-dimensional 1H-15N transverse relaxation optimized spectroscopy (TROSY) spectra of 15N-PTH(1–34) in the absence (blue) and presence (pink) of 0.5 molar ratio PTHRECD. PTH(1–34) peaks are labeled with bold text. b, For each residue, TROSY peak intensity (height) in the presence of 0.5 molar ratio PTHRECD relative to intensity in the absence of PTHRECD (Ibound/Ifree) indicates the extent of reduced mobility upon PTH binding to PTHRECD. Bars are colored according to Ibound/Ifree values, from most restricted (small Ibound/Ifree, indigo) to most retained mobility (large Ibound/Ifree, red). c, For each residue, TROSY peak chemical shift perturbation (Δδ) in the presence of 0.5 molar ratio PTHRECD indicates the extent of chemical environment change upon PTH binding to PTHRECD. Bars are colored from small (indigo) to large (red) chemical shift perturbations. For b and c, Ser3 is indicated by an arrow. His9 is indicated by a single asterisk, and Ser17 is indicated by a double asterisk. The central flexible region of the peptide, residues 16–18, is indicated by a large-dashed box. PTH N- (residues 1–15) and C-terminal (residues 16–34) parts are indicated by small-dashed boxes. d, e, Structure of free PTH(1–34) (PDB 1ZWA) colored according to Ibound/Ifree values (d) and to chemical shift perturbation (e). His9, Asn16, and Ser17 are shown as sticks.
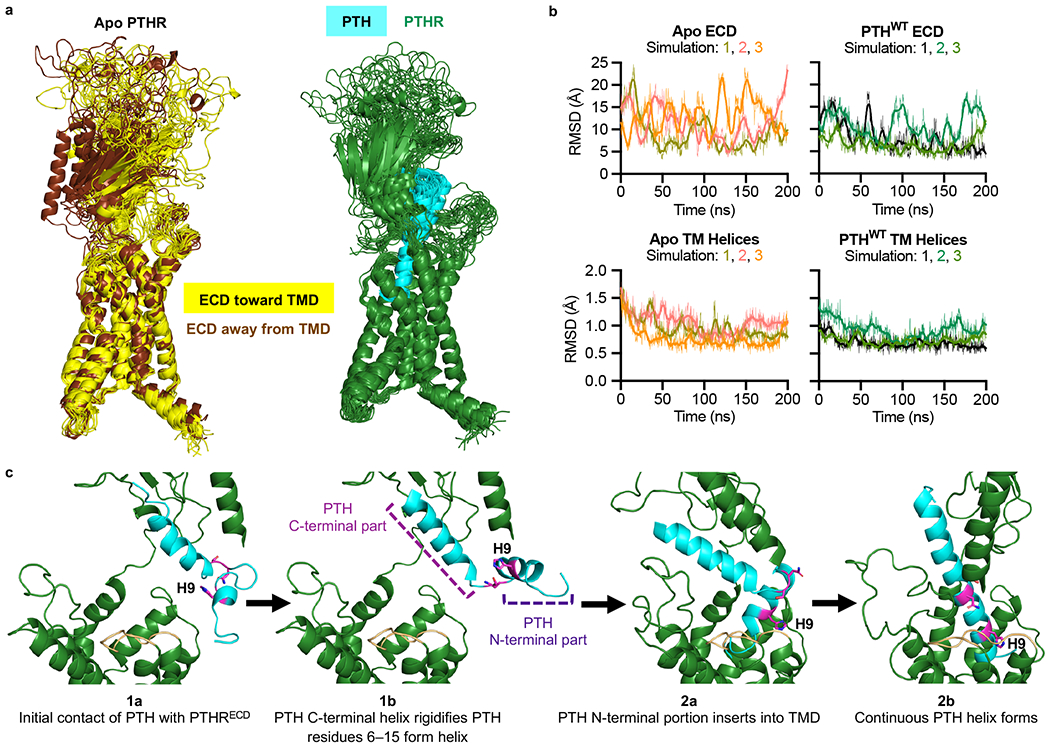
Expanded two-step binding mechanism.
a, Snapshots of apo and PTHWT-bound receptor collected every 10 ns during simulations (50 ns to 200 ns), aligned using PTHR transmembrane helices. In the left panel, apo PTHR snapshots where PTHRECD moved away from PTHRTMD are colored brown and those snapshots with PTHRECD moving toward PTHRTMD are colored yellow. In the right panel, the receptor is dark green, and PTHWT is cyan. b, Root-mean-square deviation (RMSD) in residue coordinates with respect to their average positions, observed during the course of three sets of 200 ns simulations for PTHRECD (residues 27 to 179; upper panels) and the PTHR transmembrane helices (lower panels; see Methods) for each 200 ns simulation. Note the lower RMSDs in the presence of PTHWT. Raw data are shown as thin lines. Second-order smoothed data (over 30 neighbors) are shown as thick lines. c, Expanded two-step model of PTH binding to PTHR. PTHR is colored dark green, with ECL2 highlighted in light orange. PTH is colored cyan, with residues His9, Asn16, and Ser17 displayed as magenta sticks. In step 1, binding of the C-terminal part of PTH to PTHRECD (step 1a) rigidifies the C-terminal helix as well as residues 6–15 within the N-terminal part of PTH (step 1b). These conformational changes expand helicity from residues 6 to 15. In step 2, the N-terminal part of PTH is inserted into PTHRTMD (step 2a), and interactions between the N-terminal portion of PTH and PTHR TMD and ECL2 residues, promote the formation of a continuous PTH helix (step 2b).
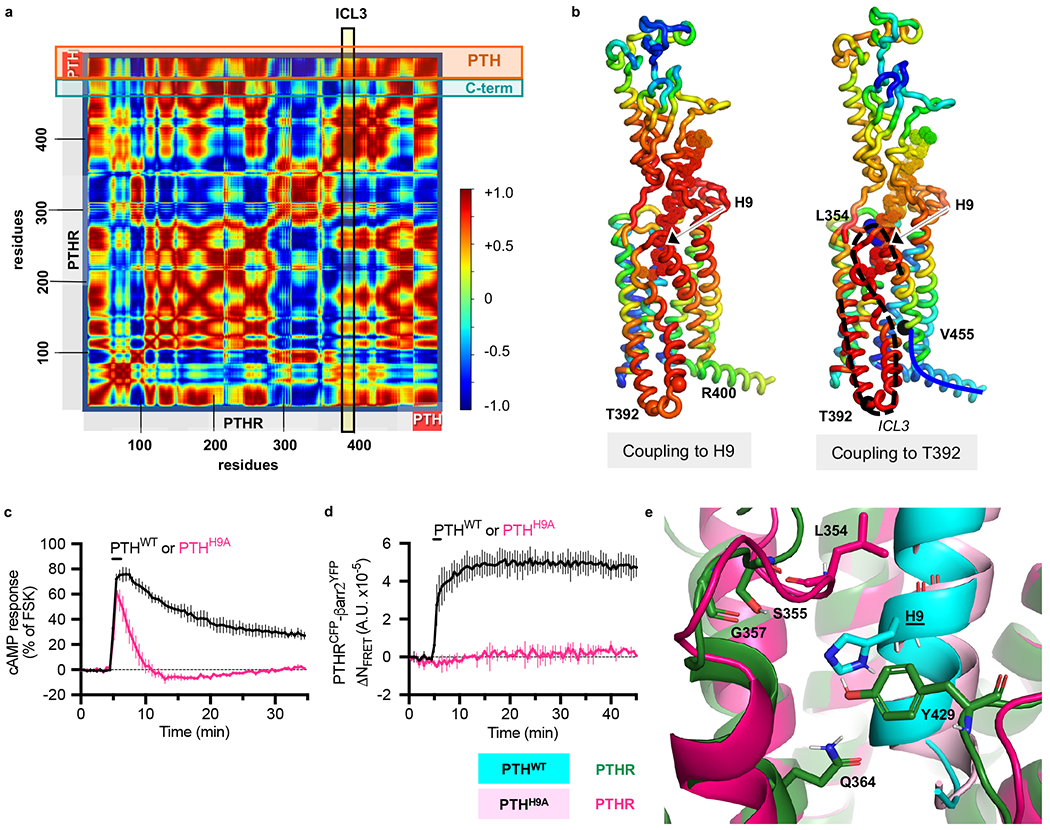
PTHH9A dramatically alters PTHR signaling.
a and b, ANM results for PTH-bound receptor reveal an allosteric coupling between peptide His9 binding site and cytosolic end of TM5/TM6. a, Cross-correlation map for the PTH-bound receptor. The entries in the map represent the orientational cross-correlations (−1 ≤ Cij ≤ 1; see the scale on the color-coded bar) between all pairs of nodes (residues) i and j. The two horizontal boxes indicate the PTH and the C-terminal helix of PTHR, and the vertical box indicates the position of the ICL3 connecting TM5 and TM6 at the cytoplasmic face of the PTHR. Their intersections indicate the cross-correlations between those regions, e.g. ICL3 and PTH are positively correlated (red), and ICL3 and the C-terminal helix are negatively correlated (blue). This result is based on ANM soft mode 14 (see also Supplementary Movie 1). b, Cartoon representation colored by the type and strength of correlation of all residues with PTH His9 (left) and with PTHR Thr392 (right). Blue and red regions indicate anticorrelated and correlated movements, respectively. Thr392 (on TM5 cytoplasmic end) and Val455 (near C-terminus) are shown in black balls, and Leu354 and His9, in blue balls in the right panel. Ala369- His442, which are strongly correlated with His9 and Thr392, are highlighted with a black dashed curve; and Val455-Leu481, anticorrelated with ICL3, with a solid blue curve. c, Averaged cAMP responses (percentage cAMP responses relative to response in the presence of forskolin, FSK) in HEK293 cells stably expressing PTHR after 30 s stimulation with 10 nM PTHWT or PTHH9A. Data represent the mean ± s.e.m. of N = 3 experiments with n =10 cells per experiment. d, Averaged time courses of β-arrestin-2YFP recruitment to PTHRCFP after 30 s stimulation with 10 nM PTHWT or PTHH9A, measured by FRET in HEK293 cells. Data represent the mean ± s.e.m. of N = 2 experiments with n = 14 cells per experiment. For c and d, statistics are derived from independent biological replicates. e, Snapshots of PTHWT-bound and PTHH9A-bound receptor after 200 ns of simulation. PTHWT His9 interacts with PTHR Gln364 on TM5, Ser355 and Gly357 on ECL2, and Tyr429 on ECL3. PTHH9A interacts with Leu354 on ECL2.
PTHH9A stabilizes a unique receptor conformation.
a, Snapshots of apo, PTHWT-bound, and PTHH9A-bound receptor after 200 ns of simulation, with Cα atoms of kink 5 residue Thr392 and reference residue Val455 shown as spheres. Inset, schematic of the FRET-based PTHR activation sensor with YFP is fused to ICL3, and CFP is attached to the receptor C-tail. Upon addition of agonist (e.g., PTHWT), the FRET ratio FCFP/FYFP is increased; see panel c for results. b, Left, Thr392-Val455 distance distributions over one 200 ns simulation of apo, PTHWT-bound, and PTHH9A-bound receptor. Raw data are shown as thin lines. Second-order smoothed data (over 30 neighbors) are shown as thick lines. Right, histogram of distance distributions deduced from triplicate MD simulations for each case. c, PTHR activation assay. Left, averaged time courses of PTHR activation, measured after stimulation by 1 μM PTHWT or PTHH9A. Right, averaged time courses of PTHR activation, measured after stimulation by 1 μM PTHH9A (zoomed in to reveal details). Data in middle and right panels represent the mean ± s.e.m. of N = 3 experiments.
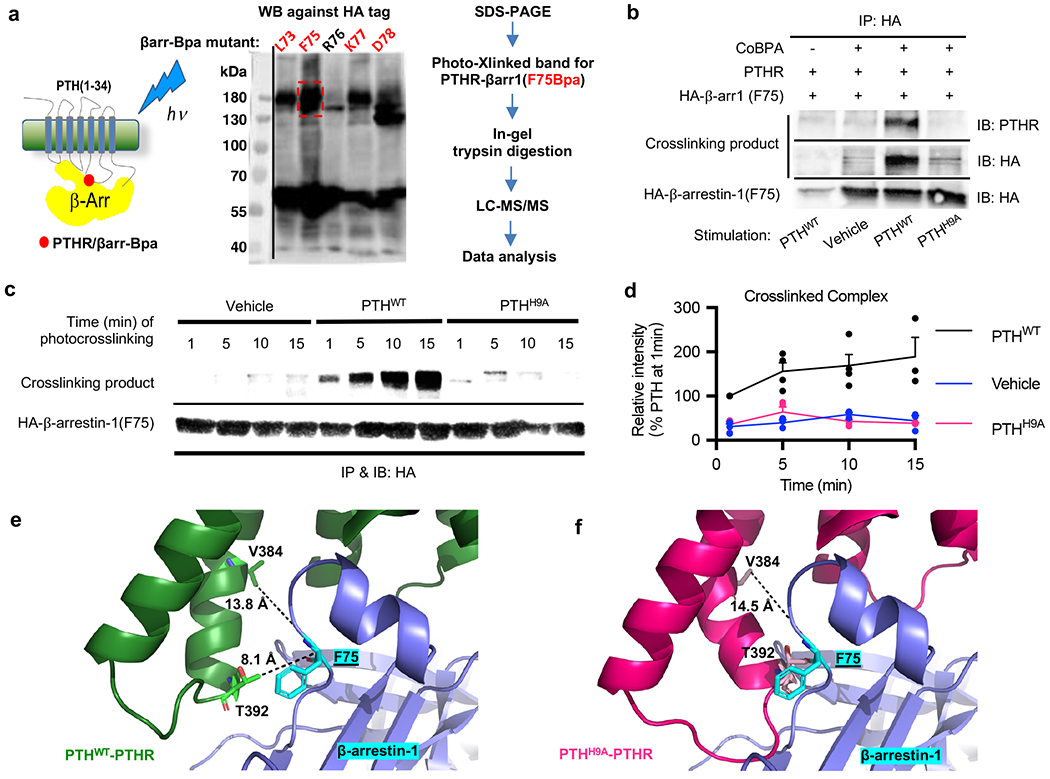
Identification of key contacts in the PTHR–β-arrestin complex interface by photo-crosslinking coupled to mass spectrometry in live cells.
a, Schematic procedure for identifying: First, β-arrestin-1 p-benzoyl-L-phenylalanine (Bpa) mutants that photo-crosslink with PTHR. Second, PTHR residues that photo-crosslink with β-arrestin-1 F75Bpa. The Western blot shows the degree of photo-crosslinking for several mutants, with F75Bpa producing a large band at the expected size for the complex (red dashed box), supporting selection of this mutant. b, Co-immunoprecipitation of HA-tagged β-arrestin-1 F75Bpa and photo-crosslinked PTHR. Samples were immunoprecipitated using an anti-HA antibody and immunoblotted for β-arrestin-1 (anti-HA) and PTHR (anti-PTHR). Stimulation with PTHH9A does not photo-crosslink PTHR with β-arrestin-1 F75Bpa unlike PTHWT. CoBPA is the pIRE4-Bpa plasmid, which encodes the aminoacyl-tRNA synthetase and the corresponding tRNA for Bpa incorporation into the β-arrestin-1 in place of a residue of interest. c, Time course of photo-crosslinking between β-arrestin-1 F75Bpa and PTHR stimulated with PTHWT or PTHH9A. While the extent of photo-crosslinking increased from 1 to 15 min. in PTHWT-stimulated sample, no photo-crosslinking occurred at any time point when stimulated with PTHH9A. For b and c, two independent experiments were performed with similar results. d, Plot of results from part c, showing relative intensity of crosslinked complex bands (% intensity of PTHWT band at 1 min.) over time points tested. Center values and error bars represent the mean ± s.e.m. of n = 2 samples carried out in duplicate. e, Model of PTHWT–PTHR bound to β-arrestin-1. No steric clashes between PTHR and β-arrestin-1 occur. Furthermore, PTHR distances between Thr392/Val384 and β-arrestin-1 F75 are within photo-crosslinking restraints, which suggests β-arrestin-1 interacts with PTHWT–PTHR in a manner similar to this model. f, Model of PTHH9A–PTHR bound to β-arrestin-1. PTHR Thr392 clashes with β-arrestin-1 F75. In panels e and f, PTHR residues 463–481 are hidden for clarity.