 Substantial hysteresis in emergent temperature sensitivity of global wetland CH4 emissions
Nature Communications

 ,
William J. Riley,
Sara H. Knox,
Robert B. Jackson,
Gavin McNicol,
Benjamin Poulter,
Mika Aurela,
Dennis Baldocchi,
Gil Bohrer,
David I. Campbell,
Ankur R. Desai,
,
William J. Riley,
Sara H. Knox,
Robert B. Jackson,
Gavin McNicol,
Benjamin Poulter,
Mika Aurela,
Dennis Baldocchi,
Gil Bohrer,
David I. Campbell,
Ankur R. Desai,

- Altmetric
Wetland methane (CH4) emissions (FCH4
Wetland methane emissions contribute to global warming, and are oversimplified in climate models. Here the authors use eddy covariance measurements from 48 global sites to demonstrate seasonal hysteresis in methane-temperature relationships and suggest the importance of microbial processes.
Introduction
Methane (CH4) is the second most important climate forcing trace gas influenced by anthropogenic activities after carbon dioxide (CO2)1–3. Wetlands are the largest and most uncertain natural CH4 source, contributing 19–33% of current global terrestrial CH4 emissions ()4–6. Top-down estimates from atmospheric inversion models and bottom-up estimates from in situ measurements both indicate gradual increases in natural wetland from 2000 (147–180 Tg CH4 yr−1; bottom-up vs. top-down) to 2017 (145–194 Tg CH4 yr−1), although estimates from both approaches vary widely4,6. In addition, atmospheric CH4 concentrations have rapidly increased since 2007 (+6.9 ± 2.7 ppb CH4 yr−1 for 2007–2015 vs. +0.5 ± 3.1 ppb CH4 yr−1 for 2000–2006), with increases arising from both biogenic (primarily agriculture and waste sectors) and fossil fuel-related sources7,8. Observed atmospheric CH4 concentrations have risen consistently with RCP8.5 (Representative Concentration Pathway of 8.5 W m−2)9 projections since 2007, and are growing relatively faster than observed increases in CO2 concentrations during the same period8.
Wetland estimates are poorly constrained due to high temporal and spatial variability10,11, compounded by insufficient measurements of fluxes (e.g., latitudinal data bias) and predictor variables (e.g., soil temperature and moisture), knowledge gaps in CH4 biogeochemistry12, and incomplete process representation in biogeochemical models4,5,13–15. Several factors have been suggested to regulate wetland through effects on methanogenesis (i.e., production), methanotrophy (i.e., oxidation), and CH4 transport, including gross primary productivity (GPP)16, water table depth (WTD)17, vegetation composition18,19, redox conditions20, substrate quality and availability21,22, pore water CH4 solubility23, microbial community dynamics and activity24, and temperature25. At ecosystem scale, some in situ observations indicate that are mainly controlled by 20–35 cm depth soil temperatures and are not sensitive to WTD variations as long as anoxic conditions exist26–28. Although appears to be positively correlated with temperature and CH4 production24–27, how to parameterize CH4 production, oxidation, and emission rates in models remain key uncertainties. Reducing the uncertainties is required to improve global CH4 budget assessments and increase confidence in future climate projections, as the temperature sensitivity of CH4 biogeochemistry is parameterized differently among CH4 models13,14,29. A recent meta-analysis reported that CH4 production temperature sensitivities derived from laboratory cultures are consistent with those of inferred from ecosystem-scale measurements and could therefore be used as an empirical basis for temperature sensitivity in models30.
However, site-specific emergent temperature dependencies inferred from different measurement periods show substantial intra-seasonal variability over the course of the year31–33, highlighting effects from other environmental drivers. For example, intra-seasonal variability may stem from hysteretic (i.e., temporally offset) microbial and abiotic interactions34: higher substrate availability increases methanogen biomass and CH4 production and emission later in the frost-free season33. Similarly, higher for a given GPP later in the frost-free season has been reported, which may be caused by the time required to convert GPP to methanogenesis substrates26. Further, changes in WTD can regulate the emergent temperature sensitivity through controls on soil redox potential31,35–37, especially when the WTD is below the site-specific rooting depth and critical zone of CH4 production17,38,39.
Here, we evaluated observationally based emergent relationships among , GPP, WTD, and air (Tair) and soil (Tsoil) temperatures using the global FLUXNET-CH4 database40. We analyzed data recorded in eight ecosystem types: bog, fen, marsh, peat plateau, rice paddy, salt marsh, swamp, and wet tundra that spans 207 site-years across 48 wetland and rice paddy sites (Supplemental Fig. 1 and Supplemental Table 1). The FLUXNET-CH4 database provides half-hourly ecosystem-scale eddy covariance measurements of and other fluxes (e.g., CO2, water vapor, and energy) measured at 83 sites across the globe40 (including uplands, wetlands, and rice paddy sites). Apparent hysteresis has been observed in response to WTD17,31, GPP26, Tair33, and Tsoil27,32,33 at individual sites, but has not been synthesized across ecosystem types over distinct climate zones. Here, we analyzed intra-seasonal changes in emergent dependencies of on these potential controls at each site-year. We focused on relationships of with Tair because Tair is directly relevant to climate policy and better characterized in climate models41. In addition, the amount of Tair data (207 site-years) in the FLUXNET-CH4 database is about twice than that of Tsoil measured at the shallowest (0–18.3 cm; 112 site-years) and deepest (32–50 cm; 97 site-years) site-specific soil depths. We show that consistent intra-seasonal changes in emergent dependencies of were derived with Tair and Tsoil measurements at the sites where both measurements were available.
We quantified emergent –Tair dependencies using a quadratic relationship (Methods; Eq. 1) fit to daily measurements reported during the frost-free season (defined by Tair > 0 °C, Methods). This quadratic functional form was chosen because it is consistent with MacroMolecular Rate Theory33 analyses of the temperature sensitivity of CH4 production and oxidation34 and produced reliable estimates of for our study sites (Supplemental Fig. 2). For each frost-free season, seasonal hysteresis was quantified as changes in emergent –Tair dependencies inferred from earlier and later periods separated by the maximum seasonal Tair. We did not consider outside the frost-free season, although they can be important in some high-latitude wetlands32,42. We used two metrics to quantify intra-seasonal changes in emergent –Tair dependence: (1) Normalized area of seasonal hysteresis (; i.e., the area enclosed by emergent earlier and later period –Tair relationships (Fig. 1d) normalized by maximum seasonal and Tair; Methods); and (2) Mean seasonal hysteresis (; i.e., the difference between mean daily inferred from measurements taken between later and earlier periods of the frost-free season). These two metrics are conceptually similar to those used to quantify temperature hysteresis in soil respiration43 and soil CO2 concentrations44. Positive and negative HA and Hμ values represent higher (e.g., Fig. 1d) and lower (e.g., Supplemental Fig. 3d) later (i.e., after reaching maximum seasonal Tair) in the frost-free season, respectively.

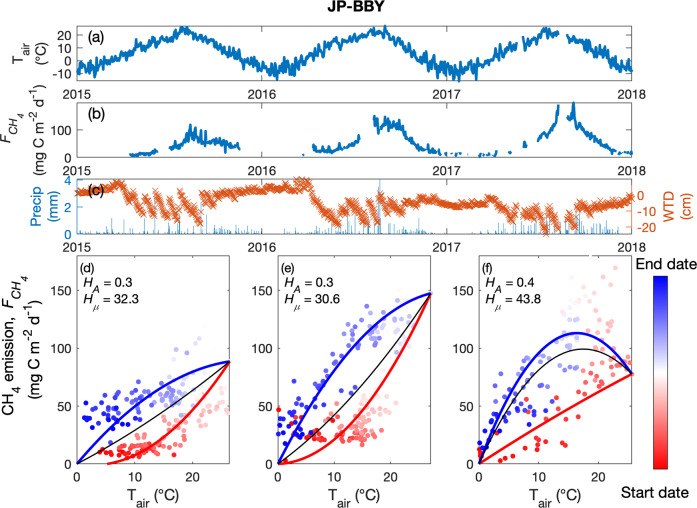
Daily mean CH4 emissions have hysteretic responses to air temperature.
The quality-controlled daily air temperature (a), CH4 emissions (b), precipitation (c, left axis), and water table depth (c, right axis) measured at the Bibai Mire in Japan (JP-BBY) from 2015 to 2017. CH4 emission-air temperature dependencies (lines) derived from daily estimates (dots) recorded at JP-BBY for 2015 (d), 2016 (e), and 2017 (f). The results inferred from earlier and later parts of the frost-free season, and full frost-free season are colored in red, blue, and black, respectively. Start and end dates represent the beginning and ending of the frost-free season, respectively. Values of HA and Hμ denote the normalized area of seasonal CH4 emission hysteresis (normalized area enclosed by the blue and red lines) and the mean seasonal CH4 emission hysteresis calculated in each site-year, respectively.
Results and discussion
A case study of positive seasonal CH4 emission hysteresis
As an example of seasonal hysteresis, we examined daily estimates obtained from measurements taken at the Bibai Mire in Northern Japan (JP-BBY) where is insensitive to the relatively shallow WTD from 2015 to 201727 (Fig. 1b, c). Although the seasonality shown in appears to follow Tair (Fig. 1a, b), a time-dependent -Tair relationship varies from earlier to later parts of the frost-free season (Fig. 1d–f). Specifically, plotting daily as a function of Tair results in a counterclockwise loop from beginning to end of the frost-free season. Similar hysteretic patterns were found using Tsoil (Supplemental Fig. 4) and gap-filled CH4 emissions45 (Supplemental Fig. 5), indicating that the hysteresis is not caused by time lags between Tsoil and Tair resulting from heat transfer into the soil46, and is not driven by biases caused by missing data. These hysteretic patterns suggest that should not be represented as a single static function of Tair.
Seasonal CH4 emission hysteresis among site-years
Overall, we detect positive seasonal hysteresis in most site-years recorded in the FLUXNET-CH4 database, both in terms of and (75–77% of site-years; Fig. 2). Consistent hysteresis patterns and magnitudes were found with monthly and Tair estimates (72–74%, Supplemental Fig. 6), indicating the observed seasonal hysteresis is not sensitive to temporal resolution. The non-zero and values demonstrate intra-seasonal changes in emergent –Tair dependencies among wetland and rice paddy sites across the globe, and their negatively skewed distribution indicates that the hysteretic responses are not likely to be random. Ignoring seasonal hysteresis leads to overestimated (28 ± 46%) and underestimated (−9 ± 35%) predictions earlier and later in the frost-free season across wetland and rice paddy sites, and such prediction bias is overlooked by using seasonally invariant Tair dependence models (−4 ± 7%, Supplemental Fig. 7). For example, predictions made by a seasonally invariant emergent –Tair dependence at JP-BBY (i.e., black lines in Fig. 1d–f) are generally biased high and low in the earlier and later parts of the frost-free season, respectively.
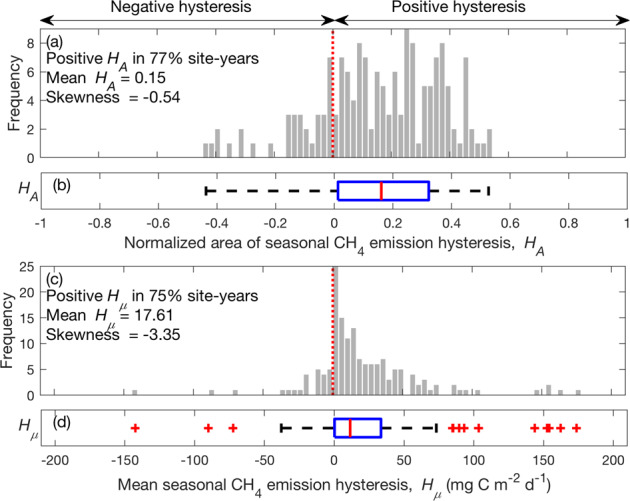
Predominantly positive seasonal CH4 emission hysteresis inferred from ecosystem-scale measurements across the globe, i.e., CH4 emissions are generally higher later in the frost-free season at the same temperature.
The distribution of normalized area of seasonal CH4 emission hysteresis (HA; a, b) and mean seasonal CH4 emission hysteresis (Hμ; c, d) to air temperature among site-years derived from the FLUXNET-CH4 database. Positive seasonal CH4 emission hysteresis indicates higher CH4 emissions later in the frost-free season at the same temperature (e.g., Fig. 1d–f). Red dashed lines represent no hysteresis. The corresponding boxplot of site-year specific HA (b) and Hμ (d) derived from the FLUXNET-CH4 database. The red central mark, and the bottom and top edges of the blue box indicate the median, and the 25th and 75th percentiles, respectively. The black whiskers extend to the most extreme data points not considered outliers denoted in red plus symbol.
To examine how potential controls are related to the observed seasonal hysteresis, we analyzed the distribution pattern of under different site classifications and microclimatic conditions. The majority of site-years show positive seasonal hysteresis when values are categorized into (1) different ranges of mean Tair measured in the frost-free season (Supplemental Figs. 8), (2) different wetness conditions indicated by higher and lower mean WTD later in the frost-free season (Supplemental Fig. 9), and (3) different ecosystem types (Supplemental Fig. 10). Intra-seasonal changes in emergent GPP–Tair dependencies show about equal site-year proportions of positive and negative values (48% and 52%, respectively; Supplemental Fig. 11a), suggesting that GPP does not directly contribute to the observed seasonal hysteresis. Further, predominantly positive seasonal hysteresis is detected using Tsoil measured at the shallowest (Supplemental Fig. 12) and deepest (Supplemental Fig. 13) site-specific soil layers, indicating substantial intra-seasonal variability in the -Tsoil relationship. Overall, the wetland and rice paddy observations in the current FLUXNET-CH4 database suggest that are generally higher later (i.e., after reaching maximum seasonal Tair or Tsoil) in the frost-free season at a given Tair and Tsoil. These hysteretic responses emerged across climate zones with various GPP and frost-free season lengths, and were not directly attributable to intra-seasonal changes in Tair and Tsoil (Supplemental Fig. 14).
Divergent temperature responses among sites and years
In terms of the magnitude of seasonal hysteresis, intra-seasonal changes in emergent -Tair dependence vary substantially among site-years within each ecosystem type (Fig. 3), despite being predominantly positive (Fig. 2). For each ecosystem type, the large inter-annual (i.e., different years within the same site) and inter-site (i.e., different site-years within the same ecosystem type) variability highlights the challenge of quantifying a universal and robust emergent –Tair dependence across wetland and rice paddy sites. For example, using the Boltzmann–Arrhenius function (Methods) to represent the emergent -Tair dependence of an ecosystem type cannot accurately reflect the site- and time-specific emergent relationships between and Tair (Fig. 3). A single static function of Tair thus cannot provide accurate estimates of , even though meta-analyses using the same functional form suggested that such a representation would lead to consistent emergent –Tair dependencies among aquatic, wetland, and rice paddy ecosystems30. Considering intra-seasonal variability in emergent –Tair dependence leads to higher and lower apparent activation energies for during earlier and later parts of the frost-free season, respectively (Supplemental Fig. 15a). Our findings indicate that the temperature sensitivity is an emergent property that varies substantially with space and time and thus cannot be sufficiently generalized for formulating mechanistic CH4 models, regardless of its functional form.
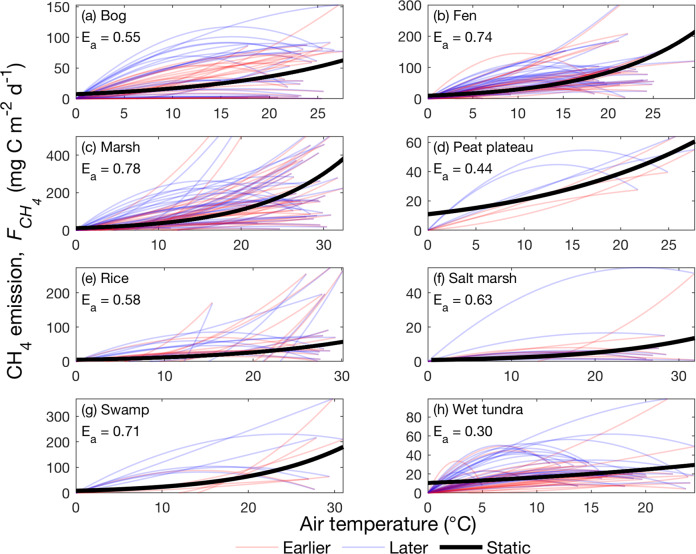
Large differences in intra-seasonal, inter-annual, and inter-site emergent temperature dependencies are found for all examined ecosystem types.
Thin lines represent the site- and time-specific emergent dependencies of CH4 emissions on air temperature inferred from daily measurements collected at bog (a), fen (b), marsh (c), peat plateau (d), rice paddy (e), salt marsh (f), swamp (g), and wet tundra (h) sites. Thick black lines represent ecosystem-type specific emergent dependencies of CH4 emission on air temperature inferred from the Boltzmann–Arrhenius function that do not recognize spatial heterogeneity and temporal variability. The results inferred from earlier and later parts of the frost-free season, and full frost-free season are colored in red, blue, and black, respectively.
Factors other than temperature modulate CH4 emissions
We applied two approaches to evaluate factors regulating the emergent -Tair dependence and examine the degree of complexity needed in parameterizations in biogeochemical models. In the first approach, we examined the effects of Tair, ecosystem-type variability (i.e., differences between ecosystem types), inter-site variability, inter-annual variability, and intra-seasonal variability on predictions. Specifically, estimates obtained from six sets of regression models selectively representing the above-mentioned variability (Methods; Supplemental Table 2) were evaluated to investigate how spatial and temporal complexity influences model performance. In the second approach, we trained a random-forest model (Methods) with the FLUXNET-CH4 database to identify factors controlling the hysteresis parameter (Methods) that quantifies the functional relationship between and Tair. To assess whether an observationally inferred model can be constructed for estimates, we evaluated the predictive power of a hybrid model that uses the random-forest predicted to describe the emergent –Tair dependence (Methods; Eq. 1) in each part of the frost-free season.
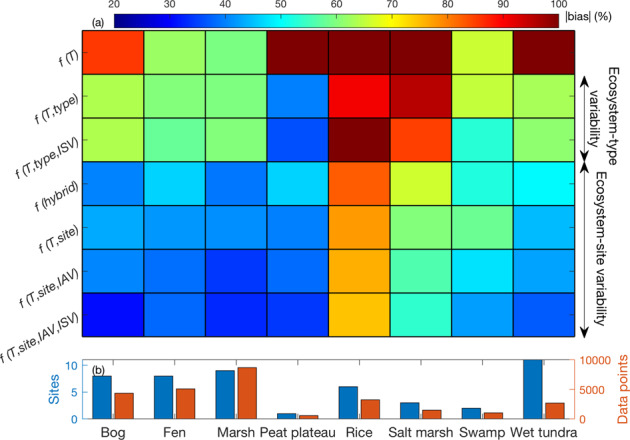
The seven Tair dependence models (six regression and one hybrid) can be broadly categorized into three tiers based on the absolute bias relative to the measured : (1) employing a universal emergent –Tair dependence inferred from measurements across the globe without representing spatial and temporal variability (76.2% biased); (2) including ecosystem-type variability (i.e., the emergent –Tair dependence is inferred from measurements collected at the same ecosystem type, so sites within an ecosystem type are uniformly represented; 63.5–63.9% biased); and (3) including ecosystem-site variability (i.e., the emergent –Tair dependence is inferred from measurements collected at each site; 38.1–45.9% biased) (Fig. 4). Our results suggest that representing ecosystem-type variability does not necessarily improve estimates, because the absolute bias of modeled is comparable with that estimated by using a universal emergent –Tair dependence, except for bog, peat plateau, and wet tundra sites (Fig. 4a). For each ecosystem type, the absolute bias of modeled is reduced when ecosystem-site variability is represented, demonstrating the need to recognize inter-annual and inter-site variability (e.g., Fig. 3). For each Tair dependence model, the absolute bias of modeled is generally higher in rice paddies and salt marshes than in other ecosystem types, suggesting that in these systems are sensitive to factors other than Tair. For example, timing of irrigation, drainage, planting, and harvesting can all affect dynamics in rice paddies47.
The accuracy of CH4 emission estimates improves with better representation of the large wetland-site variability caused by varying environmental conditions.
The absolute bias relative to measured CH4 emissions estimated by each model class for each ecosystem type (a). Blue and red bars denote the number of sites and quality-controlled daily data points within each ecosystem type, respectively (b). The abbreviations used in each model group represent air temperature (T), ecosystem-type variability (type), intra-seasonal variability (ISV), hybrid model based on random-forest estimated hysteresis parameter (hybrid), inter-site variability (site), and inter-annual variability (IAV).
Results derived from our random-forest model confirm the importance of ecosystem-site variability in regulating and thereby predicted by the hybrid model in each part of the frost-free season (Supplemental Fig. 16). Our random-forest predictor importance analysis indicates that site-year specific and Tair values are more important for estimates than other predictors such as latitude, GPP, and ecosystem type. The weak relationships found between seasonal hysteresis and latitude (Supplemental Fig. 14h) and GPP (Supplemental Fig. 14d) are consistent with the relatively low predictor importance for found in our random-forest model. Collectively, our results demonstrate the importance of recognizing inter-site, inter-annual, and intra-seasonal variability for the interpretation of emergent –Tair dependence inferred from measurements across distinct site-years.
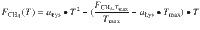
When using a universal emergent -Tair dependence that only represents a generic Tair sensitivity of (i.e., the top row in Fig. 4a), the resulting predictions substantially underestimate the range of measured across wetland and rice paddy sites (Fig. 5a). This generic Tair sensitivity of flattens the high temporal and spatial variability10,11 that strongly controls the timing and magnitude of , reinforcing the need to parameterize factors other than Tair in CH4 models. Including factors other than a generic Tair sensitivity of (i.e., the bottom row in Fig. 4a) improves predictions (Fig. 5b, c), which suggests that and emergent –Tair dependence strongly depend on site- and time-specific environmental conditions. Therefore, models should mechanistically represent CH4 biogeochemistry, because site- and time-specific emergent -Tair dependence cannot be accurately parameterized everywhere and all the time. Although many CH4 models parameterize methanogenesis, methanotrophy, and CH4 transport for modeling13, only three of 40 recently reviewed CH4 models mechanistically represent CH4 biogeochemistry based on explicit microbial dynamics29. Consequently, implementing process-based representations of CH4 biogeochemistry in CH4 models is necessary to improve predictions across ecosystem and global scales. Such efforts are imperative because the prediction error can increase substantially with increased , especially for the relatively simple parameterization that only represents a generic Tair sensitivity of (Fig. 5c).
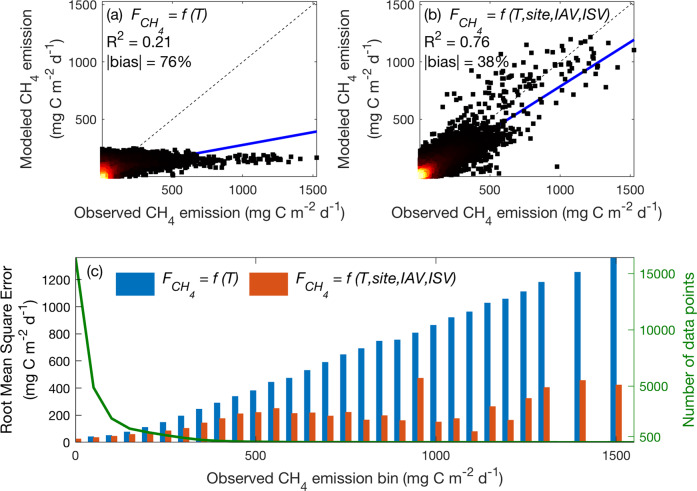
CH4 emission prediction error increases substantially as measured CH4 emission increases.
The performance of CH4 emissions modeled by the regression models that only include a universal emergent CH4 emission temperature dependence (a), and those that include site- and time-specific conditions (b). The root mean square errors associated with the regression models used in (a) and (b) (bars, left axis) and number of data points (green line, right axis) for measured CH4 emission bins (c). Two of the 27,130 daily observations have CH4 emission above 1600 mg C m−2 d−1, which are not shown for the ease of representation. Lighter colors in the density scatter plot represent denser data points. Solid blue and dashed black lines represent the linear best-fit and one-to-one lines, respectively. The abbreviations used in each model group represent air temperature (T), intra-seasonal variability (ISV), inter-site variability (site), and inter-annual variability (IAV).
Limitations and implications
Additional measurements and analysis of factors controlling methanogenesis, methanotrophy, and CH4 transport will be needed to investigate the cause of the predominantly positive seasonal hysteresis we observed across wetland and rice paddy sites. When anoxic conditions are prevalent and Tsoil is the most important driver regulating 26,27 (e.g., Supplemental Fig. 4), the observed positive seasonal hysteresis is consistent with the higher driven by higher substrate availability later in the frost-free season25. We identified some environmental drivers affecting the emergent –Tair dependence at sites where the necessary measurements were available: (1) When WTD drops below the critical zone of CH4 production later in the frost-free season31, the reduced FCH4 may drive negative seasonal hysteresis in a given site-year (e.g., the Kopuatai bog in New Zealand (NZ-Kop), Supplemental Fig. 3). (2) may become more sensitive to Tair changes under higher salinity48, and our results indicate that seasonal hysteresis shifts from positive to negative with increased salinity (e.g., the Sacramento-San Joaquin Delta of California in USA (US-Myb), Supplemental Fig. 17).
As for the emergent –Tsoil dependence, our results suggest that the functional relationship between and Tsoil may vary non-monotonically along the soil profile. For example, the positive seasonal hysteresis inferred from Tsoil measured at 16 cm depth is stronger than those at 8 and 32 cm depths at US-Myb (Supplemental Fig. 18). Such a non-monotonic relationship indicates that the magnitude of seasonal hysteresis is not simply caused by time lags between Tsoil and Tair, suggesting that factors other than temperature can strongly control . Tsoil measured at depths where methanogenesis is occurring will be needed to rigorously examine the emergent dependence of on Tsoil across the globe, but such depth-dependent measurements are not yet available among sites in the FLUXNET-CH4 database. To improve understanding of mechanisms leading to seasonal hysteresis, we urge further long-term measurements on factors modulating CH4 biogeochemistry (e.g., WTD, Tsoil, microbial activity, and substrate availability), especially in the tropics and the Southern Hemisphere, both of which are sparsely represented in the FLUXNET-CH4 database. Although seasonal hysteresis occurs across seasonal climate and latitudinal gradients (Supplemental Fig. 14), better-representing ecosystems south of 30 °N could affect the partitioning of negative and positive seasonal hysteresis inferred from existing measurements. While our synthesis in tropical and subtropical regions shows intra-seasonal changes in emergent –Tair dependence (Supplemental Fig. 19), future studies are needed to examine seasonal hysteresis in wetlands south of 30 °N (that account for about 75% of global wetland 6).
The observed seasonal hysteresis provides a benchmark to evaluate modeled functional responses and should inform and motivate CH4 model development and refinement. Studies have shown that temporal variations in are strongly modulated by substrate and microbial dynamics33,49,50, which may explain the substantial seasonal hysteresis identified in our wetland and rice paddy sites. For example, a model that explicitly represents substrate and microbial dynamics reproduced the observed hysteretic to temperature relationships in several wetlands with different vegetation and hydrological conditions33. Such dynamics could be parameterized in the terrestrial components of Earth system models49. Our synthesis thus provides observational evidence for incorporating substrate and microbial dynamics into next generation CH4 models.
Using the largest available database of ecosystem-scale CH4 emissions measured by eddy covariance flux towers, we show that the apparent relationships between CH4 emissions and air and soil temperatures are hysteretic and vary strongly with sampling location and measurement period. Approximately 77% of site-years recorded in the wetland and rice paddy subset of the FLUXNET-CH4 database40 show that CH4 emissions become higher later in the frost-free season at the same air temperature. This predominantly positive seasonal CH4 emission hysteresis may be driven by substrate-mediated higher CH4 production25 later in the frost-free season33. Changes in environmental conditions also modulate seasonal CH4 emission hysteresis and thus ecosystem-scale CH4 emissions.
Our results demonstrate that the relationship between CH4 emissions and temperature is an emergent property that varies substantially across space and time. A direct integration of measurements across the globe (e.g., inferring a generic temperature sensitivity of CH4 emissions) may not improve CH4 model parameterization because such an approach oversimplifies factors controlling CH4 emissions. Therefore, meta-analyses of CH4 biogeochemistry should recognize the large intra-seasonal, inter-annual, and inter-site variability of biotic and abiotic conditions that regulate ecosystem-scale CH4 emissions. Collectively, our analyses highlight the importance of observing and modeling spatial heterogeneity and temporal variability for the modeling of CH4 biogeochemistry. Since most existing CH4 models are developed using empirically based CH4 production or emission temperature dependencies29, our study motivates models to mechanistically represent methanogenesis, methanotrophy, and CH4 transport to refine estimates of global CH4 emissions and climate feedbacks51.
Methods
FLUXNET-CH4 database
The FLUXNET-CH4 initiative is led by the Global Carbon Project (https://www.globalcarbonproject.org) in coordination with regional flux networks (in particular AmeriFlux and the European Fluxes Database) to compile a global CH4 flux database of eddy covariance and supporting measurements encompassing freshwater, coastal, natural and managed wetlands, and uplands40. Database descriptions, including existing sites, data standardization, gap-filling, and partitioning, have been detailed previously in Knox et al.40. We used daily mean temperature (air and soil), gross primary productivity as partitioned from net CO2 exchange measurements, precipitation, WTD, wind speed, atmospheric pressure, and CH4 emissions compiled at the 48 wetland and rice paddy sites (Supplemental Table 1) currently recorded in the FLUXNET-CH4 database. Soil temperature is often measured at different depths among different sites, and only about half of the wetland sites report WTD in the current FLUXNET-CH4 database40. We analyzed the soil temperature reported at the shallowest and deepest measured soil layers at each site to investigate their effects on regulating CH4 emissions. The wetland and rice paddy data (207 site-years with 62,384 site-days as of this publication) were categorized into eight CH4 emitting ecosystem types: bog, fen, marsh, peat plateau, rice paddy, salt marsh, swamp, and wet tundra, based on previous classification52,53. While gap-filled data are examined, they are not included in our discussion to eliminate potential biases caused by the gap-filling procedure45.
Frost-free season
We define the frost-free season as the period when the observed temperature (air or soil) is >0 °C to investigate the emergent temperature responses to CH4 emissions () during the biologically active season across distinct climatic zones. Other data sampling thresholds, such as above-zero GPP and above 5% of annual GPP maximum, were examined, and positive seasonal hysteresis is identified in 68–81% of site-years (Supplemental Figs. 20, 21), consistent with those inferred from frost-free season. We chose to present the frost-free season results because substantial GPP (e.g., above 5% of annual GPP maximum) is detected when air temperature is well below 0 °C (Supplemental Fig. 22) that may complicate our discussion of varying led by temperature changes.
Emergent temperature dependence calculation and the hysteresis parameter
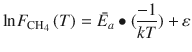
Emergent dependence of CH4 emission () on temperature (air or soil) is determined by fitting frost-free-season daily measurements of and air and soil temperatures with a quadratic equation (Eq. 1), the Boltzmann–Arrhenius equation (Eq. 2), and first, second, third, and fifth order polynomials. Daily estimates made by site- and time-specific emergent temperature (air or soil) dependence models based on the above-mentioned functional forms show comparable root mean square errors (Supplemental Fig. 2). Results inferred from the quadratic equation (Eq. 1) are selected because (1) its functional form is mathematically consistent with the second-order polynomial equation of temperature for methanogenesis inferred from the MacroMolecular Rate Theory54,55; and (2) it can prescribe seasonal hysteresis with a single site- and time- specific parameter (, defined below).
The fits based on the quadratic equation were forced to pass through the origin (assuming zero at 0 °C, discussed below) and measured at maximum seasonal temperature in each site-year using the Matlab (MathWorks Inc., 2019, version 9.7.0) polyfix function (downloaded from https://www.mathworks.com/matlabcentral/fileexchange/54207-polyfix-x-y-n-xfix-yfix-xder-dydx). The resulting emergent dependence of on temperature at any given time period can thus be represented as:
The symbols used in Eq. 1 denote CH4 emission (, mg C m−2 d−1), hysteresis parameter (, mg C m−2 d−1 °C−2), daily mean temperature (, °C; air or soil), maximum seasonal temperature (, °C), and CH4 emission measured at maximum seasonal temperature (, mg C m−2 d−1). Therefore, the functional relationship between and temperature, described by a quadratic equation (Eq. 1), is only determined by the value of hysteresis parameter () and site-year variables ().
The two constraints (passing through the origin and measured at maximum seasonal temperature) imposed in Eq. 1 are intended to force the two (earlier and later part of the frost-free season) emergent temperature (air or soil) dependencies to form a closed apparent hysteresis loop for each frost-free season. By doing so, seasonal hysteresis can be quantified as the normalized area enclosed by the two fits, and intra-seasonal changes can be consistently compared among site-years across distinct climate zones. Ignoring around 0 °C has small effects on the magnitude and distribution of seasonal hysteresis inferred from the current FLUXNET-CH4 database, although substantial may continue when air temperature is around or below 0 °C32,42. To quantify the effect of ignoring around 0 °C, we replaced the constraint of zero at 0 °C by the mean measured between −0.5 and 0.5 °C at 0 °C for each site-year, and found that the resulting patterns of seasonal hysteresis (Supplemental Fig. 23) are consistent with those assuming zero at 0 °C (Fig. 2).
Seasonal CH4 emission hysteresis
We apply a quadratic equation (Eq. 1) to calculate the emergent dependence of CH4 emission () on temperature at the earlier () and later () part of the frost-free season separated by maximum seasonal temperature (). Two metrics are used to quantify the observed seasonal hysteresis: (1) Normalized area of seasonal hysteresis (), defined as the area enclosed by emergent dependencies of on temperature inferred from earlier and later parts of the frost-free season (i.e., ); and (2) mean seasonal hysteresis (), defined as the difference between mean daily inferred from measurements taken between later and earlier parts of the frost-free season. In each site-year, positive seasonal hysteresis occurs when higher are measured later in the frost-free season at a given air or soil temperature. Hysteretic patterns are similar when using either air temperatures (Fig. 1) or soil temperatures (Supplemental Fig. 4), and with either gap-filled (Supplemental Fig. 5) or non-gap-filled (Fig. 1) 45. Results derived from air temperature (Fig. 2), soil temperature measured at the shallowest soil layer (Supplemental Fig. 12), and soil temperature measured at the deepest soil layer (Supplemental Fig. 13) all indicate predominantly positive seasonal hysteresis across the wetland and rice paddy sites. We chose to present results derived from air temperature for its longer and more continuous record in the wetland and rice paddy subset of FLUXNET-CH4 database, although soil temperature has been shown to be a better predictor for 33,42. Specifically, there are 207, 112, and 97 site-years of measurements of air temperature, soil temperature measured at the sallowest soil layer (0–18.3 cm), and soil temperature measured at the sallowest soil layer (32–50 cm), respectively.
Temperature dependence model groups
The measurements extracted from the FLUXNET-CH4 database were analyzed by seven air temperature (Tair) dependence model groups (six regression models and a hybrid model) to evaluate factors modulating CH4 emission predictions. We design the six regression models to selectively represent the effects of ecosystem-site variability and ecosystem-type variability on CH4 emission prediction by labeling data points into different groups. The relationship between CH4 emission and Tair is analyzed at each part of the frost-free season, each site-year, each site, and each ecosystem type to quantify intra-seasonal, inter-annual, inter-site, and ecosystem-type variability, respectively (Supplemental Table 2). For the hybrid model, we use the hysteresis parameter predicted by our random-forest model to inform the quadratic equation (Eq. 1) for CH4 emission estimates. The performance of each Tair dependence model group was evaluated to determine the most important model components required for accurate CH4 emission estimates.
Random-forest model selection
We used random-forest model selection to identify the most important predictors of the hysteresis parameter (Eq. 1) that determines the functional form of emergent CH4 emission air temperature dependence and thereby wetland CH4 emissions (). Instead of , the hysteresis parameter was analyzed, so the results can provide useful information on the source of observed hysteresis with an understandable functional form (Eq. 1). Moreover, the most important predictors identified by the machine-learning approach can be compared with the results derived from the other approach using a range of temperature dependence model groups (Supplemental Table 2).
Ten potential predictors were selected for their relatively high predictor importance to : seasonal branch (i.e., earlier or later part in the frost-free season), GPP cumulated in a seasonal branch, precipitation cumulated in a seasonal branch, maximum seasonal temperature, mean temperature in a seasonal branch, ecosystem type, latitude, site, site-year, and measured at maximum seasonal temperature. Other potential predictors, including observational year, mean WTD in a seasonal branch, mean wind speed in a seasonal branch, and mean atmospheric pressure in a seasonal branch were examined and showed limited predictive power on . Four potential predictors (seasonal branch, ecosystem type, site, and site-year) were labeled as categorical data and the rest were labeled as numerical data in our random-forest model. The random-forest model selection was performed by the Statistics and Machine-Learning Toolbox in Matlab (MathWorks Inc., 2019, version 9.7.0).
Apparent activation energy for CH4 emissions
We quantify the apparent activation energy for CH4 emissions by fitting frost-free-season daily measurements of CH4 emission and air temperature with the Boltzmann–Arrhenius equation of the form:
Supplementary information
The online version contains supplementary material available at 10.1038/s41467-021-22452-1.
Acknowledgements
This research was supported by the RUBISCO SFA of the Regional and Global Modeling Analysis (RGMA) program in the Climate and Environmental Sciences Division (CESD) of the Biological and Environmental Research (BER) Program in the U.S. Department of Energy Office of Science under contract DE-AC02-05CH11231. This work was also conducted as a part of the Wetland FLUXNET Synthesis for Methane Working Group supported by the John Wesley Powell Center for Analysis and Synthesis of the U.S. Geological Survey. Funding for AmeriFlux data resources was provided by the U.S. Department of Energy’s Office of Science. The compilation of the FLUXNET-CH4 data is supported by the Gordon and Betty Moore Foundation through Grant GBMF5439 “Advancing Understanding of the Global Methane Cycle” to Stanford University supporting the Methane Budget activity for the Global Carbon Project (globalcarbonproject.org). Observations at US-OWC were supported by the U.S. Department of Energy (DE-SC0021067), ODNR (Subaward N18B 315-11), and OWDA (7880). SE-Deg and SE-Sto have received funding from Swedish Research Council (ICOS-SE, grant no. 2015-06020). B.R.K.R. was supported by NSF Award 1752083. T.F.K. acknowledges support from the RUBISCO SFA, and additional support from a DOE Early Career Research Program award #DE-SC0021023. W.O. and D.Z. acknowledge support from NASA ABOVE NNX16AF94A, NSF OPP 1204263 and 1702797, EU H2020 INTAROS 629727890, and NERC UAMS NE/P002552/1. W.O. was supported by NOAA CESSRST NA16SEC4810008. N.J.S. acknowledges funding from Academy of Finland through Grant 296887. L.W.M. was supported by the LandCarbon Program of the U.S. Geological Survey. A.R.D. acknowledges DOE Ameriflux Network Management Project award to ChEAS core site cluster and NSF 0845166 for US-Los. M.U. was supported by JSPS KAKENHI (20K21849) and the Arctic Challenge for Sustainability II (ArCS II; JPMXD1420318865). E.S.T. acknowledges Academy of Finland (project codes 287039 and 330840). M.K. was supported by the National Research Foundation of Korea (NRF-2018 R1C1B6002917). C.T. thanks to the support of the E-SHAPE EU H2020 project (GA 820852). D.P. thanks the support of the DIBAF-Landscape 4.0 Departments of Excellence-2018 Program of the Italian Ministry of Research. Any use of trade, firm, or product names is for descriptive purposes only and does not imply endorsement by the U.S. Government. We acknowledge the FLUXNET-CH4 contributors for the data provided in our analyses.
Author contributions
All authors contributed to this work. K.Y.C. and W.J.R. designed the analysis, K.Y.C. performed the analysis, and K.Y.C. and W.J.R. analyzed the results and wrote the paper, with inputs from all authors. M.A., D.B., G.B., D.I.C., A.C., A.R.D., E.E., T.F., M.G., M.H., K.S.H., T.H., H.I., M.K., K.W.K., A.L., I.M., B.M., A.M., M.B.N., A.N., W.C.O., M.P., M.L.R., J.R., B.R.K.R., Y.R., T.S., K.V.R.S., H.P.S., N.S., O.S., A.C.I.T., E.S.T., M.U., R.V., T.V., L.W.M., and D.Z. collected the observations. S.H.K., R.B.J., G.M., B.P., S.B., H.C., K.B.D., T.K., D.P., M.T., C.T., and Z.Z. build and maintain the FLUXNET-CH4 database.
Data availability
This work used publicly available FLUXNET-CH4 Dataset acquired and shared by the FLUXNET community. All related data is publicly available for download at https://fluxnet.org/.
Code availability
Code used in the analysis presented in this study is available online, and can be accessed at https://github.com/ckychang/FCH4_hysteresis56.
Competing interests
The authors declare no competing interests.
References
1.
2.
3.
4.
5.
6.
7.
8.
9.
10.
11.
12.
13.
14.
15.
16.
17.
18.
19.
20.
21.
22.
23.
24.
25.
26.
27.
28.
29.
30.
31.
32.
33.
34.
35.
36.
37.
38.
39.
40.
41.
42.
43.
44.
45.
46.
47.
48.
49.
50.
51.
52.
53.
54.
55.
56.