
Mechanical sources of nonlinear damping play a central role in modern physics, from solid-state physics to thermodynamics. The microscopic theory of mechanical dissipation suggests that nonlinear damping of a resonant mode can be strongly enhanced when it is coupled to a vibration mode that is close to twice its resonance frequency. To date, no experimental evidence of this enhancement has been realized. In this letter, we experimentally show that nanoresonators driven into parametric-direct internal resonance provide supporting evidence for the microscopic theory of nonlinear dissipation. By regulating the drive level, we tune the parametric resonance of a graphene nanodrum over a range of 40–70 MHz to reach successive two-to-one internal resonances, leading to a nearly two-fold increase of the nonlinear damping. Our study opens up a route towards utilizing modal interactions and parametric resonance to realize resonators with engineered nonlinear dissipation over wide frequency range.
Nonlinear dissipation is frequently observed in nanomechanical resonators, but its microscopic origin remains unclear. Here, nonlinear damping is found to be enhanced in graphene nanodrums close to internal resonance conditions, providing insights on the mechanisms at the basis of this phenomenon.
In nature, from macro- to nanoscale, dynamical systems evolve towards thermal equilibrium while exchanging energy with their surroundings. Dissipative mechanisms that mediate this equilibration convert energy from the dynamical system of interest to heat in an environmental bath. This process can be intricate, nonlinear, and in most cases hidden behind the veil of linear viscous damping, which is merely an approximation valid for small amplitude oscillations.
In the last decade, nonlinear dissipation has attracted much attention with applications that span nanomechanics1, materials science2, biomechanics3, thermodynamics4, spintronics,5 and quantum information6. It has been shown that the nonlinear dissipation process follows the empirical force model where τnl1 is the nonlinear damping coefficient, x is the displacement, and velocity. To date, the physical mechanism from which this empirical damping force originates has remained ambiguous, with a diverse range of phenomena being held responsible including viscoelasticity7, phonon–phonon interactions8,9, Akheizer relaxation10, and mode coupling11. The fact that nonlinear damping can stem from multiple origins simultaneously makes isolating one route from the others a daunting task, especially since the nonlinear damping coefficient τnl1 is perceived to be a fixed parameter that unlike stiffness12–14, quality factor15, and nonlinear stiffness16–18, cannot be tuned easily.
Amongst the different mechanisms that affect nonlinear damping, intermodal coupling is particularly interesting, as it can be enhanced near internal resonance (IR), a special condition at which the ratio of the resonance frequencies of the coupled modes is a rational number19. This phenomenon has frequently been observed in nano/micromechanical resonators20–29. At IR, modes can interact strongly even if their nonlinear coupling is relatively weak. Interestingly, IR is closely related to the effective stiffness of resonance modes, and can therefore be manipulated by careful engineering of the geometry of mechanical systems, their spring hardening nonlinearity30,31, and electrostatic spring softening29. IR also finds its route in the microscopic theory of dissipation proposed back in 1975, where it was hypothesized to lead to a significantly shorter relaxation time if there exists a resonance mode in the vicinity of twice the resonance frequency of the driven mode in the density of states32.
Here, we demonstrate that nonlinear damping of graphene nanodrums can be strongly enhanced by parametric–direct IR, providing supporting evidence for the microscopic theory of nonlinear dissipation10,32. To achieve this, we bring the fundamental mode of the nanodrum into parametric resonance at twice its resonance frequency, allowing it to be tuned over a wide frequency range from 40 to 70 MHz. We extract the nonlinear damping as a function of the parametric drive level, and observe that it increases as much as 80% when the frequency shift of the parametric resonance brings it into IR with a higher mode. By comparing the characteristic dependence of the nonlinear damping coefficient on parametric drive to a theoretical model, we confirm that IR can be held accountable for the significant increase in nonlinear damping.
Experiments are performed on a 10 nm thick multilayer graphene nanodrum with a diameter of 5 µm, which is transferred over a cavity etched in a layer of SiO2 with a depth of 285 nm. A blue laser is used to thermomechanically actuate the membrane, where a red laser is being used to detect the motion, using interferometry (see “Methods” for details). A schematic of the setup is shown in Fig. 1a.

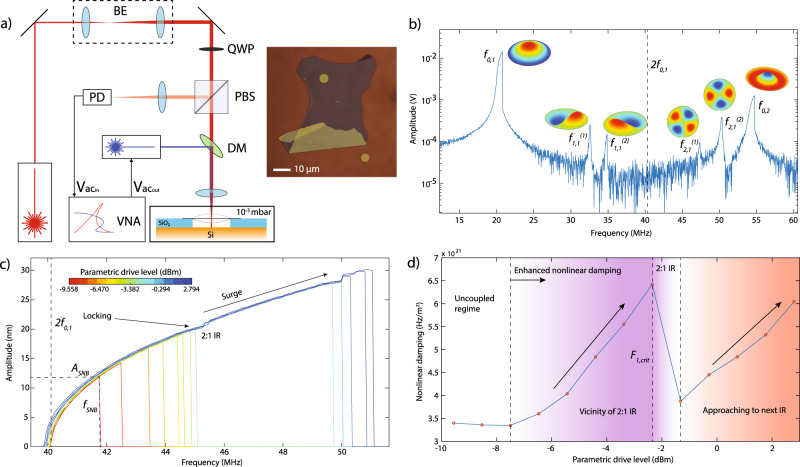
Nonlinear dynamic response of a graphene nanodrum near 2:1 internal resonance.
a Fabry–Pérot interferometry with thermomechanical actuation and microscope image of the graphene. Experiments are performed in vacuum at 10−3 mbar. Red laser is used to detect the motion of the graphene drum and the blue laser is used to optothermally actuate it. BE beam expander, QWP quarter wave plate, PBS polarized beam splitter, PD photodiode, DM dichroic mirror, VNA vector network analyzer, analyzer port, excitation port. In the device schematic, Si and SiO2 layers are represented by orange and blue colors, respectively. b Direct frequency response curve of the device (motion amplitude vs. drive frequency), showing multiple resonances (drive level = −12.6 dBm). The mode shapes are simulated by COMSOL. Resonance peaks are associated with where m represents the number of nodal diameters, n nodal circles, and k = 1, 2 stand for the first and second asymmetric degenerate modes. Dashed line shows 2f0,1, which is the drive frequency where the parametric resonance of mode f0,1 is activated. c Parametric resonance curves (calibrated motion amplitude vs. drive frequency), driven at twice the detection frequency. As the parametric resonance curves approach the 2:1 internal resonance (IR), fSNB first locks to 2:1 IR frequency and consecutively saddle-node bifurcation surges to a higher frequency and amplitude. ASNB and fSNB stand for the amplitude and frequency of saddle-node bifurcation. d Variation of the nonlinear damping τnl1 as a function of drive F1. Dashed lines represent different regimes of nonlinear damping. White region represents a constant nonlinear damping, purple region an increase in nonlinear damping in the vicinity of 2:1 IR and orange region an increase in nonlinear damping due to IR with a higher mode.
By sweeping the drive frequency, we obtain the frequency response of the nanodrum in which multiple directly driven resonance modes can be identified (Fig. 1b). We find the fundamental axisymmetric mode of vibration at f0,1=20.1 MHz and several other modes, of which the two modes, at = 47.4 MHz and = 50.0 MHz, are of particular interest. This is because, to study the effect of IR on nonlinear damping, we aim to achieve a 2:1 IR by parametrically driving the fundamental mode, such that it coincides with one of the higher frequency modes. The frequency ratios and are close to the factor 2, however additional frequency tuning is needed to reach the 2:1 IR condition.
The parametric resonance can be clearly observed by modulating the tension of the nanodrum at frequency ωF with the blue laser while using a frequency converter in the vector network analyzer (VNA) to measure the amplitude at ωF/2 as shown in Fig. 1c. By increasing the parametric drive, we observe a Duffing-type geometric nonlinearity over a large frequency range, such that the parametrically driven fundamental resonance can be tuned across successive 2:1 IR conditions with modes and , respectively.
In Fig. 1c, we observe that the parametric resonance curves follow a common response until they reach the saddle-node bifurcation frequency fSNB above which the parametric resonance curve reaches its peak amplitude ASNB and drops down to low amplitude. We note that the value of ASNB can be used to determine the degree of nonlinear damping33. Therefore, to extract the nonlinear damping coefficient τnl1 of mode f0,1 from the curves in Fig. 1c, we use the following single-mode model to describe the system dynamics

As we gradually increase the drive level, fSNB increases until it reaches the vicinity of the IR, where we observe an increase in τnl1 (Fig. 1d). Whereas fSNB increases with parametric drive F1, Fig. 1c shows that its rate of increase slows down close to , locking the saddle-node bifurcation frequency when fSNB ≈ 45 MHz. At the same time, τnl1 increases significantly at the associated parametric drive levels, providing the possibility to tune nonlinear damping up to twofolds by controlling F1, as seen in Fig. 1d.
Figure 1c also shows that above a certain critical parametric drive level F1,crit, the frequency locking barrier at fSNB ≈ 45 MHz is broken and fSNB suddenly jumps to a higher frequency (≈5 MHz higher), and a corresponding larger ASNB. We label this increase in the rate by “surge” in Fig. 1c, where an abrupt increase in the amplitude–frequency response is observed to occur above a critical drive level F1,crit. Interestingly, even above F1,crit a further increase in τnl1 is observed with increasing drive amplitude, indicating that a similar frequency locking occurs when the parametric resonance peak reaches the second IR at . Similar nonlinear phenomena are also showcased in a second nanodrum undergoing parametric–direct modal interaction, confirming the reproducibility of the observed physics (see Supplementary Note II).
Although the single-mode model in Eq. (1) can capture the response of the parametric resonance, it can only do so by introducing a nonphysical drive level dependent nonlinear damping coefficient τnl1(F1) (Fig. 1d). Therefore, to study the physical origin of our observation, we extend the model by introducing a second mode whose motion is described by generalized coordinate x2. Moreover, to describe the coupling between the interacting modes at the 2:1 IR, we use the single term coupling potential (see Supplementary Note III). The coupled equations of motion in the presence of this potential become
The two-mode model describes a parametrically driven mode with generalized coordinate x1 coupled to x2 that has eigenfrequency , damping ratio τ2, and is directly driven by a harmonic force with magnitude F2.
To understand the dynamics of the system observed experimentally and described by the model in Eq. (2), it is convenient to switch to the rotating frame of reference by transforming x1 and x2 to complex amplitude form (see Supplementary Note IV). This transformation reveals a system of equations that predicts the response of the resonator as the drive parameters (F1, F2, and ωF) are varied. Solving the coupled system at steady state yields the following algebraic equation for the amplitude a1 of the first mode
To understand the physics associated with the frequency locking and amplitude–frequency surge, we use the experimentally extracted fit parameters from the two-mode model and numerically generate parametric resonance curves using Eq. (3) for a large range of drive amplitudes (see Fig. 2a). We see that for small drive levels, an upward frequency sweep will follow the parametric resonance curve and then will lock and jump down at the first saddle-node bifurcation (SNB1) frequency, which lies close to . At higher parametric drive levels, the parametric resonance has a stable path to traverse the IR toward a group of stable states at higher frequencies.
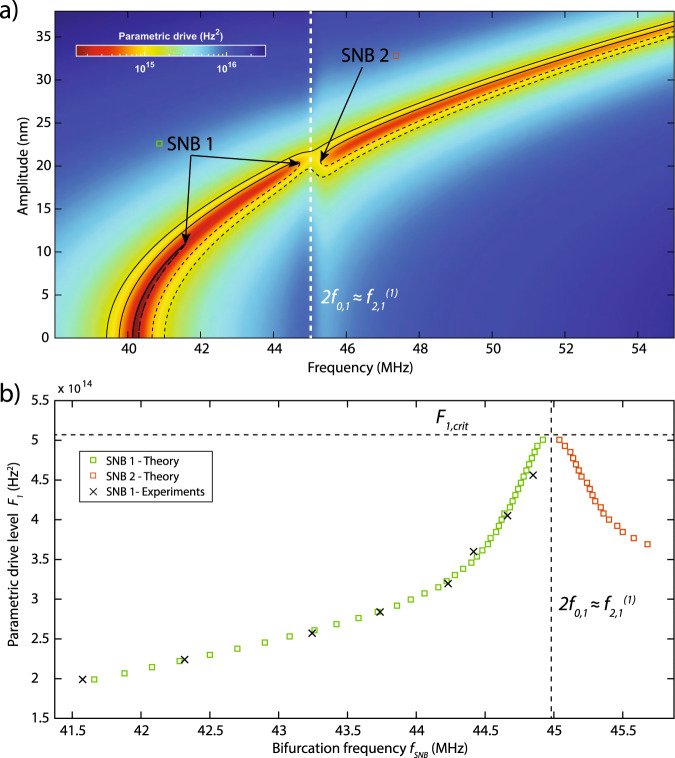
Parametric–direct internal resonance.
a Color map of the analytical model response curves obtained by using the fitted parameters from experiments. Colors correspond to frequency response (motion amplitude vs. drive frequency) solutions with a certain parametric drive level. Black lines show samples from these solutions where solid lines are stable and dashed lines are unstable solutions. White dashed line is where parametric resonance meets with interacting mode and undergoes internal resonance. b The underlying route of the amplitude–frequency surge is revealed by tracing the evolution of saddle-node bifurcations (green and red squares represent theoretical SNB1 and SNB2, whereas experimental SNB1 is represented by crosses) of the parametric resonance curves.
A more extensive investigation of this phenomenon can be carried out by performing bifurcation analysis of the steady-state solutions (see Supplementary Note IV). The bifurcation analysis reveals two saddle-node bifurcations near the singular region of the IR, one at the end of the first path (SNB1) and another at the beginning of the second path (SNB2) (Fig. 2b). As the drive amplitude increases, the bifurcation pair starts to move toward each other until they annihilate one another to form a stable solution at the connecting point, which we labeled as “surge.” It is also possible to observe that the rate at which saddle-node pairs approach each other dramatically drops near the IR condition, demonstrating the “locking” which we also observed in the experiments.
To check how closely the two-mode model captures the variation of τnl1 close to the IR condition, we follow a reverse path, and fit the numerically generated resonance curves of Fig. 2a using the single-mode model of Eq. (3) with τnl1 as the fit parameter. In this way, we track the variation of τnl1 in the single-mode model with the parametric drive F1, similar to what we observed experimentally and reported in Fig. 1c. The result of this fit is shown in Fig. 3a, where a similar anomalous change of nonlinear damping is obtained for the two-mode model.
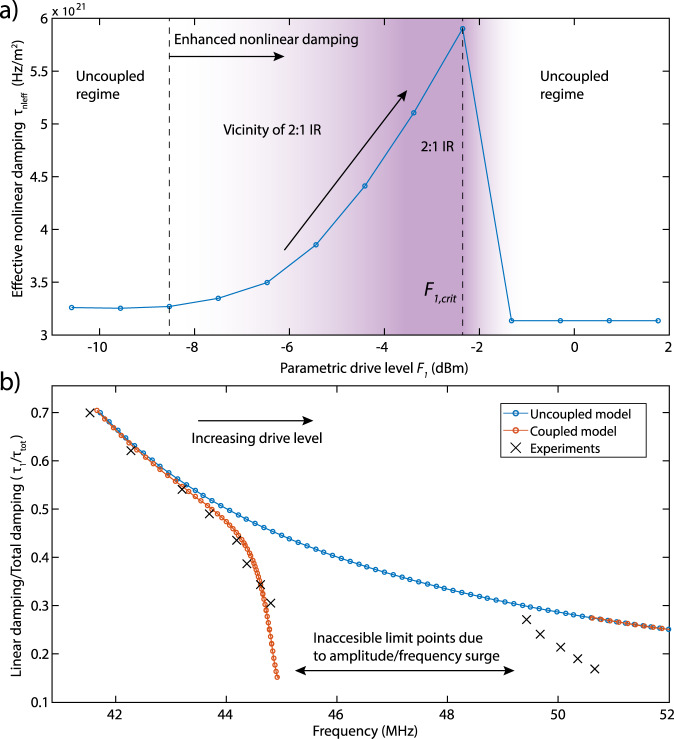
Measurements and fits of the effective nonlinear damping.
a Variation of the effective nonlinear damping parameter (τnleff) with respect to parametric drive. The τnleff is obtained by fitting the numerically generated curves of Fig. 2a as the fit parameter. Dashed lines represent different regimes of nonlinear damping. White regions represent a constant nonlinear damping and purple region represents an increase in nonlinear damping in the vicinity of 2:1 IR. b Comparison of the ratio between linear damping (τ1) and total damping (τtot). In the figure, blue and red dashed lines represent τ1/τtot obtained from uncoupled and coupled models, whereas black crosses represent experiments.
The variation of nonlinear damping affects the total damping (sum of linear and nonlinear dissipation) of the resonator too. It is of interest to study how large this effect is. In Fig. 3b, we report the variation in the ratio of the linear damping τ1 and the amplitude-dependent total damping τtot = (ω1/Q + 0.25τnleff∣x1∣2)33 in the spectral neighborhood of , and observe a sudden decrease in the vicinity of IR. This abrupt change in the total damping is well captured by the two-mode model. With the increase in the drive amplitude, τ1/τtot values of this model though deviate from those of the experiments due to a subsequent IR at that is not included in our theoretical analysis. The dependence of τ1/τtot on frequency shows that near IR, the total damping of the fundamental mode increases nearly by 80%. We note that increased nonlinear damping near IR was also observed in Güttinger et al.11. In that work, nonlinear damping was studied using ringdown measurements, with two modes brought close to an IR by electrostatic gating. The increased nonlinear damping was attributed to a direct–direct 3:1 IR, which as shown theoretically in Shoshani et al.24 leads to a high order (quintic) nonlinear damping term. Conversely, in our work, two modes are brought into parametric–direct 2:1 IR by adjusting the parametric drive level. This results in a nonlinear damping term that already comes into play at smaller amplitudes because it is of lower (cubic) order, as discussed in Shoshani et al.24. Moreover, the nonlinear damping mechanism in Güttinger et al.11 is approximately described by two exponential decays with crossovers from (τ1 + τ2)/2 to τ1, which implies that similar to Shoshani et al.24, τ2 > τ1 is required to observe positive nonlinear damping. This is in contrast with the damping mechanism we describe, where the effective nonlinear damping actually increases for smaller τ2 (see Eq. (3)).
Since the tension of the nanodrum can be manipulated by laser heating, we can further investigate the tunability of the nonlinear damping by increasing the laser power and detecting the range over which 2:1 IR conditions may occur. When increasing the blue laser power and modulation, we observe the parametrically actuated signal also in the direct detection mode (like in Fig. 1b) due to optical readout nonlinearities35. As a result a superposition of Fig. 1b, c is obtained, as shown in Fig. 4. We note that the enhanced laser power increases membrane tension which moves f0,1 upward by a few MHz, but also allows us to reach even higher parametric modulation. In this configuration, we achieve a frequency shift in fSNB from 40 to 70 MHz, corresponding to as much as 75% tuning of the mechanical motion frequency. This large tuning can increase the number of successive IRs that can be reached even further, to reach modal interactions between the parametric mode f0,1 and direct modes and f0,2 (see Fig. 4). As a result, multiple amplitude–frequency surges can be detected in the large frequency range of 30 MHz over which nonlinear damping coefficient can be tuned.
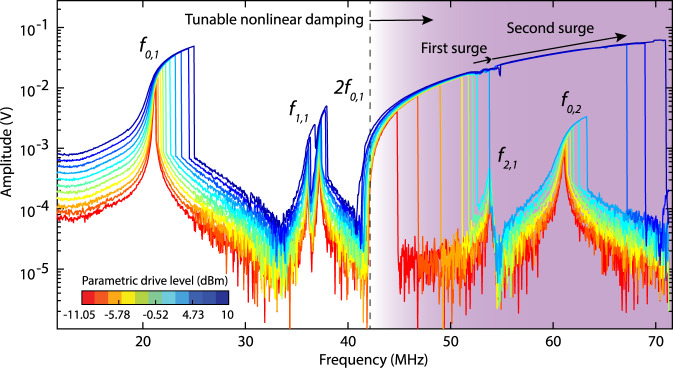
Nonlinear frequency response measurements at high drive powers.
The parametric resonance interacts successively with multiple directly driven modes of vibration. The arrows in the figure show successive amplitude–frequency surges. Starting from the dashed line, shaded area represents the region where nonlinear damping is tunable.
In summary, we study the tunability of nonlinear damping in a graphene nanomechanical resonator, where the fundamental mode is parametrically driven to interact with a higher mode. When the system is brought near a 2:1 IR, a significant increase in nonlinear damping is observed. In addition, the rate of increase of the parametric resonance frequency reduces in a certain locking regime, potentially stabilizing the values of fSNB and ASNB, which could potentially aid frequency noise reduction21. Interestingly, as the drive level is further increased beyond the critical level F1,crit, this locking barrier is broken, resulting in a surge in fSNB and amplitude of the resonator. These phenomena were studied experimentally, and could be accounted for using a two-mode theoretical model. The described mechanism can isolate and differentiate mode coupling induced nonlinear damping from other dissipation sources, and sheds light on the origins of nonlinear dissipation in nanomechanical resonators. It also provides a way to controllably tune nonlinear damping which complements existing methods for tuning linear damping15, linear stiffness,12–14 and nonlinear stiffness16–18, extending our toolset to adapt and study the rich nonlinear dynamics of nanoresonators.
Devices are fabricated using standard electron-beam (e-beam) lithography and dry etching techniques. A positive e-beam resist (AR-P-6200) is spin coated on a Si wafer with 285 nm of thermally grown SiO2. The cavity patterns ranging from 2 to 10 µm in diameter are exposed using the Vistec EBPG 5000+ and developed. The exposed SiO2 are subsequently etched away in a reactive ion etcher using a mixture of CHF3 and Ar gas until all the SiO2 is etched away and the Si exposed. Graphene flakes are then exfoliated from natural crystal and dry transferred on top of cavities.
The experiments are performed at room temperature in a vacuum chamber (10−3 mbar). A power modulated blue laser (λ = 405 nm) is used to thermomechanically actuate the nanodrum. The motion is then readout by using a red laser (λ = 633 nm) whose reflected intensity is modulated by the motion of the nanodrum in a Fabry–Pérot etalon formed by the graphene and the Si back mirror (Fig. 1a). The reflected red laser intensity from the center of the drum is detected using a photodiode, whose response is read by the same VNA that modulates the blue laser. The measured VNA signal is then converted to displacement in nanometers using a nonlinear optical calibration method35 (see Supplementary Note VII).
The online version contains supplementary material available at 10.1038/s41467-021-21334-w.
The authors would like to thank Prof. Marco Amabili for fruitful discussions about nonlinear damping. The research leading to these results received funding from European Union’s Horizon 2020 research and innovation program under Grant Agreement 802093 (ERC starting grant ENIGMA). O.S. acknowledges support for this work from the United States–Israel Binational Science Foundation under Grant No. 2018041. P.G.S. and H.S.J.v.d.Z. acknowledge funding from the European Union’s Horizon 2020 research and innovation program under grant agreement numbers 785219 and 881603 (Graphene Flagship).
A.K., O.S., H.S.J.v.d.Z., P.G.S., and F.A. conceived the experiments; A.K. fabricated the graphene samples and conducted the measurements; M.L. fabricated the chips with cavities; O.S. built the theoretical model; O.S. and A.K. performed the fitting; A.K., O.S., P.G.S. and F.A. did data analysis and interpretation; F.A. supervised the project; and the manuscript was written by A.K. and F.A. with inputs from all authors.
The data that support the findings of this study are available from the corresponding authors upon request.
The authors declare no competing interests.
1.
2.
3.
4.
5.
6.
7.
8.
9.
10.
11.
12.
13.
14.
15.
16.
17.
18.
19.
20.
21.
22.
23.
24.
25.
26.
27.
28.
29.
30.
31.
32.
33.
34.
35.
 Tuning nonlinear damping in graphene nanoresonators by parametric–direct internal resonance
 Facebook
 Twitter
 Linkedin
 Whatsapp

