 Effects of Cytokines on Nuclear Factor-Kappa B, Cell Viability, and Synaptic Connectivity in a Human Neuronal Cell Line
Molecular psychiatry

Co-senior authors

- Altmetric
Maternal infection during pregnancy is associated with increased risk of psychiatric and neurodevelopmental disorders (NDDs). Experimental animal models demonstrate that maternal immune activation (MIA) elevates inflammatory cytokine levels in the maternal and fetal compartments and causes behavioral changes in offspring. Individual cytokines have been shown to modulate neurite outgrowth and synaptic connectivity in cultured rodent neurons, but whether clinically relevant cytokine mixtures similarly modulate neurodevelopment in human neurons is not known. To address this, we quantified apoptosis, neurite outgrowth, and synapse number in the LUHMES human neuronal cell line exposed to varying concentrations of: (1) a mixture of 12 cytokines and chemokines (EMA) elevated in mid-gestational serum samples from mothers of children with autism and intellectual disability; (2) an inflammatory cytokine mixture (ICM) comprised of 5 cytokines elevated in experimental MIA models; or (3) individual cytokines in ICM. At concentrations that activated nuclear factor-kappa B (NF-κB) in LUHMES cells, EMA and ICM induced caspase-3/7 activity. ICM altered neurite outgrowth, but only at concentrations that also reduced cell viability, whereas ICM reduced synapse number independent of changes in cell viability. Individual cytokines in ICM phenocopied the effects of ICM on NF-κB activation and synaptic connectivity, but did not completely mimic the effects of ICM on apoptosis. These results demonstrate that clinically relevant cytokine mixtures modulate apoptosis and synaptic density in developing human neurons. Given the relevance of these neurodevelopmental processes in NDDs, our findings support the hypothesis that cytokines contribute to the adverse effects of MIA on children.
INTRODUCTION
Numerous epidemiological studies have identified maternal infection and fever during pregnancy as risk factors for psychiatric and neurodevelopmental disorders (NDDs) [1,2]. Other conditions featuring increased maternal inflammation [3], such as obesity [4,5] and autoimmune disease [6,7], have also been linked to increased risk of having a child with a NDD. Experimental animal data confirms the link between maternal immune activation (MIA) and behavioral deficits in offspring [8,9]. Common to these conditions are increased levels of maternal cytokines. Studies of multiple independent cohorts have identified an association between altered maternal gestational serum cytokines and adverse neurodevelopmental outcomes in the child [10,11]. In experimental models, MIA increases levels of inflammatory cytokines, including tumor necrosis factor-alpha (TNF-α), interleukin-6 (IL-6), IL-1β, IL-17A, and interferon-gamma (IFN-γ) in maternal serum, the placenta, amniotic fluid, and fetal brain after immune insult [8,12–15], and specific cytokines, for example IL-1 [16], IL-6 [17], and IL-17A [13], have been identified as essential in mediating the effects of MIA on offspring behavior.
Based on such observations, it is widely posited that cytokine induction contributes to the adverse effects of MIA on neurodevelopment [18]. However, the mechanistic link(s) between cytokine induction and behavioral outcomes remain speculative. Cytokines and chemokines, diffusible signaling molecules classically known for their roles in immunity [19], are important in regulating normal brain development and function [20,21]. Data from experimental animal models have shown that cytokines and chemokines can influence neuronal migration [22], proliferation [23], survival [24,25], differentiation [26], neurite outgrowth [27,28], synaptic activity [29,30], and behavior [31,32]. These neurodevelopmental processes are critical determinants of neuronal connectivity, disruption of which is implicated in the pathogenesis of many NDDs [33]. These observations suggest a model in which cytokines induced by MIA interfere with one or more neurodevelopmental processes to modulate normal patterns of neuronal connectivity, resulting in altered behavior.
Testing this model requires identifying specific neurodevelopmental processes modified by cytokines of clinical relevance to MIA. To date, much of the research on this issue has used animal models. While this has generated important mechanistic insights, its translational relevance to humans has yet to be assessed. Moreover, human models are required to screen human cytokines or serum because cytokine receptor interactions and responses are generally species-specific [34,35]. Recently, human stem cells have been used to study the effects of individual cytokines [36,37]. However, there have yet to be any studies of clinically relevant cytokine mixtures on human neurons. Therefore, for this study, we used LUHMES cells, a human neuronal cell line that has emerged as a robust model for studying neurotoxic impacts on neuronal cell differentiation [38,39]. LUHMES cells are a subclone of the conditionally-immortalized, human female mesencephalic-derived cell line MESC2.10, with features of dopaminergic neurons [40]. Proliferating cells rapidly differentiate into mono-cultures that express neuronal markers and extend long neurites [41].
LUHMES cells were used to screen neuronal apoptosis, neurite outgrowth, and synapse number following exposure to cytokines individually or as clinically relevant mixtures. The latter were based on findings from the Early Markers for Autism (EMA) study that identified 12 cytokines and chemokines (Supplementary Table 1) significantly elevated in the serum of pregnant women who later gave birth to a child with autism spectrum disorder and intellectual disability (ASD+ID) but not in women who gave birth to children with other diagnostic outcomes [42]. We further tested the response of LUHMES cells to a mixture (ICM, Supplementary Table 2) of inflammatory cytokines (TNF-α, IFN-γ, IL-6, IL-1β, and IL-17A) found in the EMA profile and elevated in MIA models. The results from these studies indicate that inflammatory cytokines promote apoptosis and alter synaptic connectivity in developing human neurons.
MATERIALS AND METHODS
For complete listing of materials, see Supplementary Tables 3–5; detailed protocols for cell culture, immunocytochemistry, qPCR, and imaging, see Supplementary Methods.
Materials
Recombinant human cytokines were purchased from PeproTech (Rocky Hill, NJ, USA) and reconstituted according to the manufacturer’s instructions for extended storage. Vehicle was 0.1% bovine serum albumin in phosphate buffered saline (PBS). Most cell culture reagents were purchased from Millipore Sigma (Burlington, MA, USA) and Thermo Fisher (Waltham, MA, USA).
LUHMES Cell Culture
LUHMES (LUnd Human MESencephalic) cells (RRID:CVCL_B056) [41] were obtained from Dr. Marcel Leist (University of Konstanz, Germany). Cell identity was authenticated by short tandem repeat profiling, and mycoplasma contamination was confirmed to be absent using Genetica Cell Line Testing (Burlington, NC, USA) in addition to in-house monitoring using the MycoAlert Plus Mycoplasma Detection kit (Lonza, Morristown, NJ, USA). LUHMES cell cultures were maintained and differentiated as described [39,41,43] and used for experiments between passages 10 to 20 with new cells thawed for each replicate. For experiments using the NF-κB nuclear translocation inhibitor TPCA-1, cells were pretreated for at least 30 min prior to the addition of ICM. Experimental groups were assigned to columns or wells, and plate maps were rearranged each experiment.
Immunocytochemistry (ICC)
For NF-κB experiments, D2 and D6 LUHMES cells were fixed 30 min after exposure to cytokines, and immunostained for NF-κB subunit p65 and Beta IIII Tubulin (TUBB3). To analyze synaptic puncta, D2 cells were re-plated onto precoated glass coverslips in 24-well plates at 300,000 cells/well in complete DM. Cells were exposed to cytokines or controls in DM on D4 for 72 h, and on D7, cells were fixed and immunostained for microtubule associated protein 2 (MAP2), postsynaptic density protein-95 (PSD-95), synaptophysin, and DAPI.
Quantitative Real-Time Polymerase Chain Reaction (qPCR)
D2 LUHMES cells were plated at 1×10⁶ cells/well in precoated 6-well plates and exposed to cytokines (in DMII) from D2 to D4 or D4 to D6. qPCR was performed using PrimeTime standard qPCR Assay Taqman primer/probe sets (Supplementary Table 5) and PrimeTime gene expression master mix (IDT, Coralville, IA, USA) according to the manufacturer’s instructions.
Cell Viability
Following 24 h exposure to cytokines, cells were co-stained with 1 μM calcein-AM and 1 μg/ml Hoechst-33342 in PBS, incubated for 30 min, then imaged to evaluate cell viability and neurite outgrowth. Cell death was evaluated using the CytoTox-ONE Homogeneous Membrane Integrity Assay (Promega, Madison, WI, USA) per the manufacturer’s directions. Lysis solution containing 9% Triton-X 100 was used as a positive control. Apoptosis was quantified using the Caspase-Glo 3/7 Assay (Promega) per the manufacturer’s instructions at the following days and times post-exposure (in DMII media): D2 – 6 h; D3 – 16 h; D6 – 4 h, 16 h. Staurosporine (10–100 nM) was used as a pro-apoptotic control. Fluorescence at excitation/emission wavelengths 560/590 nm and luminescence were recorded using a BioTek Synergy H1 Hybrid Reader (Winooski, VT, USA).
Imaging and Automated Analysis
Images were acquired using the ImageXpress Micro XL high-content imaging system (Molecular Devices, Sunnyvale, CA, USA), and automated image analysis was performed using MetaXpress software (Molecular Devices, versions 5.3 and 6.2, RRID:SCR_016654). Quality control was run on all images; those that were not in focus or had high background or poor staining were discarded. Controls were run with each data set to determine thresholds, validate cellular responses, and confirm consistency in staining between experiments.
Data Analysis and Statistics
Statistical analyses were performed using GraphPad Prism 8 software (San Diego, CA, USA, RRID:SCR_002798) with n being an independent experiment comprised of at least 3 technical replicates and alpha set to 0.05. ICM conditions were compared to vehicle control by an ANOVA with correction for multiple comparisons, either one-way (if data passed Shapiro-Wilk normality test and Brown-Forsythe variance test) or nonparametric. Specific details are provided in Figure legends. Controls were compared to vehicle by an unpaired t test, using Welch’s correction if standard deviations were different and Mann-Whitney for nonparametric data. qPCR data was analyzed using the Pfaffl method and 2-way ANOVA with Dunnett’s test.
RESULTS
At maternal serum concentrations, EMA cytokines do not alter cell viability or neurite outgrowth
To synchronize the differentiation of LUHMES cultures, cells were pre-differentiated for 48 h then re-plated into multi-well plates on D2 [41]. After re-plating, cells rapidly extend neurites, and by D6, cells are considered mature, post-mitotic neurons [41]. Cells were exposed to cytokines for 24 h from D2-D3 to assess effects on initial neurite extension and from D5-D6 to evaluate effects on established networks [43] using reduced growth factor media [39]. This exposure paradigm was used to screen the EMA mixture of 9 cytokines (IL-1α, IL-1β, TNF-α, IL-6, IL-17A, IFN-γ, GM-CSF, IL-4, IL-10) and 3 chemokines (IL-8, MCP-1, MIP1-α) [42] at concentrations found in maternal serum samples [M] plus half-log increases or decreases (Supplementary Table 1). However, neither cell viability nor neurite outgrowth was changed at either time point following exposure to these cytokines added individually (Supplementary Figures 1–4) or in combination (Supplementary Figures 5–6) at [M] concentrations.
ICM activates NF-κB p65 and modulates cytokine receptor expression
An inflammatory cytokine mix (ICM) consisting of TNF-α (5.6 pg/ml), IL-1β (15 pg/ml), IL-6 (27 pg/ml), IL-17A (0.7 pg/ml), and IFN-γ (5.6 pg/ml), was created from the EMA mix. LUHMES cells were exposed to [M] concentrations with 10-fold increases up to 104 X [M] (Supplementary Table 2). These concentrations reflect the robust increases in ICM cytokines observed in maternal serum and the fetal compartment following MIA [8,13,14,44]. To confirm that LUHMES cells can respond to cytokine stimulation, transcriptional expression of their receptors was verified (Supplementary Figure 7A).
The translocation of NF-κB subunit p65 (RelA) from the cytoplasm to the nucleus is a characteristic response to inflammatory cytokine signaling in immune cells [45]. Therefore, nuclear localization of NF-κB in response to cytokine mixtures was assessed in LUHMES cells at D2 and D6, using TNF-α (1, 100 ng/ml) as positive control. While [M] concentrations of EMA mix did not activate NF-κB (Supplementary Figures 5F, 6F), ICM significantly increased NF-κB nuclear localization in LUHMES cells at concentrations ≥ 102 X [M] (Figure 1A–E, Supplementary Figure 8A–B). No differences were observed in TUBB3 staining, number of cells, mean cellular area, or mean nuclear area (Supplementary Figure 8C–J). Based on these observations, ICM concentrations of 102-104 X [M] were used for the remaining experiments. The EMA mix and individual cytokines of the ICM were retested at 103 X [M], and the ability of the NF-κB nuclear translocation inhibitor TPCA-1 to block the ICM responses was assessed (Supplementary Figure 9). This higher concentration of EMA increased NF-κB nuclear localization, but only TNF-α phenocopied the effect of EMA and ICM. TPCA-1 largely prevented cytokine-induced nuclear localization of NF-κB (Figure 1F–G).
To examine effects of ICM on cytokine receptor expression, LUHMES cells were exposed to ICM for 48 h from D2–4 or D4–6 (Figure 2A). Expression of receptor subunits that function as signal transducers (IFNGR2, IL10RB) was upregulated upon exposure to higher concentrations of ICM, while expression of their ligand binding partners (IFNGR1, IL10RA) was not changed (Figure 2B–E). ICM also significantly increased expression of TNFRSF1A, TNFRSF1B, IL6ST, and IL4R, but decreased levels of IL17RA transcripts on D4 (Figure 2F–J). ICM had no effect on reference genes or the chemokine receptor CCR1 (Supplementary Figure 7B–E).
ICM induces apoptosis and reduces viability
NF-κB signaling can regulate cell survival in neurons [46], therefore, the effect of ICM on cell viability was assessed in LUHMES cells. A 24 h exposure to ICM at 103-104 X [M] decreased cell viability on D3 and D6, as indicated by a decreased percentage of cells stained by calcein-AM (Figures 3A–C, 4A–C), and increased LDH in the cell culture medium was observed even at 102 X [M] on D3 but not on D6 (Figures 3D, 4D). Live cell count was also decreased after 24 h (Supplementary Figures 10B, 11B); however, the mean area stained by calcein-AM was not changed (Supplementary Figures 10C, 11C). At 102-104 X [M], ICM increased caspase-3/7 activity by 16 h post-exposure on both D3 and D6 (Figures 3G, 4G). Increased caspase-3/7 activity was detected as early as 6 h post-ICM exposure on D2 (Figure 3G) but was not observed at 4 h post-exposure on D6 (Figure 4G).
Apoptosis was further examined at 16 h post-exposure on D3 and D6 to evaluate the effects of the EMA mix and individual cytokines in the ICM at 103 X [M]. On D3, caspase 3/7 activity was increased maximally by ICM and EMA, and the increase due to ICM was partially blocked by the NF-κB inhibitor TPCA-1 (Figure 3H). However, on D6, the effect of ICM on caspase 3/7 activity was further exacerbated by NF-κB inhibition. TPCA-1 alone had no effect on caspase 3/7 activity on D3, but significantly increased caspase 3/7 activity on D6 (Figure 4H). TNF-α increased caspase 3/7 activity on D3 but not on D6; whereas none of the other individual cytokines induced apoptosis on either day.
ICM alters neurite outgrowth
Initial neurite outgrowth was quantified in LUHMES cells on D3 following 24 h ICM exposure (Figure 3A–B, Supplementary Figure 10A). ICM at 103-104 X [M] decreased overall neurite outgrowth (Figure 3E), as well as the total number of processes (Supplementary Figure 10D). When examined on a per cell basis, however, ICM had no effect on the maximum process length (Figure 3F), number of processes, total outgrowth, or mean process length (Supplementary Figure 10E–G). Thus, in cells that survive ICM exposure, there are no effects on initial neurite outgrowth.
ICM was also screened for effects on neurite stability on D6 (Figure 4A–B, Supplementary Figure 11A), by which time LUHMES cells have formed complex networks. A 24 h ICM exposure significantly decreased total number of processes (Supplementary Figure 11D), with a trend towards decreased overall neurite outgrowth (Figure 4E). Similar to D3 results, ICM did not change neurite outgrowth measurements on a per cell basis on D6 (Supplementary Figure 11E–G), although increased maximum process length was trending (Figure 4F).
ICM decreases synaptic puncta
The quantification of punctate staining of synaptic markers is a readout of synapse formation and stabilization, which is often used as a proxy of neuronal connectivity [47]. As LUHMES cells differentiate, expression of synaptic markers increases, peaking around D5 [41]. High-content analysis of synaptic markers [48] was used to identify and quantify excitatory synaptic puncta along MAP2-positive dendritic processes in D7 LUHMES cells via co-localization of the pre- and post-synaptic markers synaptophysin and PSD-95, respectively (Figure 5A–C). While the number of synaptophysin immunopositive puncta was not altered following ICM exposure (Figure 5D), the number of PSD-95 immunopositive puncta was significantly decreased (Figure 5E). Importantly, the number and area (Figure 5F–G) of puncta co-labeled for synaptophysin and PSD-95 was significantly decreased following 72 h of exposure to ICM at 102 X [M]. This ICM concentration did not decrease the area of MAP2 immunoreactivity or the number of cells (data not shown). To understand which cytokines may be driving the effects of ICM on synaptic puncta, individual cytokines of the ICM were tested at 102 X [M]. IL-6 exposure decreased the area of synaptophysin puncta (Figure 5H), while IL-1β exposure decreased the area of PSD-95 puncta (Figure 5I). IL-1β also decreased the number of co-labeled puncta (Figure 5J), and the area of co-labeled puncta was decreased by IL-1β, IL-6, IL-17A, and IFN-γ (Figure 5K). These cytokines did not change overall MAP2 area or the number of cells (data not shown).
DISCUSSION
We demonstrated that two clinically relevant cytokine mixtures, EMA and ICM, activate NF-κB and induce apoptosis in a human neuronal cell line. ICM is biologically active at concentrations starting at 102 X [M], and EMA mix phenocopies ICM at 103 X [M]. ICM also alters cytokine receptor expression, decreases synaptic density, and modulates neurite outgrowth. Two lines of evidence suggest that ICM effects on neurite outgrowth are secondary to cytotoxicity. First, concentrations of ICM that modulated neurite outgrowth also decreased cell viability. Second, while ICM decreased total neurite outgrowth and number of processes, measures of neurite outgrowth per live cell did not differ in D3 or D6 LUHMES cells, although increased maximum process length was trending on D6. These results suggest a continuum of age- and concentration-dependent responses with synaptic connectivity affected at lower cytokine concentrations, and apoptosis susceptible to higher ICM and EMA concentrations.
Many factors influence the sequence and degree of cytokine response in maternal serum and fetal compartment following MIA [8,44,49]. Most of the cytokine concentrations that caused significant cellular responses are in line with those used in previous rodent in vitro studies, which typically range from 1 to 100 ng/ml [22–24,26–28]. In a recent rat study, maternal serum concentrations of IL-6, TNF-α, IL-1β, and IFN-γ increased between 100–900% above control levels, from 150–570 pg/ml to >1 ng/ml 3–6 h following MIA with a viral mimetic [14]. Importantly, MIA can alter placental function [50] and may disrupt concentration gradients across fetal brain tissues of cytokines that are critical for developmental processes. Human embryonic microglia activated with bacterial endotoxin are capable of producing >500 pg/ml TNF-α after 24 h [51], and human neural stem cell-derived neuron/astrocyte co-cultures stimulated with a viral mimetic can secrete >1 ng/ml IFN-γ and IL-6 after 48 h [52]. Thus, the elevated cytokine concentrations used in this study are biologically plausible.
Altered synapse number due to interference with synapse formation, stabilization, or pruning, is implicated in the pathogenesis of NDDs [53,54]. ICM decreases synapse number at 102 X [M], and this effect is largely driven by the cytokines other than TNF-α that do not activate NF-κB. The reduction in PSD-95 caused by ICM in LUHMES cells is of particular note, as this scaffolding protein is an essential component of excitatory synapses on dendritic spines [55], and PSD-95 disruption has been linked to NDDs [56]. Decreased dendritic spine densities have been observed in postmortem brain tissues of patients with NDDs, including Rett syndrome [57], schizophrenia [58], and autism [59], and in a preclinical model, MIA offspring showed reduced dendritic spine density as well as impaired spine dynamics [60].
Aberrant apoptosis is also implicated in the pathogenesis of NDDs [61,62]. On both D3 and D6, apoptosis was increased more by ICM and EMA mix than by any of the individual cytokines, suggesting the importance of interactive effects of multiple cytokines. Interestingly, in terms of caspase 3/7 activity, the magnitude of response was higher at D3, but apoptosis was more sensitive to NF-κB inhibition at D6. Apoptosis is essential for normal neurodevelopment [63], and it is posited that inappropriate apoptosis modulates brain maturation, resulting in altered behavior [61]. Increased apoptosis has been detected in 3 brain regions in samples from ASD subjects [64], and a preclinical MIA model showed that altered apoptotic activity in the postnatal brain was dependent on timing of prenatal immune challenge [44]. The observation that ICM upregulated TNFRSF1A transcripts in LUHMES cells suggest one potential mechanism by which ICM is triggering apoptosis. TNFRSF1A is considered the dominant signaling receptor for TNF-α, and its activation can trigger both necrosis and apoptosis, depending on the specific downstream pathways activated [65]. The activation of TNFRSF1A also activates the canonical NF-κB signaling pathway [66].
NF-κB activation was used as a biomarker to identify biologically active EMA and ICM concentrations in this culture system, and our data suggest TNF-α is likely driving ICM and EMA effects on NF-κB activation. However, NF-κB signaling has been implicated in regulating both apoptosis and synaptogenesis in the developing brain [67]. The activation of NF-κB in developing rodent neurons promotes survival by induction of anti-apoptotic factors [46] and enhances dendritic spine and excitatory synapse density [68]. Our studies using the NF-κB inhibitor TPCA-1 suggest that NF-ĸB activation may contribute to the effects of ICM on apoptosis, although the differential effects of NF-κB inhibition on D3 vs. D6 suggest a mechanistic switch of NF-κB signaling from pro-apoptotic to protective as cells mature. In contrast, testing of individual cytokines suggests that it is unlikely that NF-κB signaling is driving the synaptic changes observed in LUHMES cells exposed to ICM.
A potential caveat of our studies is that LUHMES cells are a transformed cell line; thus, they may differ from primary human neurons in their response to cytokines. It is also not known whether cytokine effects observed in LUHMES cells are generalizable to non-dopaminergic neurons. However, it is important to note that MIA has been shown to directly impact dopaminergic development [69,70], and dysfunction of dopaminergic neurons is implicated in several NDDs [71–73], suggesting the relevance of LUHMES cells as a model for studying MIA as a risk factor for NDDs.
In conclusion, our data demonstrate that clinically relevant cytokine mixtures modulate apoptosis and synaptic density in human neurons. Apoptosis and synaptic density are key determinants of neuronal connectivity, perturbations of which are implicated in the pathogenesis of NDDs [74]. Maternal inflammation triggered by environmental factors or underlying conditions interferes with tightly regulated, local cytokine concentrations in the maternal, placental and fetal compartments. Additionally, alterations in cytokine receptor expression may change the response of neurons to ongoing cytokine stimulation, depending on the other adaptor proteins present [65]. If these changes are sufficient to alter apoptosis and synaptic density, this could contribute to the adverse effects observed in MIA offspring.
ACKNOWLEDGEMENTS
This research was supported by the National Institute of Environmental Health Sciences (grants P01 ES011269 and P30 ES023513) and the United States Environmental Protection Agency (grant R83543201). This research used the Biological Analysis Core of the UC Davis MIND Institute Intellectual and Developmental Disabilities Research Center (U54 HD079125).
The authors have no conflicts to declare.
The data sets generated and analyzed during the current study are available from the corresponding author on reasonable request.
REFERENCES
1.
2.
3.
4.
5.
6.
7.
8.
9.
10.
11.
12.
13.
14.
15.
16.
17.
18.
19.
20.
21.
22.
23.
24.
25.
26.
27.
28.
29.
30.
31.
32.
33.
34.
35.
36.
37.
38.
39.
40.
41.
42.
43.
44.
45.
46.
47.
48.
49.
50.
51.
52.
53.
54.
55.
56.
57.
58.
59.
60.
61.
62.
63.
64.
65.
66.
67.
68.
69.
70.
71.
72.
73.
Floating objects


ICM exposure causes concentration-dependent NF-κB p65 activation in LUHMES cells.
A, LUHMES cells were exposed for 30 min on differentiation D2 or D6 to EMA cytokines, individual or as the ICM or EMA mix at varying concentrations relative to those identified in maternal serum [M]. B-C, Quantitative analyses of nuclear NF-κB staining in LUHMES cells on D2 (B) and D6 (C). TNF-α was used as a positive control. D-E, Representative photomicrographs of LUHMES cells on D2 (D) and D6 (E) exposed to vehicle, ICM at 103 X [M] ± 3 μM TPCA-1. Activated NF-κB (red) translocated to the nucleus (blue) appears pink. β-III Tubulin (TUBB3, green) identifies neuronal processes. Bar=50 μm. F-G, Quantitative analyses of nuclear NF-κB staining on D2 (F) and D6 (G) following exposure to ICM or EMA mix at 103 X [M], individual cytokines at 103 X [M], or TPCA-1 at 3 μM ± ICM. Data presented as mean ± SD (n=3 (B-C) or 4 (F-G, except for EMA group in G, n=3) independent experiments with 4–8 replicate wells per condition per experiment). *p<0.05, **p<0.001, ***p<0.0001 vs. vehicle (V) and ζζζp<0.0001 vs. ICM by one-way ANOVA with post hoc Dunnett’s multiple comparisons test; #p<0.05, ###p<0.0001 vs. vehicle by unpaired t test; &p<0.05 TPCA-1 vs. TPCA-1+ICM by unpaired t test (with Welch’s correction in G).
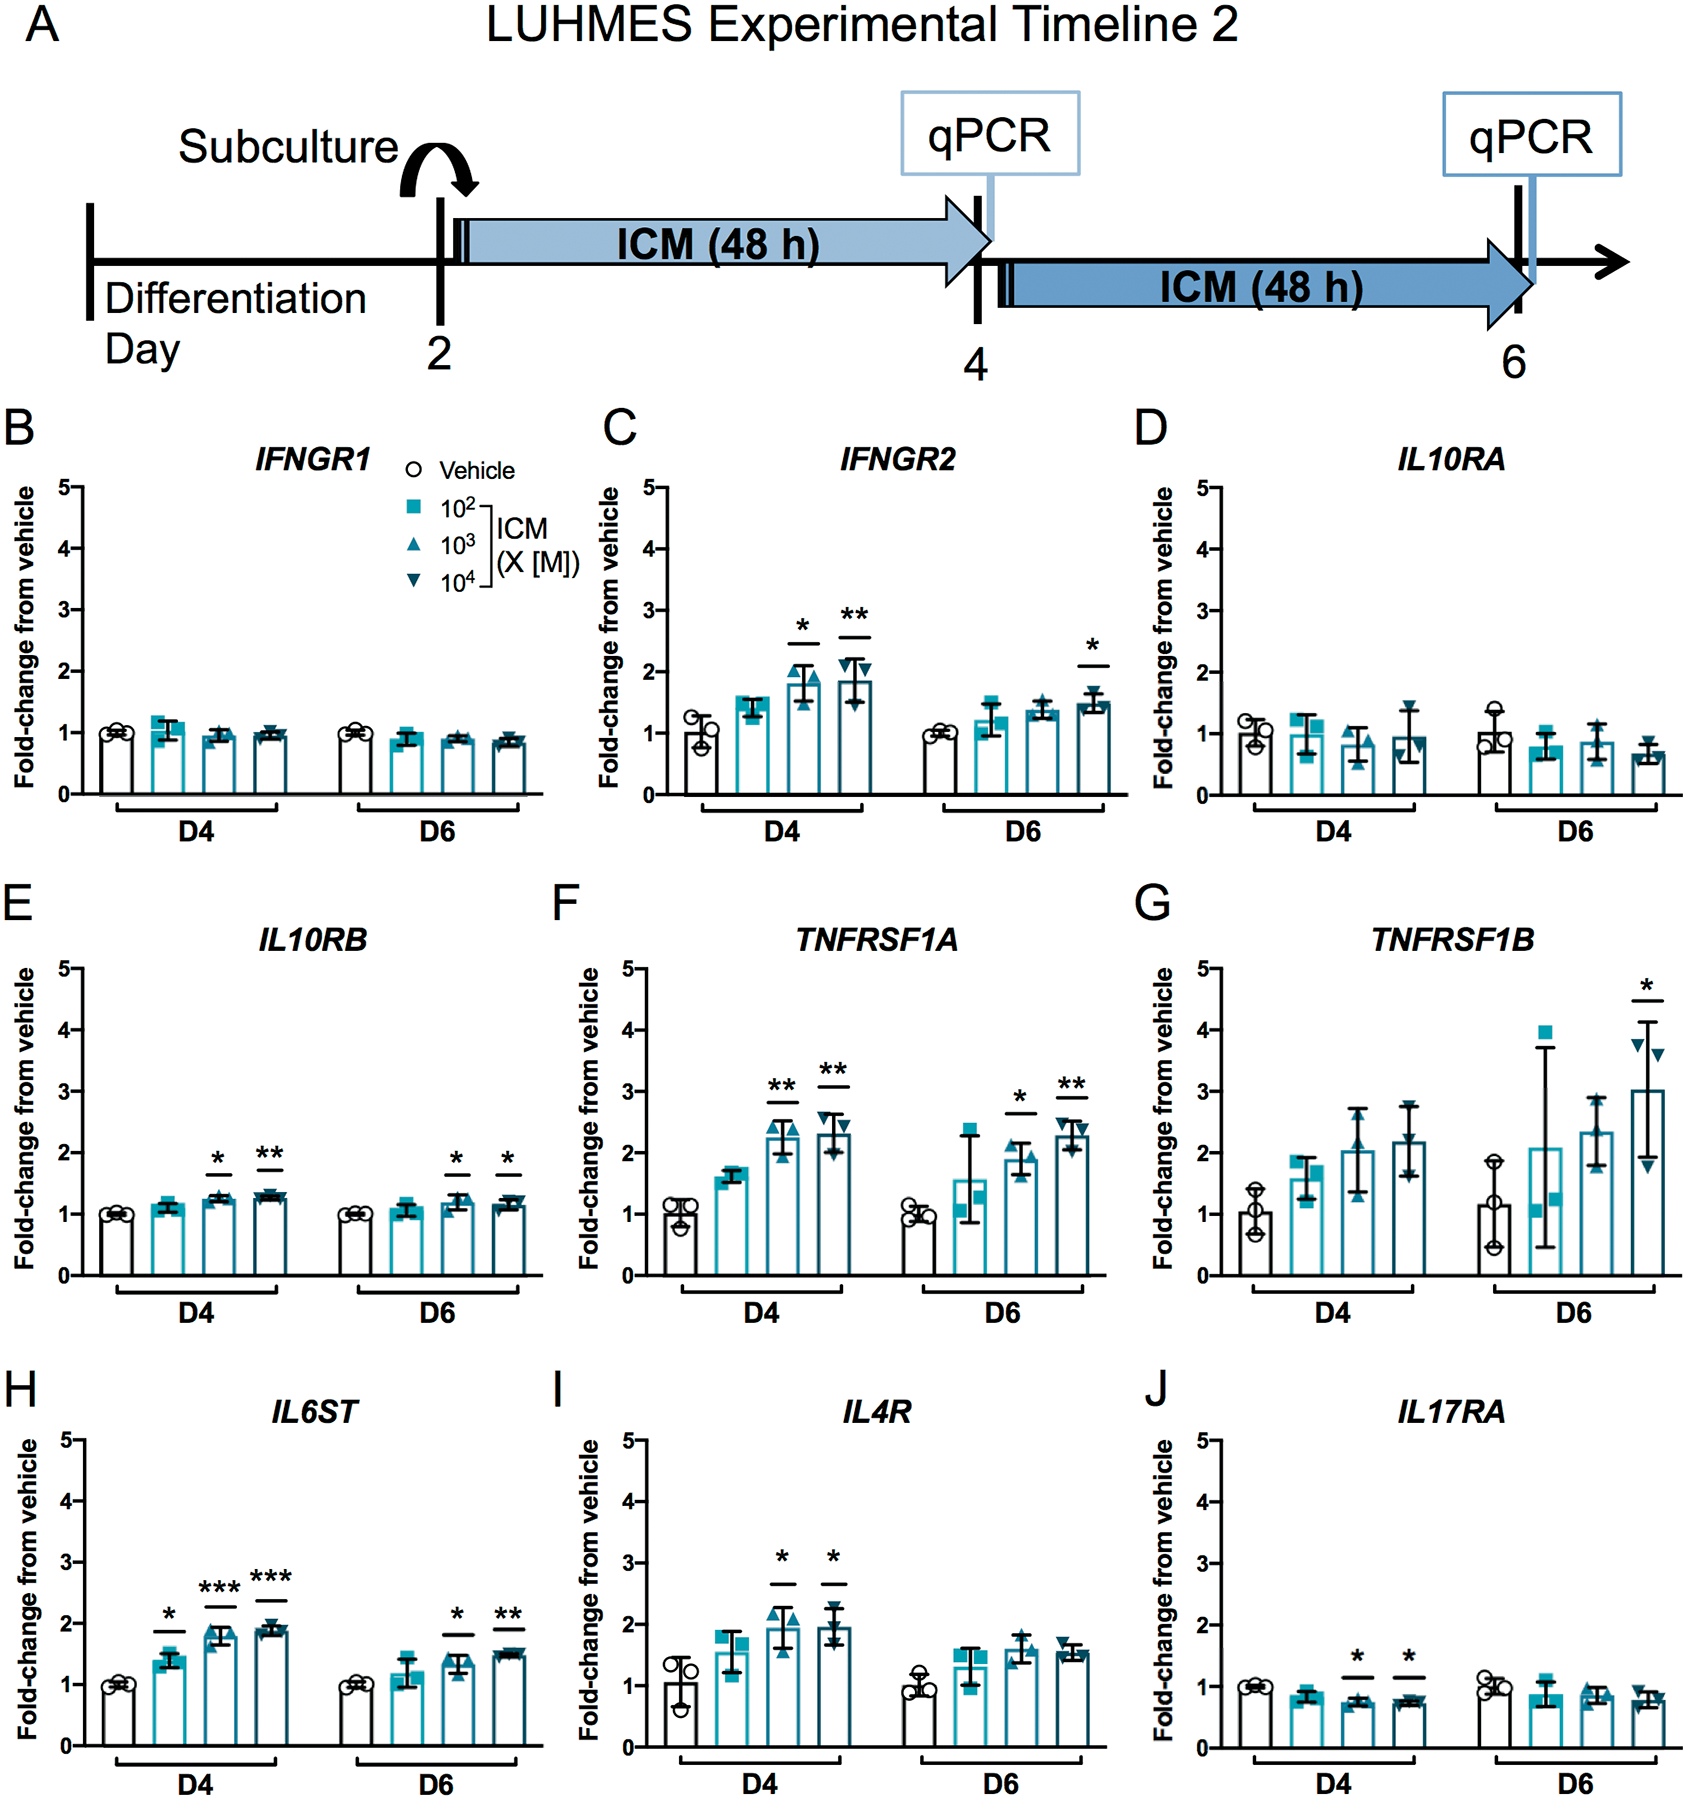
ICM selectively alters cytokine receptor expression in LUHMES cells.
A, Cytokine receptor transcripts were measured in LUHMES cells by qPCR after a 48 h exposure to ICM at 102-104 times maternal serum concentrations [M] from days 2–4 or 4–6. B-J, Relative transcript levels shown as mean ± SD (n=3 independent experiments). *p<0.05, **p<0.001, ***p<0.0001 vs. time point-matched vehicle as determined by 2-way ANOVA with post hoc Dunnett’s multiple comparisons test. IFNGR1, interferon gamma receptor 1 (CD119); IFNGR2, interferon gamma receptor 2; IL10RA, interleukin 10 receptor subunit alpha (CD210); IL10RB, interleukin 10 receptor subunit beta; TNFRSF1A, TNF receptor superfamily member 1A (CD120a); TNFRSF1B, TNF receptor superfamily member 1B (CD120b); IL6ST, interleukin 6 signal transducer (GP130 or CD130); IL4R, interleukin 4 receptor (CD124); IL17RA, interleukin 17 receptor A (CD217).

ICM decreases neurite outgrowth and increases apoptosis on D3.
A, On D2, LUHMES cells were exposed to ICM at 102-104 times [M] starting 1 h after subculturing. After 24 h, conditioned media was collected for a membrane integrity assay and cells stained with a viability dye were imaged. Caspase-3/7 activity was measured at 6 h and 16 h post-exposure. For neurite outgrowth experiments, cycloheximide (c-hex, 3 μM) was used as a control to decrease neurite outgrowth, and Y-27632 (Y-276, 10 μM) as a control to increase neurite outgrowth (Supplementary Figure 9A). B, Representative photomicrographs of D3 LUHMES cells co-stained with the nuclear dye Hoechst (blue) and calcein-AM (green) to visualize neurite outgrowth in live cells; mask used for automated analysis of neurite outgrowth in individual neurons using MetaXpress software shown on right. Bar=50 μm. Cell viability was measured as C, percentage of cells stained with calcein-AM and D, LDH release, normalized to vehicle, with lysis buffer (L, 9% Triton-X 100) as the positive control. E-F, Effects of ICM on neurite outgrowth measured as E, total neurite outgrowth (percent of vehicle) and F, maximum process length per cell. G-H, Quantification of caspase-3/7 activity in D2 and D3 LUHMES cells exposed for 6 or 16 h, respectively, to ICM, EMA mix, individual cytokines, or 3 μM TPCA-1 ± ICM, normalized to vehicle. Data shown as mean ± SD (n=4 (C-G) or 5 (H) independent experiments with 12–24 (C-F) or 4–6 (G-H) replicate wells each). C-F, H, *p<0.05, **p<0.001, ***p<0.0001 vs. vehicle as determined by one-way ANOVA; G, *p<0.05, ***p<0.0001 vs. vehicle as determined by 2-way ANOVA; H, ζp<0.05, ζζζp<0.0001 vs. ICM by one-way ANOVA; specific group differences identified by post hoc Dunnett’s multiple comparisons test. C-F, #p<0.05, ##p<0.001, ###p<0.0001 vs. vehicle as determined by unpaired t test; H, &p<0.01 for TPCA-1 vs. TPCA-1 + ICM by unpaired t test with Welch’s correction.
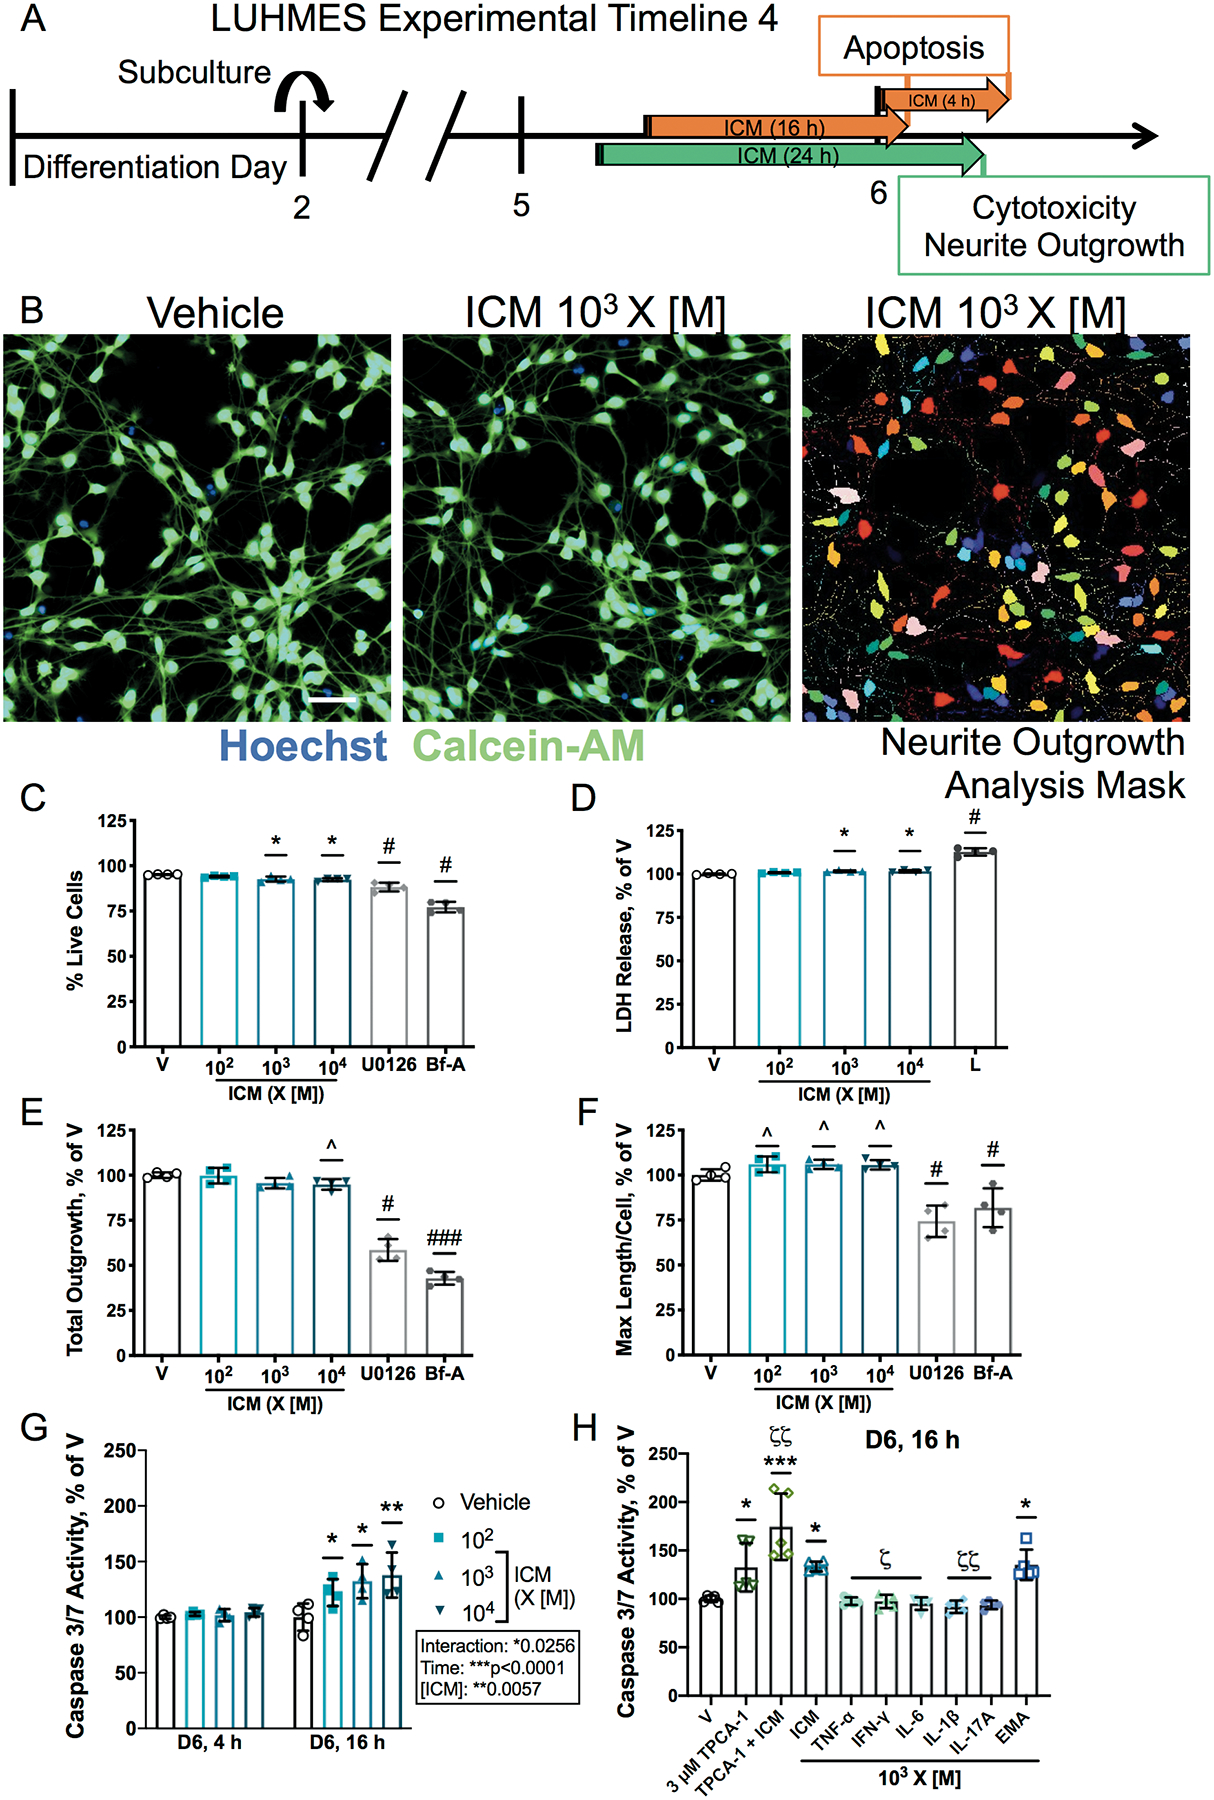
ICM decreases neurite outgrowth and increases apoptosis on D6.
A, LUHMES cells were subcultured on D2 and exposed to ICM at 102-104 times [M] on D5. After 24 h, effects on cell viability and neurite outgrowth were evaluated. Caspase-3/7 activity was measured at 4 h and 16 h post-exposure. For neurite stability experiments, Brefeldin-A (Bf-A,10 μM) and U0126 (30 μM) were used as controls known to decrease neurite outgrowth (Supplementary Figure 10A). B, Representative photomicrographs of D6 LUHMES cells exposed to vehicle or ICM at 103 X [M] co-stained using Hoechst (blue) and calcein-AM (green) and mask for automated analyses of neurite outgrowth in individual neurons. Bar=50 μm. Cell viability was measured as C, percentage of cells stained with calcein-AM and D, LDH release, normalized to vehicle, with lysis buffer (L, 9% Triton-X 100) as the positive control. E-F, Effects of ICM on neurite outgrowth measured in live cells as E, total neurite outgrowth and F, maximum process length per cell, both as percent of vehicle. G-H, Quantification of caspase-3/7 activity in D6 LUHMES cells exposed for 4 h or 16 h to ICM, EMA mix, individual cytokines, or 3 μM TPCA-1 ± ICM, normalized to vehicle. Data shown as mean ± SD (n=4 (C-G) or 5 (H) independent experiments with 12–24 (C-F) or 4–8 (G-H) replicate wells each). C-F, H, ^p<0.1, *p<0.05, ***p<0.0001 vs. vehicle as determined by one-way ANOVA; G, *p<0.05, **p<0.001 vs. vehicle as determined by 2-way ANOVA; H, ζp<0.01, ζζp<0.001 vs. ICM by one-way ANOVA; specific group differences identified by post hoc Dunnett’s multiple comparisons test. C-F, #p<0.05, ###p<0.0001 vs. vehicle as determined by unpaired t test; H, p=0.0596 for TPCA-1 vs. TPCA-1 + ICM by unpaired t test.
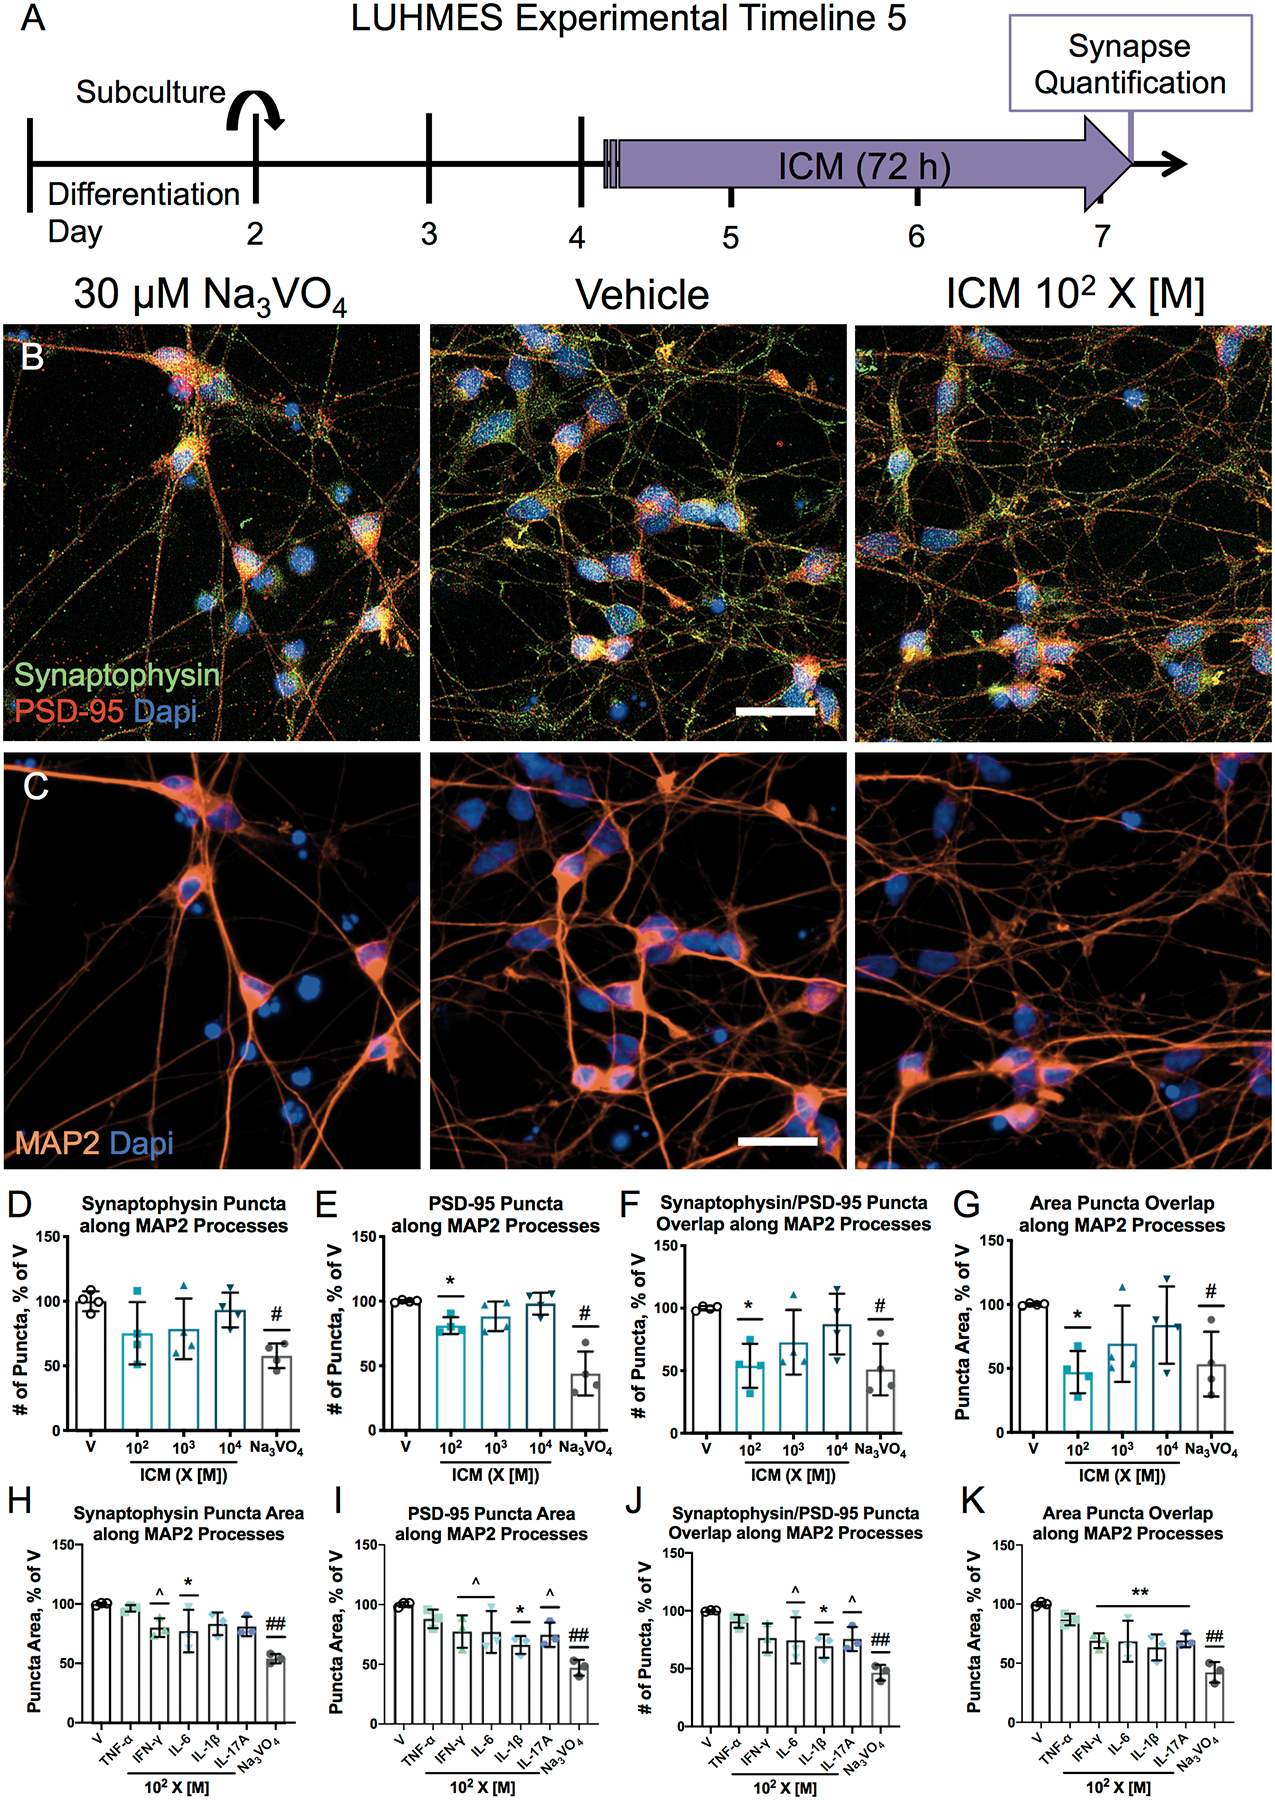
ICM decreases synaptic puncta.
A, LUHMES cells were plated on coverslips in 24-well plates on D2 and exposed to ICM (D-G) or individual cytokines comprising the ICM (H-K) starting at 102 X [M] on D4. After 72 h, cells were fixed, immunostained, and imaged. Sodium orthovanadate (Na3VO4, 30 μM) was used as a control to decrease synaptic puncta. B-C, Representative photomicrographs of D7 LUHMES cells exposed to Na3VO4, vehicle, or ICM. The nuclear dye DAPI (blue) was used to count cells and the number of puncta labeled for presynaptic synaptophysin (green) and postsynaptic PSD-95 (red) were quantified along MAP2-positive processes (orange) using automated MetaXpress image analysis software. Bar=25 μm. D-K, mean ± SD of various measures of synapse number and area, normalized to vehicle (n=4 (D-G) or 3 (H-K) independent experiments with 3–4 replicate coverslips per experiment). D-G, *p<0.05 vs. vehicle as determined by Kruskal-Wallis non-parametric ANOVA with post hoc Dunn’s correction for multiple comparisons; H-K, ^p<0.1, *p<0.05, **p<0.01 vs. vehicle by one-way ANOVA with post hoc Dunnett’s correction for multiple comparisons; #p<0.05, ##p<0.01 vs. vehicle control by unpaired t test (Mann-Whitney in D-G, with Welch’s correction in H-K).